Transcription
2018 Building Performance Analysis Conference andSimBuild co-organized by ASHRAE and IBPSA-USAChicago, ILSeptember 26-28, 2018MODELICA MODELS FOR DATA CENTER COOLING SYSTEMSYangyang Fu1, Michael Wetter2, and Wangda Zuo1,*Department of Civil, Environmental and Architectural Engineering, University of ColoradoBoulder, Boulder, CO 80309, USA2Building Technology and Urban Systems, Lawrence Berkeley National Laboratory, 1 CyclotronRoad, Berkeley, CA 94720, USA*Wangda.Zuo@Colorado.edu1ABSTRACTThis paper presents a package of Modelica models,which are dedicated to data center cooling systems andrecently added to the Modelica Buildings library. Todemonstrate the usage of this package, we modeled achilled water system with an integrated watesideeconomizer, and an air-cooled direct expansion systemwith an airside economizer. These models are thenapplied to evaluate the control performance. After thatwe performed a detailed comparison in terms of systemlevel energy efficiency, economizing hours and supplyair conditions for the two cooling systems. Theadvantages and disadvantages of this package are finallysummarized and discussed.INTRODUCTIONData centers in the US consume about 2% of the nation’selectricity and approximately half of that is used for datacenter cooling. Simulation can be an effective way toassist the design and operation of data centers. Manytools have been developed in academia and industry toperform computer simulation of cooling systems in datacenters. For example, eQuest (Lee and Chen 2013),EnergyPlus (Ham and Jeong 2016), TRNSYS (Agrawal,Khichar et al. 2016), and some customized simulationtool such as Energy Modeling Protocol (Shehabi,Horvath et al. 2008) have been widely used to study thecooling systems with waterside economizers (WSEs)and airside economizers (ASEs) in data centers.The abovementioned tools utilize imperativeprogramming languages such as FORTRAN, C/C ,which makes the tools less extensible. In such programs,models usually tightly couple physical equations,input/output routines with numerical solution methods,by making the numerical solution procedure part of theactual model equations (Wetter 2009). Thisintertwinement makes it difficult to extend theseprograms to support various use cases (Wetter, Bonviniet al. 2016), co-simulations with each other (Radosevic,Hensen et al. 2006, Trcka, Wetter et al. 2007) andeffective optimization (Wetter 2009). What’s more,some energy simulation tools are not suitable forevaluating the system dynamics and the semantics oftheir control has little in common of how actual controlworks. For example, in EnergyPlus, the commonly usedPI control loop is assumed to be ideal, i.e., there will beno overshoot (Wetter 2011). EnergyPlus also idealizesdead band or waiting time, which are frequently used inthe building control process. Moreover, many equipmentmodels have built-in idealized control that requests flowrates, and flow rates are ideally distributed within asystem rather than the results of friction-based flowdistribution for a given valve or pump control signal.This makes it difficult to model, test and verify actualcontrol.To address these problems, the equation-based languageModelica can be used to model and simulate the system,instead of imperative programming language such asC/C . Details about Modelica and how it can benefitsystem modeling and optimization can be found inprevious publications (Fritzson 2014, Wetter, Bonvini etal. 2016).The Modelica Buildings library (MBL) has beendeveloped by Lawrence Berkeley National Laboratory tosupport various use cases regarding to HVAC systems inbuildings (Wetter, Zuo et al. 2014). MBL is an opensource, free library with component and system modelsfor building energy and control systems. Besides theconventional energy analysis, this library can alsoprovide support for rapid prototyping (Wetter 2010),
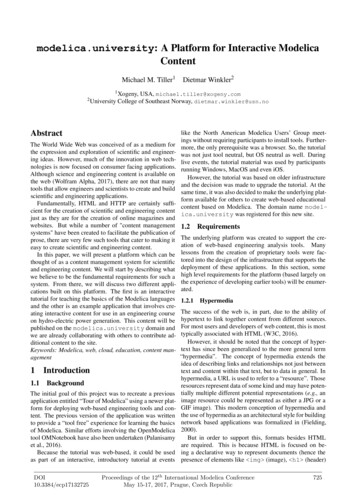
modeling of arbitrary HVAC system topologies (Wetter2010), evaluation of the stabilization of feedback controland Fault Detection and Diagnostics at the wholebuilding system level (Wetter 2009, Lee, Lee et al.2015). It can also be used in the design and operation ofcooling systems for data centers (Wetter, Zuo et al.2014).However, MBL still needs to be extended to support fastmodeling of the cooling systems for data centerapplications, although it includes the major componentmodels such as chiller, heat exchanger, and coolingtower. For example, when users want to evaluatedifferent configurations of the chilled water system withWSEs for the data center during the design phase, theyneed to assemble all the components into the studiedconfiguration one by one. When the number of theconfigurations is large, the modeling processing could betime consuming.In this paper, we implement a package in the MBL tosupport fast modeling of commonly-used coolingsystems in data centers. To introduce this package, wefirst give a brief description of the configurations of thecommonly-used cooling systems in data centers. InSection 3, we give an introduction to the data centerpackage. We also compare the energy efficiency andcontrol performances of two different cooling systems:the chilled water system with an integrated WSE, and thedirect expansion (DX) system with an ASE in Section 4.In the end, the advantages and disadvantages arediscussed.TWOCOMMONLY-USEDCOOLINGSYSTEM FOR DATA CENTERSChilled Water System with WSEsA commonly-used cooling system in data centers is thechilled water system with differently configured WSEs.The WSE can be integrated, meaning the economizer canmeet all or some of the load while the chiller meets therest of the load, or nonintegrated, meaning theeconomizer can only operate when it can meet the entireload. A brief survey shows that the chiller plant withWSEs usually have the following configurations:integrated WSEs on the load side of the common leg ina primary-only chilled water system (Figure 1(a)),integrated WSEs on the plant side of the common leg ina primary-only chilled water system (Figure 1(b)),integrated WSEs on the load side of the common leg ina primary-secondary chilled water system (Figure 1(c)),and nonintegrated WSEs (Figure 1(d)) that can beinstalled in both a primary-only and a primarysecondary system.Figure 1(a) shows an integrated WSE in a primary-onlychilled water system, where the WSE is in series with the(a) Primary-only system with integrated WSEs on the load sideCondenser WaterPumpsCooling TowersTCW,supWaterside EconomizerChillersPrimary PumpTCHW,sup,WSEComputer Room Air HandlersTCHW,supTair,supData Center Room(b) Primary-only system with integrated WSEs on the plant sideCooling TowersCondenser WaterPumpsTCW,supWaterside Computer Room Air HandlersTair,supData Center Room(c) Primary-secondary system with integrated WSEs on the load sideCooling TowersCondenser WaterPumpsTCW,supWaterside Common PipeSecondaryPumpsTair,supComputer Room Air HandlersData Center Room(d) Primary-secondary system with nonintegrated WSEs
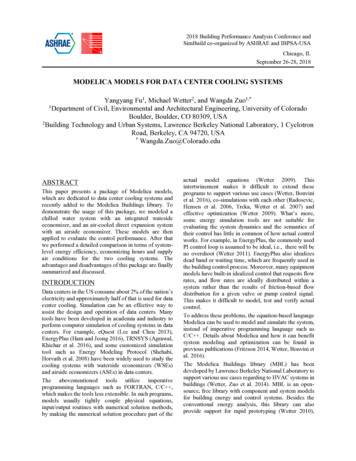
Condenser WaterPumpsCooling TowersTCW,supWaterside EconomizerChillersCommon uter Room Air HandlersData Center RoomFigure 2. Air-cooled DX system with an ASEFigure 1. Chiller plant with WSEschillers on the chilled water return side and in parallelwith the chillers on the condenser water side. The WSEis located on the load side of the common leg, whichallows the WSE to see the warmest return chilled waterfrom the Computer Room Air Handlers (CRAHs) andthus maximizes the hours when the WSE can operate.This is also the reason why the WSE on the load side ismore efficient than that on the plant side (Figure 1(b)).Figure 1(d) shows a primary-secondary system with anonintgrated WSE. The WSE is in parallel with chillerson both the chilled and condenser water side. Thenonintegtrated WSE should be shut off if it cannot meetthe entire cooling load. Otherwise, when the chillers andnonintegrated WSE work simultaneously, the supplychilled water will be a blend of the cold water leaving theevaporators and the relatively warm water leaving theWSEs, and possibly exceed the chilled watertemperature setpoint.DX System with ASEsA typical configuration of a DX system with an aircooled Computer Room Air Conditioner (CRAC) and anASE is shown in Figure 2. The data center room can becooled by the ASE, or the air-cooled CRAC or both ofthem. The transition among three cooling states isachieved by regulating the dampers D1 D4. Forinstance, when only the ASE is needed for cooling, thedamper D4 is fully opened and the air-cooled CRAC isswitched off. The supply air temperature is maintainedby adjusting the damper D1 D3. When both the ASEand the CRAC are needed for cooling, the damper D1and D3 is fully open and the CRAC is switched on, whilethe damper D2 and D4 are fully closed. When only theCRAC is needed, the damper D2 is fully open and theCRAC is switched on, while the damper D1, D3 and D4are fully closed.DATA CENTER PACKAGE IN MODELICABUILDINGS LIBRARYThe data center package is released in the MBL 5.0.0.,and contains component models for the abovementionedtwo commonly-used cooling systems in data centers.This package has the same class hierarchy as the MBL,and contains various reusable base classes. These baseclasses together with the inheritance and instantiation inthe object-oriented modeling language Modelicafacilitate modeling and simulation of data center coolingsystems.Chilled Water System with WSEsGeneral DescriptionA group of identical chillers and pumps can be modeledby vectorising existing chiller and pump modelsrespectively. The vectorized equipment model isassigned with the same design parameters but differentperformance curves if needed. The pseudo-code ofvectorization of chillers in Modelica is shown in Figure3. First, a partial class of the chiller model is instantiatedthrough vectorization with a number n by specifying thelength of the array chiller, which can be redeclared witha detailed chiller model later. Line 3 specifies themedium used in the chillers. Line 4 defines the identicaldesign parameters for the identical chillers with thekeyword “each” in Modelica, such as the designcapacity. Line 5 defines the performance curves of eachchiller by obtaining different curves from a performancecurve array. The same instantiation method is also usedto model a group of pumps. In addition, we add isolationvalves in the vectorized models to avoid circulating flowamong components.The CRAH model is created using existing componentmodels in the MBL with control logics added. TheCRAH consists of a cooling coil model, an electricreheater model, a steam humidifier model, and a variable
speed fan model. The control logic is designed to avoidsimultaneously heating and cooling in the CRAH.1replaceable Fluid.Chillers.BaseClasses.PartialElectric chiller[n]2constrainedby are each final replaceable package Medium Medium,4each final parameters parameters,5final performanceCurve performanceCurveArray)6"Identical chillers";Figure 3 Pseudo-code of vectorization of chillers inModelicaThe WSE model is built on a heat exchanger model withconstant effectiveness, and a three-way valve model. Thethree-way valve is on the chilled water side, and can beadjusted to control the chilled water supply temperatureby a built-in PI(D) controller. The three-way valve andthe PI(D) controller can be activated or deactivated basedon user’s needs. For example, if the chilled water supplytemperature at the downstream of the WSE is controlledby regulating the speed of cooling tower fans in freecooling, then the three-way valve and the built-in PI(D)controller should be deactivated. The switch betweenactivation and deactivation is implemented using aBoolean parameter.Detailed Models: WSE ConfigurationsThis package implements four different configurationsof a chiller plant with WSEs, whose schematic drawingsare shown in the dashed boxes in Figure 1.The chiller plant with integrated WSEs (Figure 1(a) (c))can operate in three modes: Free Cooling (FC) modewhen only WSEs are enabled for cooling, PartialMechanical Cooling (PMC) mode when the chillers andWSEs are both triggered, and Fully Mechanical Cooling(FMC) mode when only the chillers are activated. Thetransition among each cooling mode is achieved bymanipulating the associated isolation valves. Forexample, in Figure 1(a), when the cooling system is inthe FC mode, the isolation valves V1 and V2 in chillers,and V5 for bypassing the WSE are shut off. Theisolation valves V3 and V4 in WSEs, and V6 forbypassing the chillers are fully opened so that the chilledwater can flow through the WSE, and then be deliveredby the primary pumps to the CRAHs. In the PMC mode,V1 V4 are fully open, V5 and V6 are shut off. In theFMC mode, while V3, V4 and V6 are shut off, V1, V2and V5 are fully open to deliver the chilled water throughthe primary pumps, chillers, and then CRAHs.The chiller plant with nonintegrated WSEs (Figure 1(d))only have the FC mode and FMC mode. In the FC mode,the WSE is on and the isolation valves V3 and V4 arefully open, while the chillers and the associated valvesV1 and V2 are off. As opposite to the FC mode, the FMCmode requires that the chillers and their associatedvalves be open.DX System with ASEsOne major component in the DX system is CRAC. Aircooled CRAC and water-cooled CRAC with singlespeed, multiple speed or variable speed compressors aremodeled using the DX coil model located inFluid.HeatExchanger.DXCoil. These models are basedon performance curves, and detailed formulas can befound in the reference (Shen, New et al. 2017).ValidationEach component is verified in a simulation example,following the conventions of the MBL mentioned inWetter, Zuo et al. (2014). Due to the class hierarchy inthe MBL and the object-oriented language Modelica, webuilt the data center package based on the base classesand ready-to-use component models in the MBL. Wevalidated the data center package using comparativetesting and analytical verification, which has also beenused to validate all individual component models in theMBL. For example, comparative testing is used tovalidate the water-cooled CRAC model, which comparesthe simulation results of Modelica with EnergyPlus. TheWSE model is validated by analytical verification, whichcompares its results with analytical solutions that arederived for certain steady-state or transient boundaryconditions.EXAMPLESTo demonstrate this package, we analyzed two coolingsystems for a data center. One is a primary-only chilledwater system with an integrated WSE on the load side,and the other is a DX cooled system with an ASE. Wethen compared the system performances of the twodifferent designs.System ModelsThe data center, located in a dry and cold climate zone,has a design cooling load of 1000 kW, but operates at a50%-part-load condition. Two cooling systems aredesigned to provide cooling for the data center: System1 is a primary-only chilled water system with anintegrated WSE on the load side of the common leg(Figure 1(a)), and System 2 is a DX cooled system withan ASE (Figure 2).The data center room is modelled using a mixed airvolume with a heat source. The heat transfers and airinfiltration through envelope are neglected because theyare insignificant compared with the heat generated by thecomputers. No humidifiers are activated in both systems.
System 1The WSE has a constant effectiveness of 0.8, and thebuilt-in controller and three-way valve to control theoutlet water temperature in the WSE are deactivated. Thechiller model is based on performance curves and has avariable speed compressor. The cooling towers use aperformance curve to calculate the approach temperatureat off-design conditions. The sizing of each componentis based on the method introduced in Taylor (2014).The transition among each cooling mode is determinedby the control sequences described by Stein (2009) andits state graph is shown in Figure 4. The initial state ofthe cooling system is in FC mode, where the WSE isswitched on and the chiller is switched off. The chiller isswitched on if 𝑡# %,'(( 20 𝑚𝑖𝑛 and𝑇# 4,567,458 𝑇# 4,567,58: 𝛿𝑇 ,(1)and switched off if 𝑡# %,' 20 𝑚𝑖𝑛 and𝑇# 4,567,458 𝑇# 4,567,58: 𝛿𝑇 ,(2)which represents the approach temperature of the WSE,is set to 1.5 .For the control of cooling towers, the fan speed isregulated to maintain the condenser water supplytemperature at its setpoint in the FMC mode, but it isadjusted to control the temperature of the supply chilledwater leaving the WSE in the FC mode. In the PMCmode, the fan speed is set as 90% rather than 100%(Stein 2009). The reason is the last bit of fan speed from90% to 100% does little to lower the condenser watersupply temperature but increases the fan energysignificantly, although at full speed the cooling towercan make the condenser water as cold as possible andmaximize the WSE output.The chilled water supply temperature is controlled at8 . The speed of the primary pumps is adjusted tomaintain a constant differential pressure of the chilledwater loop. The two-way valve on the waterside of thecooling coil is manipulated to control the temperature ofthe supply air leaving the CRAH at 18 . The speed ofthe supply air fan is modulated to control the roomtemperature at 25 . The setpoint reset strategy and headpressure control in the chillers are not considered.where 𝑡# %,'(( is the time of the chiller in off status, 𝑡# %,' is the elapsed time since the chiller was switchedon, 𝑇# 4,567,458 is the temperature of the supply chilledwater at the downstream of the WSE, 𝑇# 4,567,58: is thechilled water supply temperature setpoint, and 𝛿𝑇 is adead band temperature.The WSE is enabled when 𝑡458,'(( 20 𝑚𝑖𝑛 and𝑇# 4,A8:,458 𝑇4B 𝑇C77,#:,7A8 𝛿𝑇D ,(3)and is disabled when 𝑡458,' 20 𝑚𝑖𝑛 and𝑇# 4,A8:,458 𝑇# 4,567,458 𝛿𝑇E ,(4)where 𝑡458,'(( is the time of the WSE in off status, 𝑡458,' is the elapsed time since the WSE was switchedon, 𝑇# 4,A8:,458 is the temperature of the return chilledwater at the upstream of the WSE, 𝑇4B is wetbulbtemperature of the outdoor air, 𝑇C77,#:,7A8 is the predictedapproach temperature of the cooling tower, 𝛿𝑇E and 𝛿𝑇Dare the offset temperature. In our application, we set𝑇C77,#:,7A8 as the nominal approach temperature in thecooling tower, although many other predictionalgorithms can be used such as using a detailed coolingtower model (Stein 2009), or engineering experience(Taylor 2014). The offset 𝛿𝑇E is set to 0.5 , and 𝛿𝑇D ,Figure 4. State graph of the cooling mode control in theSystem 1System 2System 2 contains an air-cooled, variable-speed CRACwith an ASE. The supply air temperature is controlled at18 by modulating the speed of the compressor in theCRAC in the PMC mode and FMC mode, and byadjusting the outdoor air damper position in the FCmode. The outdoor air damper is fully open during thePMC mode and fully closed in the FMC mode.A temperature-based sequence is used to control theASE. The state graph is shown in Figure 5. The CRACis enabled if 𝑡#AC#,'(( 20 𝑚𝑖𝑛 and
𝑇JB,KL 𝑇C%A,567,58: 𝛿𝑇,(5)and disabled if 𝑡#AC#,' 20 𝑚𝑖𝑛 and𝑇JB,KL 𝑇C%A,567,58: 𝛿𝑇,(6)where 𝑡#AC#,'(( is the time of the CRAC in off status, 𝑡#AC#,' is the elapsed time since the CRAC wasswitched on, 𝑇JB,KL is the drybulb temperature of theoutdoor air (OA), 𝑇C%A,567,58: is the supply airtemperature setpoint, and 𝛿𝑇 is a dead band temperature.The ASE is switched on when𝑇JB,KL 𝑇JB,ML 𝛿𝑇,(7)and switched off when𝑇JB,KL 𝑇JB,ML 𝛿𝑇,(8)where 𝑇JB,ML is the drybulb temperature of the return air.𝛿𝑇 in conditions (5) (8) is set to 1.1 .Here we only consider the energy consumption of the ITequipment and the cooling system when calculating thetotal energy. The calculated PUE for the System 1 andSystem 2 is 1.13 and 1.06 respectively. System 2 is moreenergy efficient because it does not need pumps andcooling towers.Economizing HoursFigure 6 shows for the two systems the normalized hoursof the cooling system status in each month for a wholeyear. Figure 7 shows the hexagon binning plots over theOA dry bulb temperature and the OA wet bulbtemperature for each cooling mode. Such a bivariatehistogram can describe the relationship between theoutdoor weather conditions and the cooling system modecontrol. The color ramp of the hexagons indicates thecount in each bivariate bin. The darker the color is, thelarger the count is.(a)(b)Figure 5. State graph of the cooling mode control in theSystem 2System PerformanceThis section compares the system performance in termsof energy efficiency, economizing hours, and supply airconditions in both systems.Energy EfficiencyPUE, power utilization effectiveness, is commonly usedto quantify the energy efficiency of the cooling systemin data centers. The definition of PUE is shown in (9).𝑃𝑈𝐸 RSTSUVRWX,(9)where 𝐸:':CY is the total energy consumed by the wholedata center, including energy consumption of the ITequipment 𝐸Z[ , the cooling system, and lighting system,and energy losses in the power system etc. The lower thePUE, the less energy is consumed by non-IT equipment,hence energy efficient data centers have a low PUE.Figure 6. Normalized operating time of differentcooling modes in: (a) System 1 and (b) System 2In the dry and cold climate zone, System 1 operates lessin the FC and FMC mode than System 2 for each month,because the cooling mode controller in the System 2 hasa broader activation range for the FC mode and FMCmode than System 1 in terms of the OA dry bulbtemperature and wet bulb temperature (Figure 7). Forexample, System 2 activates the FC mode when the OAdry bulb temperature is lower than the supply airtemperature setpoint of 18 , while System 1 onlyoperates in the FC mode when the OA dry bulb
temperature is lower than about 10 , and the OA wetbulb temperature is lower than approximately 5 .(a)(b)Figure 7. Hexagon bins of the OA dry bulb and wetbulb temperature in each cooling mode for: (a) System1, (b) System 2Supply Air ConditionsFigure 8 shows the scatter plot of the temperature andrelative humidity (RH) of the supply air leaving thecooling coils in each cooling mode for both systems. Thesupply air temperature in System 1 and System 2 can becontrolled at round its setpoint of 18 , but the RH variesin a different range.The supply air temperature can be controlled at 18 during the PMC and FMC mode in both systems, butslightly loses control in the FC mode, wherein the supplyair temperature varies between 18 and 19 .The loss of control of the supply air temperature in theFC mode in both systems is temporary, which is causedby the waiting time in the cooling mode controller(Figure 4 and Figure 5). Take the System 2 as anexample. If the OA dry bulb temperature suddenlyincreases to the supply air temperature setpoint of 18 at the moment when the cooling system works in the FCmode and the CRAC has been switched off for less than20 minutes, then the cooling system will still work in theFC mode rather than switch to the PMC mode. Hence,the supply air temperature will be greater than 18 for awhile until the fire condition for switching from the FCmode to the PMC mode in Figure 5 is satisfied.The RH in System 1 varies within the range of 50% to90%, while that in System 2 fluctuates from around 5%to 85% during the whole year. The reason is that theASE in the System 2 frequently introduces the dryoutdoor air to the data center room, which contributes tothe humidity disturbance.(a)(b)Figure 8. Supply air conditions in each cooling modefor: (a) System 1 and (b) System 2DiscussionsThis package has the following advantages: first, it caninherit the advantages of the Modelica language andMBL. Modelica-based modeling platforms providesome important features such as object-oriented, andacausal modeling, and support a rich library of numericalsolvers for Ordinary Differential Equation, andDifferential Algebraic Equation systems. MBL providesseveral associated tools to support an automatedworkflow, coupled simulation with legacy buildingsimulation programs, or connections to hardware(Wetter, Zuo et al. 2014).Second, it supports fast modeling of the chilled water andDX cooling systems in the data center. This package isbuilt on the MBL, which provides a rich library of baseand ready-to-use HVAC equipment models. Besidesthat, we have added different configuration models of thechiller plant with WSEs, which can be used to quicklybuild a system-level model using the drag & drop.Third, it supports the analysis of dynamic processes inthe cooling and its control system. Through the analysisof the control, we can identify deficiencies of the controlsystem. For example, in System 1, the transitionconditions in terms of dry bulb temperature and wet bulbtemperature do not have a clear boundary for the FCmode and PMC mode (Figure 7). When the OA wet bulbtemperature and the dry bulb temperature are both in therange of 0 to 10 , the system can operate in both theFC and PMC mode for a long time. It means that thesystem sometimes is controlled to run in the PFC modewhen it could run in the FC mode, which hence does not
maximally utilize the cold outdoor air to cool the datacenters.However, currently only a few system configurationshave been implemented. For other configurations, usersneed to assemble system models component-wise byinstantiating, through drag & drop modeling,components of mechanical equipment and controlblocks, and connect them to form a system model.CONCLUSIONSTo support fast modeling of cooling systems in datacenters, we implemented in the Modelica Buildingslibrary a data center package that contains majorcomponent models for chilled water plants and directexpansion cooling systems. This package has beenshown to be able to perform detailed analysis of coolingsystems in terms of energy efficiency as well as controlevaluations for data centers.ACKNOWLEDGEMENTThis research is financially funded by U.S. Departmentof Energy under the award NO. DE-EE0007688. Thiswork was also supported by the Assistant Secretary forEnergy Efficiency and Renewable Energy, the U.S.Department of Energy under Contract No. DE-AC0205CH11231.This work emerged from the IBPSA Project 1, aninternational project conducted under the umbrella of theInternational Building Performance SimulationAssociation (IBPSA). Project 1 will develop anddemonstrate a BIM/GIS and Modelica Framework forbuilding and community energy system design andoperation.REFERENCEAgrawal, A., M. Khichar and S. Jain (2016). "TransientSimulation of Wet Cooling Strategies for a DataCenter in Worldwide Climate Zones." Energy andBuildings 127(2016): 352–359.Fritzson, P. (2014). Principles of object-orientedmodeling and simulation with Modelica 3.3: acyber-physical approach, John Wiley & Sons.Ham, S.-W. and J.-W. Jeong (2016). "Impact of aislecontainment on energy performance of a data centerwhen using an integrated water-side economizer."Applied Thermal Engineering 105: 372-384.Lee, D., B. Lee and J. W. Shin (2015). Fault Detectionand Diagnosis with Modelica Language using DeepBelief Network. Proceedings of the 11thInternational Modelica Conference, Versailles,France, September 21-23, 2015, LinköpingUniversity Electronic Press.Lee, K.-P. and H.-L. Chen (2013). "Analysis of energysaving potential of air-side free cooling for datacenters in worldwide climate zones." Energy andBuildings 64: 103-112.Radosevic, M. T., J. Hensen and A. T. M. Wijsman(2006)."Distributed building performancesimulation—a novel approach to overcome legacycode limitations." HVAC&R Research 12(S1): 621640.Shehabi, A., A. Horvath, W. Nazaroff, S. Ganguly, A.Gadgil, K. Traber, H. Price and R. Engineers (2008).Energy Implications of Economizer Use inCalifornia Data Centers ACEEE Summer Study onEnergy Efficiency in Buildings, Pacific Grove, CA,U.S.A.Shen, B., J. New and V. Baxter (2017). "Air sourceintegrated heat pump simulation model forEnergyPlus." Energy and Buildings 156: 197-206.Stein, J. (2009). "Waterside Economizing in DataCenters: Design and Control Considerations."ASHRAE Transactions 115(2): 192-200.Taylor, S. T. (2014). "How to design & control watersideeconomizers." ASHRAE Journal 56(6): 30-36.Trcka, M., M. Wetter and J. Hensen (2007). Comparisonof co-simulation approaches for building andHVAC/R system simulation. Proceedings of theInternational IBPSA Conference, Beijing, China.Wetter, M. (2009). "Generic Optimization Program UserManual Version 3.0. 0." Lawrence BerkeleyNational Laboratory.Wetter, M. (2009). "Modelica-based modelling andsimulation to support research and development inbuilding energy and control systems." Journal ofBuilding Performance Simulation 2(2): 143-161Wetter, M. (2010). "A Modelica-based model library forbuilding energy and control systems." LawrenceBerkeley National Laboratory.Wetter, M. (2011). A View on Future Building SystemModeling and Simulation Building PerformanceSimulation for Design and Operation. J. L. M.Hensen and R. Lamberts. Routledge, UK.Wetter, M., M. Bonvini and T. S. Nouidui (2016)."Equation-based languages–A new paradigm forbuilding energy modeling, simulation andoptimization." Energy and Buildings 117: 290-300.Wetter, M., W. Zuo, T. S. Nouidui and X. Pang (2014)."Modelica buildings library." Journal of BuildingPerformance Simulation 7(4): 253-270.
Data centers in the US consume about 2% of the nation's electricity and approximately half of that is used for data center cooling. Simulation can be an effective way to assist the design and operation of data centers. Many tools have been developed in academia and industry to perform computer simulation of cooling systems in data centers.