Transcription
Data SheetA10 Harmony ControllerAgile Management, Automation, Analytics forMulti-Cloud EnvironmentsA10 Harmony Controller provides centralized agile management,Platformsautomation and analytics for A10 secure application servicesdeployed over various underlying infrastructure—from data centersto private, public and hybrid clouds.Agile Management& Analytics forAny ApplicationDeploymentThe A10 Harmony Controller providescentralized management and analytics forA10 secure application services includingA10 Thunder ADC, SSLi , CFW, and CGN inmulti-cloud environments for applicationconfiguration and policy enforcement.The integrated application delivery andsecurity solution with Harmony Controllerhelps collect, analyze and report on applicationcentralized analytics over A10’s SSL Insight,CGNAT, Gi/SGI firewall, and GTP firewallvisualize security posture with integrateddashboards for better operational efficiency.With the Harmony Controller, organizationscan efficiently automate deployment andoperations of application services, increaseoperational efficiency and agility, enhanceend-user experiences and reduce TCO,simplify the management of distributedapplication services to dramatically shortentroubleshooting times, receive alertson performance or security anomalies,improve capacity planning and optimize ITinfrastructure and cloud environments.traffic flowing through A10 Thunder ADC. TheTalkWith A10Weba10networks.com/harmony1
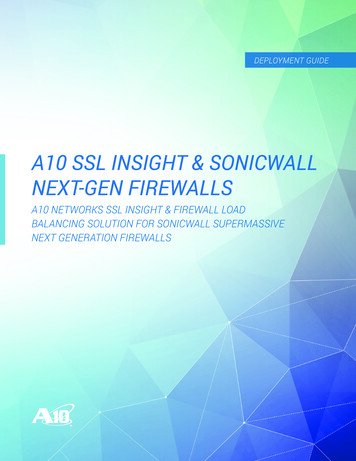
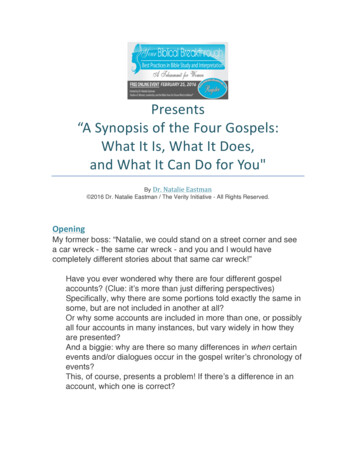
Features and BenefitsThe Harmony Controller simplifies application services operation and increases the agility of the operation teams.As a centralized management solution over A10’s secure application services, the controller supports DevOps/SecOps workflow by automating configuration and control using APIs. The controller can be single point ofintegration with orchestration systems used within organizations. It also provides comprehensive infrastructure& per-application insights, analytics for performance & security, anomaly detection and faster troubleshooting.Harmony ControllerThunderADC SLB/ADC WAF DNS/GSLBv4v6ThunderCGN Large Scale NAT IPv6 MigrationThunderSSLi SSL VisibilityApplication ServiceData CenterThunderCFW Gi/SGi-Firewall GTP FirewallSecurityPrivate CloudPublic CloudFigure 1. Harmony Controller is centralized management solution enabling application service analytics and automation acrossmultiple data centers and cloud environments.Centralized ManagementCentralized management for A10’s broad product portfolio of secure application services including ThunderADC, SSLi, CFW and CGN. Easily manage & monitor devices and configure policies across applicationsdeployed in data centers, private and public clouds.Application Traffic and Security AnalyticsGain visibility and actionable insights into the application traffic. Harmony Apps help analyze collected data todetect anomalous trends, and simplify troubleshooting via access to contextualized data and logs. Operatorscan get alerts based on various metrics and customizable fields, via email or web-hook URL for automated andrapid action.Multi-Tenancy and Self-ServiceEach L3V or service partition of a Thunder device cluster gets mapped to a tenant, representing the setof application services running in that partition. Harmony Controller’s hierarchical tenancy model enablesmulti-tenancy operation across any data centers and clouds, and enhances agility by allowing eachapplication team and service owners to manage their own policies.2
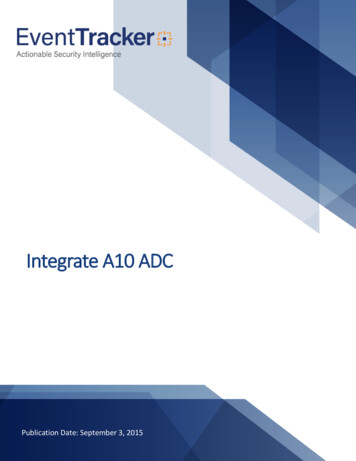
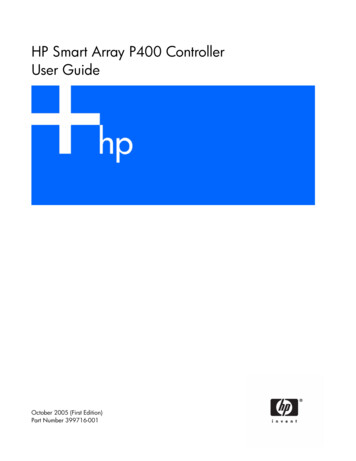
Device Lifecycle ManagementCentralized device lifecycle management for A10 hardware appliances or virtual instances. Easily managelarge number of devices by applying common templates. Backup and restore configuration and performscheduled software upgrades.API Driven AutomationComprehensive APIs to integrate with DevOps tool chains like Ansible, Chef, Jenkins and orchestrationsystems like VMware VRO/VRA, Cisco Cloud Center, Microsoft Azure, Google Cloud Platform, Amazon WebServices and more. REST APIs are available for application configuration, device operations and accessinganalytics data.Platform Agnostic InstallationThe Harmony Controller’s container-based, microservices architecture allows controller to be deployed inany environment in a Linux machine on bare-metal, virtualized servers and on public or private clouds.Analytics and InsightsAPIDevice ConfigurationAlerts and EventsAPPApplication ConfigurationSecurity MetricsTraffic RoutingInfrastructure Health MetricsHarmony ControllerTraffic PoliciesTraffic MetricsSecurity Policiesv4ApplicationDeliveryv6CGNAT/IPv6 Migration5GSSL InsightGi/SGiFirewallGTPGTP FIrewallHarmony Apps for A10 Secure Application ServicesFigure 2. Harmony Controller simplifies and automates application management and operation in any and multi-cloud environment.3
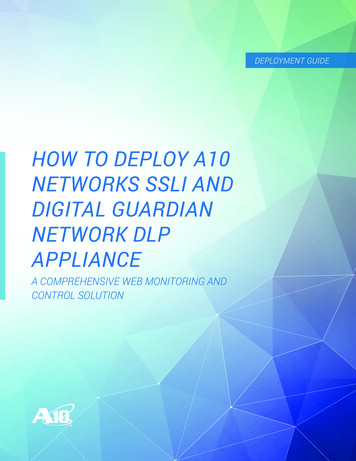
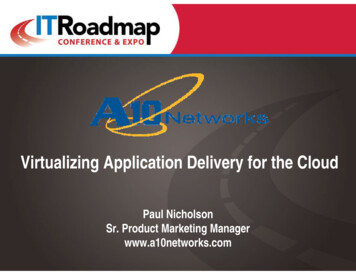
Harmony Controller InterfacesHarmony AppsHarmony PortalHarmony API API ClientA10 Harmony ControllerSaaS or ion ServicesClusterFigure 3. Harmony Controller manages various application services, client APIs and administrative capabilities. This deploymentmodel helps organizations configure all policies in a central location, regardless of where application services are deployed.Harmony PortalHarmony APIsThe portal is an intuitive graphicalThese APIs enable orchestration anduser interface for managing secureconfiguration. All application serviceapplication services infrastructurecapabilities are available via the RESTfuland associated policies on a per-appinterface. APIs may be used to integratebasis, with role-based access controlwith deployment automation tools like(RBAC). Per-app based visibility andChef, Puppet and Ansible, as well as CI/insights are available via Harmony AppsCD tools like Jenkins. Analytics APIswhich operators can pick and enable onalso provide access to Per-App metricsthe Portal. The self-service capabilityand logs. They may be used to integrateeliminates the need for centralized ITwith third-party tools or to help buildadmins to set up and configure the per-custom dashboards.application infrastructure, maximizingagility and operational savings to supportmultiple application teams.4
Deployment ModelsSaaS – Managed by A10Available as a service, the cloud-based Harmony Controller is fully managed and monitored by A10.Application teams can directly get a ‘Tenant’ account on SaaS Harmony Controller or the IT team of theorganization can get a ‘Provider’ account and manage their own internal or external tenants.Only control messages, metrics and telemetry data are sent between the controller and service instancessuch as A10 Thunder devices via a secure, TLS-encrypted channel. Application traffic does not flowthrough the controller. This ensures application data remains within the customer’s network.The controller is built on top of a hardened operating system, installed in a highly available configurationand hosted at a public cloud provider. The A10 Networks’ team runs regular security scans and audits forsecurity vulnerabilities. The controller offers multiple layers of security that are reviewed to ensure securityand compliance.The SaaS controller is in an isolated environment with network layer ACLs and access is granted toauthorized personnel. Data exchanges within the subsystems are encrypted using strong ciphers andsensitive data like passwords; SSL private keys are stored in the database with strong encryption. Externalaccess is always through industry-standard TLS communication.Self-Managed – On-Premise and CloudThe controller may also be deployed as a customer-managed, scalable software solution or hardwareappliance within a customer’s environment in data centers or clouds, including bare metal server,hypervisor based VM, Amazon Web Services, Google Cloud Platform and Microsoft Azure.The self-managed controller can be installed on any physical or virtual machine instance running CentOSor RHEL 7.4 and up operating system. The internal microservices architecture of the controller maximizesthe availability of the controller. Additionally, the architecture ensures that the traffic disruption neverhappens even if connection between the controller and application services is down.Harmony Controller Software System RequirementsHarmony Controller can be installed standalone or high-availability (HA) in Linux machines (CentOS orRHEL) on any bare metal, hypervisor or cloud instance. HA is supported with three nodes deployments (i.e.virtual machines or devices), providing resiliency in case of a node failure. Microservices as well as datastores of the controller are distributed over these three nodes.Actual resource requirement depends on the number of managed devices and analytics needed. ForHarmony Controller installation, it’s not required to prepare special or high-spec hardware, you can useany grade of server hardware. SSD (solid state drive) storage is preferred because of its high IOPS value.For more details of system requirements and pre-requisites for the controller installation, refer to the latestproduct documentation or contact A10 sales representative.5
LicensingThe controller software subscription is priced based on the bandwidth units consumed by managed devices. These bandwidthunits are called Managed Bandwidth Units or MBU. Each Thunder device has a fixed MBU value. The bandwidth unit pool can beused flexibly to managed different devices with varied bandwidth units. The subscription packages are available for one or threeyear packages. Gold support is included with all software subscription packages. A10 Thunder device licenses are required to bepurchased separately.Supported ApplicationServicesA10 Thunder CFWA10 Thunder ADCand secure web gateway, along with ADC and CGNA10 Thunder Convergent Firewall features a data centerfirewall, site-to-site IPsec VPN, Gi/SGi firewall, GTP firewallcapabilities, for service providers and enterprises.A10 Thunder ADCs are high-performance advanced loadbalancing solution that enables your applications to behighly available, accelerated, and secure.A10 Thunder CGNA10 Thunder CGN provides high-performance, transparentA10 Thunder SSLinetwork address, and protocol translation, enabling serviceSSL Insight feature is the comprehensive SSL/TLStransition to IPv6 standards.providers and enterprises to extend IPv4 connectivity anddecryption solution that enables your security devicesto efficiently analyze all enterprise traffic while ensuringcompliance, privacy, and boosting ROI.6
Harmony Controller Features ListHarmony PortalDevice InventoryComplete device inventory is available in multiple forms like individual device view, physical cluster view,logical cluster view etc.CLI Command UtilitiesSingle or a batch of CLI commands can be pushed to multiple device partitions simultaneously.Device UpgradeUpgrade of Thunder devices can be done remotely using Harmony Portal.Health Monitoring of DevicesHarmony Controller monitors health of connected devices and provides intuitive dashboard including thesystem utilization, device location, events and alerts information per tenant service.Device Config Backup and RestoreThunder is a state-full device. Its configuration can be backed up from Harmony Portal and restored back asneeded.Manage Devices in Multiple CloudsHarmony Controller manages Thunder devices deployed across various cloud environment in differentgeographies.Centralized Configuration Tool (Objects Explorer)Object Explorer enables application service level configurations for ADC, GSLB, CGNAT, Gi/SGi FW, WAF, andother application and security features. It also allows to scan current configuration from the connectedThunder devices.Auto Provisioning of Thunder in CloudHarmony Controller can interoperate with private/public cloud infrastructure environments to auto-launchand manage virtual Thunder devices. It includes AWS, Micrsoft Azure VMware ESXi, Kubernetes and more.OperationsRESTful APIsEvery operation including device management, application configuration, reading analytics data etc., can bedone using Harmony APIs. Any integration or automation can be achieved using these APIs.Multi-tenancy via Provider-Tenant ModelManagement functions are divided between Provider and Tenant. Harmony Controller can host multipleproviders. Each provider can have multiple tenants and multiple users. There is no limit or license imposed onthe number of management entities (Providers, Tenants or Users). 500 management entities may be createdas needed.Role-based Access ControlUsers with appropriate permissions at provider, tenant or device level can access only the areas they areauthorized to. Multiple users can login simultaneously and administer their respective areas.AlertsMetrics collected from ADCs are correlated and evaluated against user-defined rules for raising alerts. Thesealerts are delivered via email for manual action and via webhook for automation using with collaboration toolssuch as Slack and Microsoft Teams.External AuthenticationA provider can select the authentication provider for its users. Other than local user authentication, Any LDAP,Radius or TACACS based server can be used.Configuration BackupHarmony Controller configuration can be backed up by copying and storing externally.Scheduled ReportsVarious reports (in PDF format) can be scheduled for periodic consumption of management. In addition, anyanalytics page can also be printed to PDF.Installation and MaintenancePlatform Agnostic InstallationThe Harmony Controller software can be installed in any environment on physical orvirtual Linux machines.Self-healing Micro-services BasedArchitectureThe controller internally consists of multiple micro-services. The framework brings back themicro-service automatically if it stops working.Configuration via APIsConfiguration of controller itself can be monitored and changed via the APIs exposedby the controller.Disaster RecoveryActive and passive Controllers can be deployed in different geographies for quickly recovering incase primary location becomes unavailable because of any disaster.7
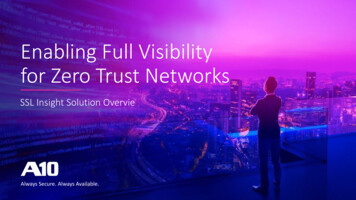
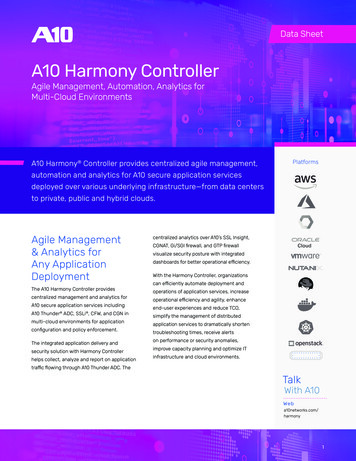
Figure 4. Harmony Portal providescomprehensive dashboard and analyticsshowing health and events for the secureapplication service infrastructure. The sampleshows devices status and detailed alert insightsFigure 5. Harmony Apps collection. HarmonyApps provide full visibility and analytics on perapplication basis, and are available for SLB/ADC,CGNAT, SSL Insight, Gi/SGi Firewall, GTP Firewalland else.8
Harmony Apps Features ListADC/SLB AppClient User request insights – request methods, response code and time-series request statistics Average end-to-end latency showing response time clients are experiencing for each segment (client – ADC – appserver) Clients insights - geographical distribution, client properties including operating system, device, browser type Top clients by requests and throughputInternet Application traffic analytics by geographical locations for latency, number of requests (HTTP/HTTPS) andthroughputWAF WAF policy violation insights including violation types distribution, HTTP threshold violations and protocol violations Time-series WAF violation statistics by types Time-series WAF request handling and events statistics Cookie security insights Top sources for received requests that triggered WAF policy violationsADC Service Time-series chart for distribution of connections and response counts across application servers Time-series application traffic throughput (uplink/ downlink)Analytics & Insights(Service Port Level) Time-series chart for average reverse and forward latency Time-series chart for number of error traffic with response code 3xx, 4xx and 5xx HTTP2 insights – time-series of HTTPs traffic including proxy connection stats, volume, streams closed, frametypes sent to client and else TLS/SSL insights – time-series of TLS connections for both client side and server side HTTP acceleration insights for RAM caching utilization and compression usageApplications & AppServers Time-series applications performance including response time and end-to-end latency Application service insights including top visited URLs/ Domains, slowest URLs, etc. Time-series backend server insights including server health, response time, new connections and currentconnectionsThunder Cluster ADC devices/ cluster system utilization (CPU, Memory) and throughput (peak and average) Deployment locations in world map Time-series cluster traffic chart based on throughput and active sessions for both directions (ingress and egress) Time-series service partition level latency insight (forward, reverse, time to first byte (TTFB), time to last byte(TTLB))Latency Drilldown Latency analysis overview Time-series average end-to-end latency for a full request-response cycleADC ServiceDashboard(Global)Centralized ADCConfiguration Tool ADC service level KPI (key performance indicator) bar including global real-time ADC traffic statistics including throughput, currentconnections, connection rate and error traffic rate Service inventory information including service ports statistics and status, global deployed locations, events logs and alerts Global (tenant level) ADC traffic insight dashboard showing traffic patterns, characteristic, average end-to-end latency and top 10application services Shared Object enabling centralized policy and template management for ADC service templates, WAF rules, security policies, aFleX scripts,health monitor templates and else, which can be shared and used to multiple devices Service Objects providing intuitive ADC virtual server (VIP) configuration tool by associating service templates, security policies and otherobjects created in shared objects ADC configuration revision control with diff capability to compare with previous configuration versions Detailed ADC transaction logs providing client information (IP, location, device, etc.), ADC service information (e.g., VIP, service port,protocol) and transaction details including request and response details)Session LogDrilldown Response time distribution representing session latency (RTT) in various phases of request and response transaction Detailed transaction logs for WAF event providing violation details (types, category, WAF policy and action) Easy to use searching and filtering capability to support faster troubleshooting of ADC services Pinpoint possible issues/ bottlenecks in both network and application layer9
Figure 6. ADC Harmony App provides applicationanalytics and insights from multiple aspects,including client (sample), Internet, ADC services,Applications, App servers and more.Figure 7. Latency drilldown analytics providestime-series average end-to-end latency for afull request-response cycle. This greatly helpstroubleshoot application performance issuerelated to delayed response time.10
SSL Insight AppTraffic Insight TLS inspection status for total counts and time-series chart by connections and volume TLS cipher analytics for key exchange methods, TLS versions, based on client and server connections Time-series traffic distribution by protocol and segment based on connections and volume Time-series TLS connections per second and volume Top source IPs for TLS deceryption by connections and volumeApplication Insight Top applications based on connections and volume Top SaaS applications based on connections and volume Top risky applications based on connections and volume Application traffic distribution Top gaining applications and categories List of all the application protocols observedURL Insight Top URL categories based on connections and volume URL category insight by Productivity, Sensitive, IT Resource, and Privacy groups Suspicious URL categories by connection Time-series connection chart for the suspicious category groupAnalytics & Insights Time-series connection chart for top 5 URL categoriesSource &Destination Insight Source & destination IP analysis using Sankey diagram based on connections and volume Pareto analysis for source and destination IP based on connections and volume Top destination countries based on connections and volumeThreat Insight Time-series detected threats chart filtered by threat categories Threat categories distribution by connections and top IPs per each category Threat distribution country map view by volume and connectionThreat Investigator Threat intelligence research and investigation tool that allows to quickly look up and investigate a potential risk ofthe individual internet objects including IPs, URLs, files, and applications.Watch List Monitor TLS traffic based on URL and application categories Create custom lists of applications to monitor user traffic in time-series chart Create custom lists of URL categories to monitor user traffic in time-series chart SSL Insight service level KPI (key performance indicator) bar including device group health, real time SSLi traffic statistics, serviceavailability, error rate and elseDevice Management& ConfigurationTools Deployment Wizard provides intuitive guided configuration for various deployment options (single or dual appliance, with or without highavailability, L2 or L3) with recommended security policies Site group and site topology supports many prevailing deployment topologies. Adding new devices/ sites in the same site group is as easyas cloning an existing site Single device level configuration & management is supported for general system settings, interface and networking, add-on security licenses Policy manager to enable centralized SSL insight service and policy configuration for all devices in a device group Shared Object are an abstraction of the various SSLi configuration including ACLs, policy templates, SSL profiles, URL filtering, ICAP, AAM,G-suites and Office 365 and so onSession LogDrilldown Log view provides expanded view and search functions of access log, SSLi connection log, error log, and system log for troubleshootingTroubleshootingTools Active and guided verification test for system, resources, and end-to-end communication Searching session logs with uncategorized URLs Metric correlation for comparing different KPIs of the same device and comparing the same KPI from different devices11
Figure 8. SSL Insight App providescomprehensive analytics for application trafficover TLS, centralized policy control and intuitivewizard-based configuration tools.Figure 9. SSL Insight analytics visualizes thetraffic insights from the aspect of IPs, TLS trafficpattern, URL, application categories, devicesand more.12
CGNAT AppTraffic Analytics CGNAT service level KPI (key performance indicator) bar including real-time service traffic statistics and device health Top subscribers (IPv4/IPv6) and time-series concurrent session counts and session rate Subscriber side time-series total traffic (throughput and packet rate) measured on uplink and downlink CGNAT service analytics for port mapping (protocol), time-series sessions stats (user quota, full-cone sessions,EIM/EIF, hairpinning), NAT pools, misbehaviors /error traffic statistics CGN device/ cluster statistics, and internet (uplink) side of traffic statistics and insightsAnalytics & InsightsSubscriber PortUsage (for FixedNAT) Subscribers port usage correlation (TCP/UDP)Application Visibility Top applications chart (per rule-set) Subscribers traffic pattern insights in port range Active subscribers Application traffic distribution based on connections and volume Applications insights by categories / watchlistSYN Cookie Number of TCP SYN cookie for which the responding ACK passed the SYN cookie check versus the number of TCPSYN cookie for which the responding ACK failed the SYN cookie check Number of TCP SYN cookie sent, filtered by Passed/Failed/ACK SentIP Anomaly Normal packets vs. anomaly events insight Filter by downlink, uplink, layer 3 and layer 4 Distribution of anomaly types and layers Overall CGNAT service tenant view, including alerts and events, geographical deployment locations, CGNAT service KPI scorecardsDashboard CGN service type view provides a KPI snapshot bar and drilldown statistic for subscribers, current session counts and rate, throughput(bps), packet rate (pps), NAT pool use (TCP/ UDP), device status (usage of data and control CPU, memory) etc. Drop analysis helps to visualize where the packet drops happen in the processing chain so as to quickly identify issues and the root causesTroubleshooting Time series charts are overlaid by alerts and events in time axis so user can easily correlate the performance or errors and quickly identify issues Anomaly Detection feature, once configured, can detect spikes of any time series data and generate alertsSession LogDrilldown Detailed CGNAT transaction logs providing subscriber information (IP, MSISDN, IMEI, IMSI) , NAT session, port mapping, protocols, CGNpolicy and else Detailed error transaction logs providing subscriber information, NAT pool, protocol and reason/ error type Easy to use searching and filtering option for both session and error logsFigure 10. CGNAT App provides comprehensivevisibility and insights of the subscriber traffic ona per-CGNAT service basis.13
GTP Firewall AppTraffic Insight GTP FW service level KPI (key performance indicator) bar including real-time service traffic statistics and devicehealth Roaming geographical view based on GTP session counts for both roam-in and roam-out Time-series GTP traffic insight for GTPv0-C, GTPv1-C, GTPv2-C and GTP-U (uplink/ downlink) Time-series GTP traffic distribution and comparison chart at- Signaling Gateway (SGW) and Signaling Gateway Secure Network (SGSN)- Packet Data Network Gateway (PGW) and Gateway GPRS Support Node (GGSN)- Access Point Name (APN) Time-series CFW cluster traffic statistics for GTP sessionsAnalytics & InsightsPolicy Violations Time-series of GTP firewall policy actions statistics and policy violation insight based on violation categories Time-series GTP firewall policy violation analytics using violation type distribution and comparison at- Signaling Gateway (SGW) and Signaling Gateway Secure Network (SGSN)- Packet Data Network Gateway (PGW) and Gateway GPRS Support Node (GGSN)- Access Point Name (APN) Firewall rule performance analysis and stale rules indicatorRoam In GTP roam-in session stats by their origin countries in the world map view List of roaming origin countries based on log counts, MMC and MNCRoam Out GTP roam-out session stats by their destination countries in the world map view List of roaming destination countries based on log counts, MMC and MNCSession LogDrilldown Detailed GTP firewall session logs providing source/origin, destination, message type, session details (protocol, user location info (LUI), QoSetc.), log reason and firewall rule /action information Easy to use searching and filtering option using GTP protocol types, IP, TEID and elseFigure 11. GTP Firewall App provides holistic view andanalytics for roaming traffic using time-series GTPtraffic insights, GTP FW service level KPI, roam (in/out)session statistics, detailed session log and more.14
Gi/SGi Firewall AppAnalytics & InsightsSession LogDrilldownIP Traffic CGN and GiFW service level KPI (key performance indicator) bar including real-time traffic stats, firewall rule stats,and device health Total session counts and rate Total time-series traffic statistics (throughput and packet rate) Traffic analytics with top-K IPs based on throughput, session, protocols for source and destination (IPv4/IPv6)Firewall Time-series traffic insight based on firewall rule actionTraffic pattern statistics based on rules matched and dropped trafficTraffic distribution of firewall rules for each actionFirewall rule performance scorecard and stale rule indicatorTop subscribers based on volume, packets and sessions (IPv4/IPv6)CGN Protocol based port mapping insightsTime-series port mapping statisticsTime-series port error and quota exceeded statisticsTime-series NAT pool utilization (port-based, NAT IP-based, subscriber per NAT IP)Application Visibility Top applications chart (per rule-set) Application traffic distribution based on connections and volume Applications insights by categories/watchlistCluster CFW devices/cluster system utilization (CPU, Memory) and bandwidth Deployment locations in world map Cluster traffic insight based on throughput and active sessions Detailed CGNAT transaction logs providing subscriber information, NAT session, port mapping, CGN policy and else Detailed firewall / transparent session logs providing subscriber information, firewall rule and action, zone, in/out interface and session status Easy to use searching and filtering option for both NAT and firewall session logsFigure 12. Gi/SGi Firewall App provides detailedanalytics of the user traffic with time-seriestraffic insights, firewall rule permanence, CGNand GiFW service level KPI and many more.Learn MoreAbout A10 NetworksContact Usa10networks.com/contactHa r mo ny C o ntro lle r Fre e Tr i a la10networks.com/products/harmony-trial 2021 A10 Networks, Inc. All rights reserved. A10 Networks, the A10 Networks logo, ACOS, A10 Thunder, ThunderTPS, A10 Lightning, A10 Harmony, and SSL Insight are trademarks or registered trademarks of A10 Networks, Inc. inthe United States and other countries. All other trademarks are property of their respective owners. A10 Networksassumes no responsibility for any inaccuracies in this document. A10 Networks reserves the right to change, modify,transfer, or otherwise revise this publication without notice. For the full list of trademarks, visit: www.a10networks.com/company/legal/trademarks/.Part Number: A10-DS-15122-EN-13SEP 202115
The self-managed controller can be installed on any physical or virtual machine instance running CentOS . A10 Thunder Convergent Firewall features a data center firewall, site-to-site IPsec VPN, Gi/SGi firewall, GTP firewall . Health Monitoring of Devices Harmony Controller monitors health of connected devices and provides intuitive .