Transcription
Downloaded from orbit.dtu.dk on: Jun 29, 2022Accelerating Ice Loss From Peripheral Glaciers in North GreenlandKhan, Shfaqat A.; Colgan, William; Neumann, Thomas A.; van den Broeke, Michiel R.; Brunt, Kelly M.;Noël, Brice; Bamber, Jonathan L.; Hassan, Javed; Bjørk, Anders A.Published in:Geophysical Research LettersLink to article, DOI:10.1029/2022GL098915Publication date:2022Document VersionPublisher's PDF, also known as Version of recordLink back to DTU OrbitCitation (APA):Khan, S. A., Colgan, W., Neumann, T. A., van den Broeke, M. R., Brunt, K. M., Noël, B., Bamber, J. L., Hassan,J., & Bjørk, A. A. (2022). Accelerating Ice Loss From Peripheral Glaciers in North Greenland. GeophysicalResearch Letters, 49(12), [e2022GL098915]. https://doi.org/10.1029/2022GL098915General rightsCopyright and moral rights for the publications made accessible in the public portal are retained by the authors and/or other copyrightowners and it is a condition of accessing publications that users recognise and abide by the legal requirements associated with these rights. Users may download and print one copy of any publication from the public portal for the purpose of private study or research. You may not further distribute the material or use it for any profit-making activity or commercial gain You may freely distribute the URL identifying the publication in the public portalIf you believe that this document breaches copyright please contact us providing details, and we will remove access to the work immediatelyand investigate your claim.
RESEARCH LETTER10.1029/2022GL098915Key Points: G reenland peripheral glacier mass lossincreased from 27.2 Gt/yr (February2003–October 2009) to 42.3 Gt/yr(October 2018–December 2021 Mass loss increased by a factor offour for peripheral glaciers in NorthGreenland during February 2003–December 2021 Enhanced precipitation in northeastGreenland during October 2018–December 2021 resulted in icethickening at higher elevationsSupporting Information:Supporting Information may be found inthe online version of this article.Correspondence to:S. A. Khan,abbas@space.dtu.dkCitation:Khan, S. A., Colgan, W., Neumann, T.A., van den Broeke, M. R., Brunt, K.M., Noël, B., et al. (2022). Acceleratingice loss from peripheral glaciers inNorth Greenland. Geophysical ResearchLetters, 49, e2022GL098915. https://doi.org/10.1029/2022GL098915Received 29 MAR 2022Accepted 25 MAY 2022Author Contributions:Conceptualization: Shfaqat A. KhanFormal analysis: Shfaqat A. KhanMethodology: Shfaqat A. Khan, WilliamColganProject Administration: Shfaqat A.KhanSoftware: Shfaqat A. KhanValidation: Shfaqat A. KhanWriting – original draft: Shfaqat A.KhanWriting – review & editing: WilliamColgan, Thomas A. Neumann, Michiel R.van den Broeke, Kelly M. Brunt, BriceNoël, Jonathan L. Bamber, Javed Hassan 2022. The Authors.This is an open access article underthe terms of the Creative CommonsAttribution License, which permits use,distribution and reproduction in anymedium, provided the original work isproperly cited.KHAN ET AL.Accelerating Ice Loss From Peripheral Glaciers in NorthGreenlandShfaqat A. Khan1 , William Colgan2 , Thomas A. Neumann3, Michiel R. van den Broeke4 ,Kelly M. Brunt3,5 , Brice Noël4 , Jonathan L. Bamber6,7 , Javed Hassan1, and Anders A. Bjørk81DTU Space, Technical University of Denmark, Kongens Lyngby, Denmark, 2Department of Glaciology and Climate,Geological Survey of Denmark and Greenland, Copenhagen, Denmark, 3NASA Goddard Space Flight Center, Greenbelt,MD, USA, 4Institute for Marine and Atmospheric Research Utrecht, Utrecht University, Utrecht, The Netherlands, 5EarthSystem ScienceInterdisciplinary Center, University of Maryland, College Park, MD, USA, 6Bristol Glaciology Centre,University of Bristol, Bristol, UK, 7Department of Aerospace and Geodesy, Data Science in Earth Observation, TechnicalUniversity of Munich, Munich, Germany, 8Department of Geosciences and Natural Resources, University of Copenhagen,Copenhagen, DenmarkAbstract In recent decades, Greenland's peripheral glaciers have experienced large-scale mass loss,resulting in a substantial contribution to sea level rise. While their total area of Greenland ice cover is relativelysmall (4%), their mass loss is disproportionally large compared to the Greenland ice sheet. Satellite altimetryfrom Ice, Cloud, and land Elevation Satellite (ICESat) and ICESat-2 shows that mass loss from Greenland'speripheral glaciers increased from 27.2 6.2 Gt/yr (February 2003–October 2009) to 42.3 6.2 Gt/yr (October2018–December 2021). These relatively small glaciers now constitute 11 2% of Greenland's ice loss andcontribute to global sea level rise. In the period October 2018–December 2021, mass loss increased by a factorof four for peripheral glaciers in North Greenland. While peripheral glacier mass loss is widespread, we alsoobserve a complex regional pattern where increases in precipitation at high altitudes have partially counteractedincreases in melt at low altitude.Plain Language Summary The Arctic is warming more rapidly than the rest of the world. Thiswarming has had an especially profound impact on Greenland's ice cover. Only 4% of Greenland's ice coverare small peripheral glaciers that are distinct from the ice sheet proper. Despite comprising this relatively smallarea, these small peripheral glaciers are responsible for 11% of the ice loss associated with Greenland's recentsea level rise contribution. Using the satellite laser platforms Ice, Cloud, and land Elevation Satellite (ICESat)and ICESat-2, we estimate that ice loss from these Greenland glaciers increased from 27 6 Gt/yr (2003–2009)to 42 6 Gt/yr (2018–2021). We find that the largest acceleration in ice loss is in North Greenland, where weobserve ice loss to increase by a factor of four between 2003 and 2021. In some areas, it appears that recentincreases in snowfall at high altitudes have partially counteracted recent increases in melt at low altitudes.While many recent Greenland ice loss assessments have focused on only the ice sheet, the recent sharp increasein ice loss from small peripheral glaciers highlights the importance of accurately monitoring Greenland's smallperipheral glaciers. These small peripheral glaciers appear poised to play an outsized role in Greenland ice lossfor decades to come.1. IntroductionGreenland's peripheral glaciers are an important, but often not separately considered, element of the global sealevel rise budget. Ice loss estimates from satellite gravimetry, which cannot separate the peripheral glaciers fromthe contiguous ice sheet, are often blended with altimetry and mass-budget ice loss estimates that only samplethe contiguous ice sheet. Satellite gravimetry-based community assessments of Greenland's recent sea level risecontribution note that they effectively employ “Greenland ice loss” as being synonymous with “Greenland icesheet ice loss” (IMBIE Team, 2020; Shepherd et al., 2012).While peripheral glaciers comprise 4% of Greenland's ice-covered area, their specific ice loss is disproportionately high in comparison to that of the ice sheet (11 2%, as we describe here). The most recent laser altimetryestimates of Greenland peripheral glacier ice loss pertain to the 2003–2009 Ice, Cloud, and land Elevation Satellite (ICESat) observational period. These estimates range between 28 12 and 44 18 Gt/yr of ice loss, depending on which glaciers are classified as “peripheral” (Bolch et al., 2013; Gardner et al., 2013). This is comparable1 of 8
Geophysical Research Letters10.1029/2022GL098915to the ice loss from Ellesmere Island, adjacent to northeast Greenland (Sasgen et al., 2022; Wouters et al., 2019).Peripheral glaciers were responsible for 10% of the Greenland ice loss observed during this period (Colganet al., 2013; Gardner et al., 2013).Regional climate modeling suggests that increasing air temperatures and meltwater percolation have contributedto a recent, and sharp, decrease in firn pore volume across Greenland's peripheral glaciers (Noël et al., 2017).The ability of peripheral glaciers to buffer their response to climate change, by retaining meltwater via refreezingin porous firn, is expected to decrease with this decline in firn pore volume, promoting acceleration of mass loss(van Angelen et al., 2013). Here, we provide the first laser altimetry assessment of changing ice loss rates fromGreenland peripheral glaciers that bridges both the ICESat and ICESat-2 periods of February 2003–December2021.2. Data and Methods2.1. Elevation Changes During February 2003–October 2009 From ICESatWe use ICESat data from February 2003 to October 2009 (Schenk & Csatho, 2012; Smith et al., 2020; Zwallyet al., 2014) to estimate elevation changes over the ice surface. We estimate height changes over the ice surface ona regular grid with a resolution of 500 500 m that covers all of Greenland's peripheral glaciers. We use all available ICESat data to create height time series at each grid point. At each grid point, we fit a trend, a second-ordersurface topography, and a seasonal term to account for the annual surface changes (Khan et al., 2022; Schenk &Csatho, 2012; Sørensen et al., 2011) (see Supporting Information S1 for details).The observed height change rates from ICESat are spatially interpolated into a regular grid of 500 500 m. Theinterpolation is performed using the ordinary kriging method (Hurkmans et al., 2014; Nielsen et al., 2013). Weuse the observed elevation change rates to estimate an empirical semivariogram. Next, we fit an exponentialmodel variogram (with a range of 60 km) to the empirical semivariogram to take the spatial correlation of elevation change rates into account in the error budget. For each grid point, we estimate elevation change rate dhi,krig,and associated uncertainty error.We correct the observed height change rates for firn compaction, elastic uplift rates from present-day masschanges, and long-term past ice changes (Glacial Isostatic Adjustment—GIA). We correct for GIA using theGNET-GIA empirical model of Khan et al. (2016). For each grid point, we estimate the GIA uplift rate dhGIAand the associated uncertainty sGIA. To correct for elastic uplift of the bedrock, we convolve ice loss estimates ofperipheral glaciers and the Greenland ice sheet with Green's functions derived by Wang et al. (2012) for elasticEarth model iasp91 (Wang et al., 2012) with a refined crustal structure from Crust 2.0 (Laske et al., 2012).2.2. Elevation Changes During October 2018–December 2021 From ICESat-2We estimated elevation changes for Greenland's peripheral glaciers using ICESat-2 data from October 2018 toDecember 2021. We use ICESat-2 Algorithm Theoretical Basis Document for Land Ice Height (ATL06) Release004 retrieved from https://nsidc.org/data/atl06 (Smith et al., 2021). We estimate elevation changes using the samemethod as described for ICESat data in the previous section. We also apply the same corrections for elastic uplift,GIA, and firn compaction.2.3. Elevation Changes During October 2008–April 2019We fill the gap between ICESat and ICESat-2 satellite missions by merging elevations from both missions.We estimate elevation changes for Greenland's peripheral glaciers by performing a crossover analysis betweenICESat and ICESat-2 data. We use all available ICESat data points from October 2008 to October 2009 andICESat-2 data points from October 2018 to April 2019. Our elevation changes of dh point measurements spanbetween 9.0 and 10.5 years. We estimate elevation change rates based on dh differences and apply corrections forelastic uplift, GIA, and firn compaction (see Supporting Information S1).KHAN ET AL.2 of 8
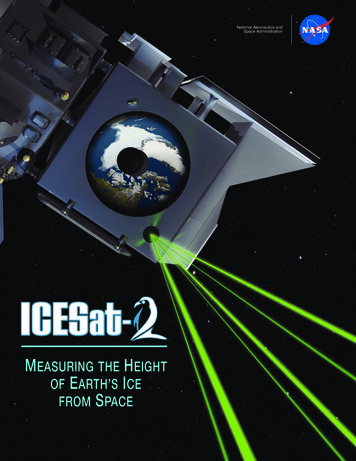
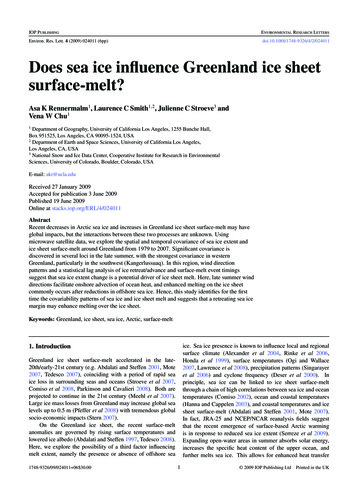
Geophysical Research Letters10.1029/2022GL098915Figure 1. (a) Map of ice-covered areas in Greenland. Greenland ice sheet (white). Peripheral glaciers in the north (black dots), northeast (green dots), southeast (reddots), southwest (blue dots), and northwest (purple dots). Mean surface air temperature in C during May–September in (b) the north, (c) northwest, (d) southeast, (e)southwest, and (f) northwest Greenland from RACMO2.3p2. The straight line in panel (b–f) denotes 1990–2021 trend with the rate listed above the line. Area size inkm 2 for each peripheral glacier region and the Greenland ice sheet are listed in Table 1.3. Results3.1. Elevation Changes and Ice LossFigure 2 shows elevation change rates during February 2003–October 2009, October 2008–April 2019, andOctober 2018–December 2021.KHAN ET AL.3 of 8
Geophysical Research Letters10.1029/2022GL098915Figure 2. Elevation change rates, in m/yr, during (a) February 2003–October 2009, (b) October 2008–April 2019, and (c) October 2018–December 2021.Table 1 shows mass change for each of the five peripheral glacier regions considered in this study, along with thecontemporaneous mass change of the Greenland ice sheet. The Greenland ice sheet mass change during February2003–October 2009 was retrieved from Khan et al. (2016), and the mass change during October 2008–April 2019was retrieved from Khan et al. (2022). For the period from October 2018 to December 2021, we used ICESat-2data.3.2. Complex Regional Ice Loss PatternsWe find large differences in the ice loss trends across the five peripheral glacier regions that we survey. Threeregions—southeast, southwest, and northwest—each lost between 1.6 and 6.9 Gt/yr of ice mass. Though theyshow large temporal variability, their total contribution to ice loss is relatively small. Conversely, the north andnortheast regions show striking features of a large and persistent thinning pattern.Table 1Peripheral Glacier (This Study) and Ice Sheet (Khan et al., 2016, 2022) Mass Change (Including Correction for Firn, Elastic, and GIA)RegionArea [km 2]Mass change [Gt/yr]Mass change [Gt/yr]Mass change [Gt/yr]February 2003–October 2009October 2008–April 2019October 2018–December 2021North35,003 6.7 1.6 11.7 1.4 26.1 1.4Northeast21,943 11.8 2.2 9.4 2.7 6.4 2.3Southeast2,610 2.3 0.6 1.6 1.0 2.6 0.8Southwest7,011 2.9 0.9 4.9 0.9 3.0 0.9Northwest5,807 3.5 0.9 6.9 0.9 4.2 0.8All peripheral glaciers72,374 27.2 6.2 34.5 6.9 42.3 6.2Greenland ice sheet1,732,859 218.1 20.1 258.6 15.6 262.3 39.0All Greenland1,805,233 245.3 26.3 293.1 22.4 304.6 45.2Note. Bold text indicate total Area or Mass Change.KHAN ET AL.4 of 8
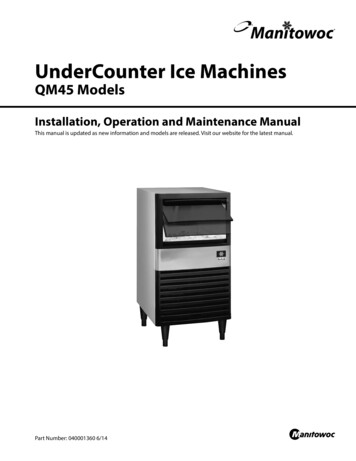
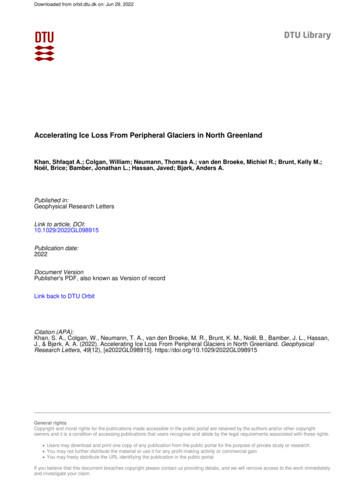
Geophysical Research Letters10.1029/2022GL098915Figure 3. Top row: Detailed elevation change rates of Figure 2 during (a) February 2003–October 2009, (b) October 2008–April 2019, and (c) October 2018–December 2021 for peripheral glaciers in the North. Bottom row: Detailed elevation change rates for peripheral glaciers in the northeast during (d) February 2003–October 2009, (e) October 2008–April 2019, and (f) October 2018–December 2021.In North Greenland, we observe an increase in the thinning rate during February 2003–December 2021(Figures 3a–3c), resulting in an increased mass loss rate from 6.7 1.6 Gt/yr during February 2003–October2009 to 11.7 1.4 Gt/yr during October 2008–April 2019 and finally 26.1 1.4 during October 2018–December2021. Figures 3a–3c suggests that thinning is spreading to higher elevations over this time. While the highestelevations slightly thickened during February 2003–October 2009, these areas transitioned into slight thinningduring October 2008–April 2019 followed by more extensive thinning during October 2018–December 2021.In northeast Greenland, by contrast, thickening at higher elevations has become more extensive, while loweraltitudes have continued to thin (Figures 3d–3f). As a result, the total mass loss rate of the northeastern sectordeclined from 11.8 2.2 Gt/yr (February 2003–October 2009) to 9.4 2.7 Gt/yr (October 2008–April 2019)and finally 6.4 2.3 (October 2018–December 2021) (see Table 1). We note that the peripheral glacier plateausin the North sector have a maximum altitude of about 1,000–1,200 m, while the glacier plateaus in the northeastsector have a maximum altitude of about 2,000–3,000 m. Plateau geometry likely plays a key role in sustaininga viable accumulation area.4. Discussion4.1. Disproportional Sea Level Rise ContributionPrevious laser altimetry assessments of peripheral glacier ice loss have excluded the ice sheet and did not useICESat-2 data to assess the most recent changes (Bolch et al., 2013; Gardner et al., 2013; Noël et al., 2017). Bycombining our peripheral glacier assessment with an ice sheet assessment using an analogous altimetry approachKHAN ET AL.5 of 8
Geophysical Research Letters10.1029/2022GL098915and ice mask (Khan et al., 2016, 2022), we present the first consistent, geodetic estimate of ice loss from all ofGreenland's land ice derived from laser altimetry. By unambiguously identifying all of Greenland's land ice aseither peripheral glacier or ice sheet (Pedersen et al., 2013), we resolve previous ambiguity associated with pairing independent peripheral glacier and ice sheet assessments (Bamber et al., 2018). The peripheral glacier areaof the Pedersen et al. (2013) ice mask that we use (72,374 km 2) is 18% smaller than the 88,083 km 2 of Citterioand Ahlstrøm (2013) ice mask and 20% smaller than the 89,720 km 2 ice mask of Rastner et al. (2012). Ourassessment therefore represents a lower bound of peripheral glacier mass loss.We assess the peripheral glacier contribution to Greenland ice loss as 11 2% during both the February 2003–October 2009 and October 2008–April 2019 periods. During the October 2018–December 2021 period, however,the peripheral glacier contribution to Greenland ice loss increased sharply to 14 2%. This recent increase inthe peripheral glacier contribution to Greenland ice loss is associated with a sharp increase in ice loss fromNorth Greenland glaciers (discussed below). Given that Greenland's peripheral glaciers comprise 4% of landice by area (Pedersen et al., 2013) but are responsible for 14 2% of current Greenland ice loss, their sea levelcontribution is clearly disproportionately large. This is consistent with the expectation that smaller local glacierswith hypsometry peaking at lower elevations respond more rapidly to climate changes than a larger ice sheet withan extensive and highly elevated interior (Bahr et al., 1998; Noël et al., 2017, 2020).4.2. Accelerated Ice Loss in North GreenlandPeripheral glacier mass loss in North Greenland has effectively quadrupled over the observational period, from6.7 1.6 Gt/yr during the February 2003–October 2009 ICESat period to 26.1 1.4 Gt/yr during the October2018–December 2021 ICESat-2 period. The large mass loss rate during the ICESat-2 period is strongly influenced by the major melt event in 2019 (Sasgen et al., 2020), followed by relative warm summers in 2020 and2021 (see Figure 1c). North Greenland is now responsible for 60% of all Greenland peripheral glacier massloss—more than all other regions combined.Figures 1b–1f shows regional mean surface air temperatures in C during May–September (MJJAS) fromthe regional climate model RACMO2.3p2 (Noël et al., 2018). The mean air temperatures are estimates overperipheral glacier areas highlighted in Figure 1a. Since c. 1990, north, northeast, and northwest Greenland havebeen experiencing a greater rate of warming than South Greenland (Figures 1b–1f). We estimate an average airtemperature trend of 0.048 0.020 C/yr for North Greenland and 0.028 0.019 C/yr for southeast Greenland(see Figure 1). This is attributable to large-scale and persistent changes in atmospheric circulation, which haveresulted in the North Greenland ice sheet ablation area expanding about twice as fast as the South Greenlandablation area (Noël et al., 2019).The North Greenland peripheral glacier mass loss during the October 2018–December 2021 period is clearlyinfluenced by the extreme 2019 melt season. This extreme summer melt appears to have been caused by twocompounding factors: relatively low winter snowfall, which preconditioned ice for an earlier and longer meltseason, and relatively stable summer high-pressure systems, with enhanced melting through increased northwardadvection of midlatitude air masses (Hanna et al., 2016; Sasgen et al., 2020). As climate change is expected toboth lengthen the melt season and enhance midlatitude atmospheric inflow to the Arctic (Cai et al., 2018; Overland et al., 2019; Sasgen et al., 2022), the extreme glacier loss that we observe in North Greenland in 2019 maybe considered symptomatic of a future warmer Arctic.5. ConclusionsWe present the first comprehensive laser altimetry-based assessment of ice loss from all of Greenland's land ice,including both peripheral glaciers and the Greenland ice sheet, spanning the period February 2003–December2021. While peripheral glaciers comprise only a small portion of Greenland's land ice area, mass loss is increasing faster in relation to the ice sheet. In North Greenland especially, peripheral glacier mass loss has increasedfourfold over the satellite observation period. In recent years, this area of glaciers has contributed to approximately 10% (Table 1, bold entries) of the total Greenland ice loss.KHAN ET AL.6 of 8
Geophysical Research Letters10.1029/2022GL098915Greenland's peripheral glaciers contain an estimated total ice volume of 4.7 0.7 cm of sea level equivalent(Huss & Farinotti, 2012). This is comparable to the 4.6 1.5 cm of sea level equivalent for Alaska and WesternCanada combined (Millan et al., 2022). Numerical projections suggest that Greenland's peripheral glaciers willnot reach peak specific mass loss within the 21st century. Greenland's peripheral glaciers are therefore poisedto remain a major player in Greenland's ice loss budget for decades to come. This provides strong motivation toensure explicit representation of peripheral glacier mass loss in community assessments of Greenland ice loss(IMBIE Team, 2020).The trends and variability in Greenland's peripheral glacier mass loss that we document are clearly complex inboth space and time. Better scientific understanding of the presatellite era mass balance of Greenland's peripheralglacier population would place contemporary mass loss rates into a better temporal context. At present, geodeticestimates of Greenland's peripheral glacier mass balance are a missing component of the 20th century global sealevel budget.Data Availability StatementThe Ice, Cloud, and land Elevation Satellite (ICESat) data are available at: https://nsidc.org/data/icesat/data.html.The Ice, Cloud, and land Elevation Satellite-2 (ICESat-2) data are available at: https://nsidc.org/data/icesat-2.Surface elevation change rates, firn compaction rates, elastic uplift rates from present-day mass changes, GIAvertical Land Motion, and air temperature time series are available at the following data repository: jtKQMStLrp9TFFASELjUPxAn3Hw.AcknowledgmentsS. A. Khan acknowledges supportfrom the Independent Research FundDenmark—Natural Sciences Grant Nos.1026-00085B and Villum Fonden (VillumExperiment Programme) Project No.40718. W. Colgan acknowledges supportfrom the Independent Research FundDenmark Grant No. 8049-00003. B. B.Noël was funded by the NWO VENIgrant VI.Veni.192.019. M. R. van denBroeke acknowledges support from theNetherlands Earth System Science Centre.T. A. Neumann and K. M. Brunt acknowledge support from the ICESat-2 ProjectScience Office, J. L. Bamber receivedfunding by the European ResearchCouncil (GlobalMass; Grant No. 694188)and the German Federal Ministry ofEducation and Research (BMBF) in theframework of the international future labAI4EO (Grant No. 01DD20001). Finally,we thank two anonymous reviewers forinsightful and constructive comments.KHAN ET AL.ReferencesBahr, D. B., Pfeffer, W. T., Sassolas, C., & Meier, M. F. (1998). Response times of glaciers as a function of size and mass balance: 1. Theory.Journal of Geophysical Research, 103(B5), 9777–9782. https://doi.org/10.1029/98JB00507Bamber, J. L., Westaway, R. M., Marzeion, B., & Wouters, B. (2018). The land ice contribution to sea level during the satellite era. EnvironmentalResearch Letters, 13(6), 063008. https://doi.org/10.1088/1748-9326/aac2f0Bolch, T., Sandberg Sørensen, L., Simonsen, S. B., Mölg, N., Machguth, H., Rastner, P., & Paul, F. (2013). Mass loss of Greenland's glaciers andice caps 2003–2008 revealed from ICESat data. Geophysical Research Letters, 40, 875–881. https://doi.org/10.1002/grl.50270Cai, L. A., Vladimir, A., Walsh, J. E., & Bhatt, U. S. (2018). Patterns, impacts, and future projections of summer variability in the Arctic fromCMIP5 models. Journal of Climate, 31(24), 9815–9833. https://doi.org/10.1175/JCLI-D-18-0119.1Citterio, M., & Ahlstrøm, A. P. (2013). Brief communication “The aerophotogrammetric map of Greenland ice masses”. The Cryosphere, 7(2),445–449. https://doi.org/10.5194/tc-7-445-2013Colgan, W., Luthcke, S., Abdalati, W., & Citterio, M. (2013). Constraining GRACE-derived cryosphere-attributed signal to irregularly shapedice-covered areas. The Cryosphere, 7(6), 1901–1914. https://doi.org/10.5194/tc-7-1901-2013Gardner, A., Moholdt, G., Cogley, J. G., Wouters, B., Arendt, A. A., Wahr, J., et al. (2013). A reconciled estimate of glacier contributions to sealevel rise: 2003 to 2009. Science, 340(6134), 852–857. https://doi.org/10.1126/science.1234532Hanna, E., Cropper, T. E., Hall, R. J., & Cappelen, J. (2016). Greenland blocking index 1851–2015: A regional climate change signal. International Journal of Climatology, 36, 4847–4861. https://doi.org/10.1002/joc.4673Hurkmans, R. T. W. L., Bamber, J. L., Davis, C. H., Joughin, I. R., Khvorostovsky, K. S., Smith, B. S., & Schoen, N. (2014). Time-evolving massloss of the Greenland Ice Sheet from satellite altimetry. The Cryosphere, 8, 1725–1740. https://doi.org/10.5194/tc-8-1725-2014Huss, M., & Farinotti, D. (2012). Distributed ice thickness and volume of all glaciers around the globe. Journal of Geophysical Research, 117,F04010. https://doi.org/10.1029/2012JF002523IMBIE Team. (2020). Mass balance of the Greenland ice sheet from 1992 to 2018. Nature, 579, 233–239. https://doi.org/10.1038/s41586-019-1855-2Khan, S. A., Bamber, J. L., Rignot, E., Helm, V., Aschwanden, A., Holland, D. M., et al. (2022). Greenland mass trends from airborne and satellitealtimetry during 2011-2020. Journal of Geophysical Research: Earth Surface, 127(4), e2021JF006505. https://doi.org/10.1029/2021JF006505Khan, S. A., Sasgen, I., Bevis, M., vanDam, T., Bamber, J. L., Wahr, J., et al. (2016). Geodetic measurements reveal similarities between postLast Glacial Maximum and present-day mass loss from the Greenland ice sheet. Science Advances, 2, e1600931. https://doi.org/10.1126/sciadv.1600931Laske, G., Masters, G., & Reif, C. (2012). CRUST 2.0: A new global crustal model at 2x2 degrees. Retrieved from https://igppweb.ucsd.edu/ gabi/rem.htmlMillan, R., Mouginot, J., Rabatel, A., & Morlighem, M. (2022). Ice velocity and thickness of the world's glaciers. Nature Geoscience, 15,124–129. https://doi.org/10.1038/s41561-021-00885-zNielsen, K., Khan, S. A., Spada, G., Wahr, J., Bevis, M., Liu, L., & Dam, T. (2013). Vertical and horizontal surface displacements near JakobshavnIsbræ driven by melt-induced and dynamic ice loss. Journal of Geophysical Research: Solid Earth, 118, 1837–1844. https://doi.org/10.1002/jgrb.50145Noël, B., Jakobs, C. L., vanPelt, W. J. J., Lhermitte, S., Wouters, B., Kohler, J., et al. (2020). Low elevation of Svalbard glaciers drives high massloss variability. Nature Communications, 11, 4597. https://doi.org/10.1038/s41467-020-18356-1Noël, B., Jan van de Berg, W., Lhermitte, S., & vanden Broeke, M. R. (2019). Rapid ablation zone expansion amplifies north Greenland massloss. Science Advances, 5(9), eaaw0123. https://doi.org/10.1126/sciadv.aaw0123Noël, B., vande Berg, W., Lhermitte, S., Wouters, B., Machguth, H., Howat, I., et al. (2017). A tipping point in refreezing accelerates mass lossof Greenland's glaciers and ice caps. Nature Communications, 8, 14730. https://doi.org/10.1038/ncomms147307 of 8
Geophysical Research Letters10.1029/2022GL098915Noël, B., vande Berg, W. J., van Wessem, J. M., van Meijgaard, E., van As, D., Lenaerts, J. T. M., et al. (2018). Modelling the climate and surfacemass balance of polar ice sheets using RACMO2, Part 1: Greenland (1958–2016). The Cryosphere, 12, 811–831. https://doi.org/10.5194/tc-12-811-2018Overland, J., Dunlea, E., Box, J. E., Corell, R., Forsius, M., Kattsov, V., et al. (2019). The urgency of Arctic change. Polar Science, 21, Pedersen, M., Weng, W. L., Keulen, N., & Kokfelt, T. (2013). A new seamless digital 1:500, 000 scale geological map of Greenland. Geol. Surv.Den. Greenl., 28, 65–68. https://doi.org/10.34194/geusb.v28.4727Rastner, P., Bolch, T., Mölg, N., Machguth, H., Le Bris, R., & Paul, F. (2012). The first complete inventory of the local glaciers and ice caps onGreenland. The Cryosphere, 6, 1483–1495. https://doi.org/10.5194/tc-6-1483-2012Sasgen, I., Salles, A., Wegmann, M., Wouters, B., Fettweis, X., Noel, B. P. Y., & Beck, C. (2022). Arctic glaciers record wavier circumpolarwinds. Nature Climate Change, 12, 249–255. https://doi.org/10.1038/s41558-021-01275-4Sasgen, I., Wouters, B., Gardner, A. S., King, M. D., Tedesco, M., Landerer, F. W., et al. (2020). Return to rapid ice loss in Greenland and recordloss in 2019 detected by the GRACE-FO satellites. Communications Earth & Environment, 1, 8. https://doi.org/10.1038/s43247-020-0010-1Schenk, T., & Csatho, B. (2012). A new methodology for detecting ice sheet surface elevation changes from laser altimetry data. IEEE Transactions on Geoscience and Remote Sensing, 50(9), 3302–3316. https://doi.org/10.1109/TGRS.2011.2182357Shepherd, A., Ivins, E., Barletta, V. R., Bentley, M. J., Bettadpur, S., Briggs, K. H., et al. (2012). A reconciled estimate of ice-sheet mass balance.Science,
Regional climate modeling suggests that increasing air temperatures and meltwater percolation have contributed to a recent, and sharp, decrease in firn pore volume across Greenland's peripheral glaciers (Noël et al., 2017). The ability of peripheral glaciers to buffer their response to climate change, by retaining meltwater via refreezing