Transcription
Online ISSN 2092-9293Print ISSN 1976-9571Genes & RESEARCH ARTICLEGenomic and transcriptomic analysis of Korean colorectal cancerpatientsSol A Jeon1,2,5 · Ye Jin Ha3 · Jong‑Hwan Kim1,2 · Jeong‑Hwan Kim1 · Seon‑Kyu Kim1,5 · Yong Sung Kim1,2,5 ·Seon‑Young Kim1,2,5 · Jin Cheon Kim3,4Received: 4 March 2022 / Accepted: 1 June 2022 The Author(s) 2022AbstractBackground Colorectal cancer (CRC) is the third most common type of diagnosed cancer in the world and has the secondhighest mortality rate. Meanwhile, South Korea has the second-highest incidence rate for CRC in the world.Objective To assess the possible influence of ethnicity on the molecular profile of colorectal cancer, we compared genomicand transcriptomic features of South Korean CRCs with European CRCs.Methods We assembled a genomic and transcriptomic dataset of South Korean CRC patients (KOCRC; n 126) from previous studies and European cases (EUCRC; n 245) selected from The Cancer Genome Atlas (TCGA). Then, we comparedthe two datasets in terms of clinical data, driver genes, mutational signature, gene sets, consensus molecular subtype, andfusion genes.Results These two cohorts showed similar profiles in driver mutations but differences in the mutation frequencies of somedriver genes (including APC, TP53, PABPC1, FAT4, MUC7, HSPG2, GNAS, DENND5B, and BRAF). Analysis of hallmarkpathways using genomic data sets revealed further differences between these populations in the WNT, TP53, and NOTCHsignaling pathways. In consensus molecular subtype (CMS) analyses of the study cases, no BRAF mutations were found inthe CMS1 subtype of KOCRC, which contrasts with previous findings. Fusion gene analysis identified oncogenic fusion ofPTPRK-RSPO3 in a subset of KOCRC patients without APC mutations.Conclusions This study presents insights into the genomic landscape of KOCRCs and reveals some similarities and differences with EUCRCs at the molecular level.Keywords Colorectal cancer · South Korea · European · Genomic landscape · EthnicityThese two authors contributed equally to this work: Sol A. Jeon andYe Jin Ha.* Seon‑Young Kimkimsy@kribb.re.kr* Jin Cheon Kimjckim@amc.seoul.kr1Personalized Genomic Medicine Research Center, Daejeon,South Korea2Korea Bioinformation Center, Korea Research Instituteof Bioscience and Biotechnology (KRIBB), Daejeon,South Korea3Asan Institute for Life Sciences, Asan Medical Center,Seoul 05505, South Korea4Department of Surgery, Asan Medical Center, Universityof Ulsan College of Medicine, Seoul 05505, South Korea5Department of Functional Genomics, University of Scienceand Technology (UST), Daejeon, South KoreaIntroductionColorectal cancer (CRC) is the third most commonly diagnosed cancer in the world and has the second-highest mortality rate, accounting for about 1 out of 10 cancer mortalities worldwide. Moreover, the global burden of CRC isexpected to increase by 60% to more than 2.2 million newcases and 1.1 million deaths by 2030 (Arnold et al. 2017).Notably, in this regard, South Korea has a CRC rate of 44.5(age-standardized rate per 100,000), which was the secondhighest global rate in 2018 (Bray et al. 2018).Over the past three decades, molecular genetic studieshave provided important genomic insights into the pathogenesis of both sporadic and hereditary CRC (Fearon 2011).Alterations in oncogenes and tumor suppressor genes areclosely related to CRC subsets, and a larger collectionof pathway genes has also been defined for these tumors13Vol.:(0123456789)
Genes & Genomics(Fearon 2011). Various targets have been subsequentlyexplored concerning personalized treatments, and these targeted therapies are regarded as a novel approach to improving individual survival outcomes in CRC patients (Xie et al.2020).According to prior large-scale genomic investigations(Cancer Genome Atlas Network 2012; Lu et al. 2019;Nagahashi et al. 2016), well-known driver gene mutationsincluding APC, TP53, SMAD4, PIK3CA, and KRAS, are significantly involved in the tumorigenesis of CRC. Furthermore, the cancer genome atlas (TCGA) has revealed the roleof several new driver genes and potential target pathwaysin these cancers (Cancer Genome Atlas Network 2012).However, the genomic knowledge of CRC has mainly beenacquired from European cohorts, and little information isavailable on the genomic landscape in Asian CRC populations, including Korean CRC cohorts (KOCRC). Multiplegenomic studies have revealed new therapeutic approachesto CRC (Ellis and Perou 2013; Horibata et al. 2020; Nagahashi et al. 2016), uncovering the specific genomic andmolecular profiles of KOCRC cohorts will likely assistwith the tailoring of diagnostic and therapeutic modalitiesfor Korean cases.The present study aimed to identify specific molecular and genetic features of KOCRCs using an integratedapproach that combined clinical data comparisons with awell-defined European CRC population (EUCRC).Materials and methodsDataset establishment and public data processingGenomic and transcriptomic data sets of KOCRC patients(n 126) were obtained from three previous studies(Kimet al. 2016, 2019, 2014) by the Korea Research Institute ofBioscience and Biotechnology (KRIBB, Daejeon, Republic of Korea) and Asan Medical Center (Seoul, Republic ofKorea). Whole exome sequencing (WES) of normal samples was carried out using normal tissues or blood samples(n 42 and n 84, respectively). All patients provided voluntary written formal consent to be included in the study.The study protocol strictly conformed to the Declarationof Helsinki and was approved by the Institutional ReviewBoard of Asan Medical Center (registration numbers:2009–0091, 2014–0150, 2018–0087). The data sets used inthis study are available from GEO (GSE50760, GSE107422,GSE132024) and KoNA (PRJKA210050).To examine possible ethnic differences in the molecularprofiles of CRC between our Korean cases and a European13cohort, we downloaded a CRC dataset from The CancerGenome Atlas (TCGA), and exclusively selected Caucasian cases for our present analyses (EUCRC; n 245) asthe European ancestry cohort. The information for ourEUCRC cases, including MAF, gene expression count, andclinical data, were acquired from the TCGA colon adenocarcinoma (TCGA-COAD) and TCGA rectum adenocarcinoma (TCGA-READ) project through the GDC Data Portal(Cancer Genome Atlas Network 2012). We used MAF filesas an alternative to bam files for WES data and gene expression count files as an alternative to raw RNA sequencing(RNA-seq) fastq files. For further information about samplecollection, histology method, library preparation, and bioinformatics analysis of both cohorts, please see SupplementaryTable 1.Identification of somatic SNVs, indels, and genefusion eventsIn the KOCRC cohort, exome sequencing reads weremapped to the human reference genome GRCh38 (primaryassembly) using bwa-mem (version 0.7.17-r1188) withdefault parameters, followed by sorting of the bam fileswith samtools (version 1.10). As the TCGA databases hadbeen preprocessed using GATK (McKenna et al. 2010), ourdatabases were processed following GATK best practices(GATK version 4.1.4.0). PCR duplicates were removed viaPicard MarkDuplicates (version 2.21.2), and base recalibration was conducted using GATK BaseRecalibrator &ApplyRecalibration. Candidate variants were called viaGATK Mutect2 and filtered using GATK FilterMutectCalls.ANNOVAR (Wang et al. 2010) was used for the annotationsteps.Fusion genes and positions were predicted using STARFusion (version 1.9.1). We used trimmed KOCRC RNA-seqfastq files as the input. We filtered and determined fusiongenes identified in 4-time repeats in a sample. Fusion genes,including non-coding RNA or immunoglobulin-relatedgenes, were excluded from the final selection. The reportedand non-reported fusion genes were distinguished using previous reports.Driver gene and mutational signature identificationMutSigCV (Lawrence et al. 2013) (version 1.3.5) softwarewas used to detect driver genes in our CRC subjects. Briefly,the KOCRC cases were lifted from GRCh38 to GRCh37via the CrossMap (version 0.3.8) for MutSigCV processing. The maftools (Mayakonda et al. 2018) R package (version 2.6.0) was consecutively used to prepare MAF files for
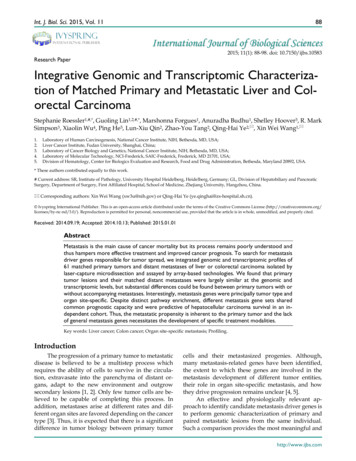
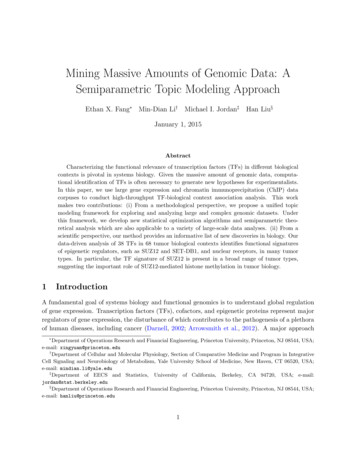
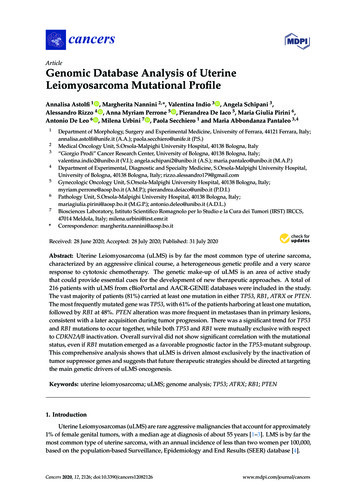
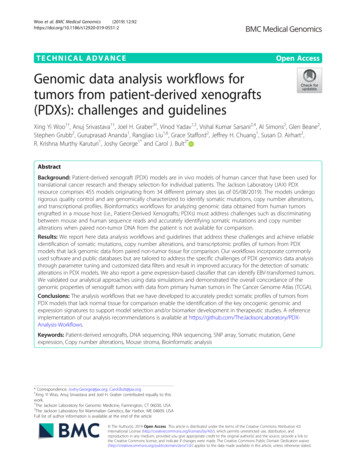
Genes & Genomicsthe MutSigCV analysis, which was finally completed onthe GenePattern (Reich et al. 2006) online platform usingdefault settings.The nonnegative matrix factorization (NMF) R package(version 0.23.0) and maftools R package (version 2.6.0) wereused to identify de novo mutation signatures. The number ofsignatures was estimated based on a cophenetic correlationmatrix. Mutational signatures were then extracted from thetrinucleotide context and decomposed into the designatednumber of signatures.Gene set enrichment analysis (GSEA) and consensusmolecular subtypingTranscriptomic data from the KOCRC and EUCRC cases wereused to conduct GSEA. Trimmed RNA-seq fastq files weremapped to GRCh38 (primary assembly) on STAR (Dobin et al.2013) (version 2.7.3a), concurrently estimating the expressioncounts. The edgeR (Robinson et al. 2010) R package (version3.32.0) was used to obtain log2 fold-changes in gene expression between normal and tumor tissues. The fgsea (Korotkevich et al. 2021) R package was used to perform GSEAwith the 50 hallmark gene set (v7.2) from MSigDB (Liberzonet al. 2015). Significantly enriched gene sets were filtered andacquired based on a cutoff level at q 0.01. Enriched knownoncogenic pathways were examined on a maftools R package. Oncogenic signaling pathways were derived from TCGAcohorts. The values of “fraction mutated samples” were usedto compare the influence in oncogenic pathways between theKOCRC and EUCRC cohorts.To identify consensus molecular subtypes (CMS) of CRCsamples, we used the CMSclassifier R package (Guinneyet al. 2015). Transcriptomic data was initially normalized tocounts per million bases (CPM). Log transformations weresubsequently conducted by adding one pseudo-count transformed into a l og2 scale. A random forest classifier methodwas used to arrange the KOCRC and TCGA samples into fourCMS classes. The ambiguous subtypes were designated as‘unspecified’.StatisticsA Wilcoxon signed-rank test was used to determine differencesbetween two dependent samples with unknown distribution,while continuous variables were compared using paired Student’s t-tests. The chi-square test was used to compare clinicaldatasets on oncogenic pathways, whereas mutational frequencies between KOCRC and EUCRC gene sets were comparedwith a Fisher’s exact test. All statistical analyses were performed using the limma (Ritchie et al. 2015) R package (ver.3.48.0), with a two-sided p 0.05 defined as statisticallysignificant.ResultsGeneral clinical features of the KOCRC and EUCRCcohortsThis study was designed to enable genomic comparisons of CRC patients of Korean and European descent,i.e., KOCRC and EUCRC cohorts (Fig. 1a). The clinical features of these cases were also compared, including cancer stage, primary tumor site, and patient demographics (Fig. 1b). The gender ratios were similar betweenthe cohorts (p 0.1), but differences were evident in thecancer stage, primary site, and age (p 0.004, 0.001, and3.86 1 0 8, respectively). Age differences were particularly noticeable, with the KOCRC cohort having a medianage of about 58, which was ten years younger than of theEUCRC patients.We estimated the tumor mutation burden (TMB) ofthe two cohorts (Fig. 1c) and found a median TMB permegabase (TMB/MB) of 2.65 and 2.76, respectively, forthe KOCRC and EUCRC populations. It appeared fromour analyses that the higher proportion of rectum adenocarcinoma (READ) in the KOCRC cohort may haveaffected the median TMB/MB (the READ proportions forthe KOCRC and EUCRC groups were about 47.6% and29.8%, respectively) but this was not statistically significant (p 0.13).Mutation analysis centered on driver genesUsing the driver detecting software, MutSigCV, we foundsix previously well-known CRC driver genes (APC, TP53,KRAS, FBXW7, SMAD4, and AMER1) common betweenthe two cohorts. In contrast, three putative novel CRCdriver genes (MUC7, PABPC1, and B2M) were identifiedin the KOCRC cohort at a false discovery rate (FDR) of0.05. Additionally, we adopted well-known CRC drivergenes from Integrative Onco Genomics (Martinez-Jimenezet al. 2020) (intOgen) and other previous studies for thesecomparative analyses (Hanna et al. 2013; Lu et al. 2019).A gene set of 25 driver genes was used in further analyses(Fig. 2a).The most frequently mutated driver genes in theKOCRC cohort were APC (53%), TP53 (42%), KRAS13
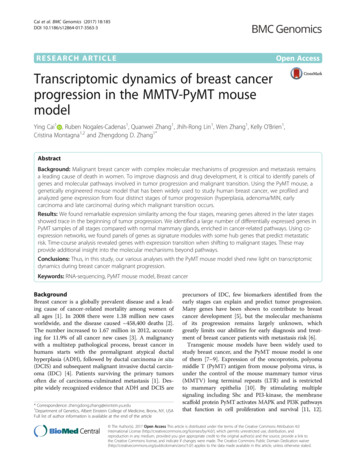
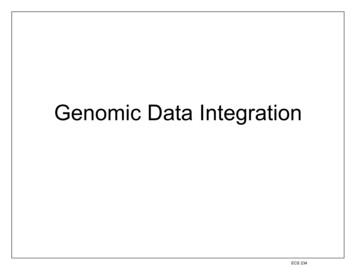
Genes & GenomicsFig. 1 Workflow and clinical data comparisons. (a) Workflow ofthis study. (b) Clinical data comparison between the KOCRC andEUCRC cohorts. Asterisks are labeled according to the p-values calculated. The p-values for stage, primary site, gender, and age were0.004032, 0.001053, 0.09634, and 3.86e-08, respectively (KOCRC:n 126, EUCRC: n 245). (c) TMB comparisons. The first plotshows a direct comparison between the KOCRC and EUCRC populations, and the next two plots compare each cohort with TCGA-COADand TCGA-READ(37%), PABPC1 (21%), and PIK3CA (21%) (Fig. 2a). Interms of mutation frequency, most of the driver genesshowed similar tendencies between the two cohorts, exceptfor APC, TP53, PABPC1, FAT4, MUC7, HSPG2, GNAS,DENND5B, and BRAF (Fig. 2b, c and SupplementaryFig. 1). Mutations in the APC, TP53, FAT4, and BRAFgenes were more frequent in the EUCRC cases, whereasthose of PABPC1, MUC7, HSPG2, GNAS, and DENND5Bwere more frequent in the KOCRC series (Fig. 2b, c).Regarding the three putative novel drivers identified in theKOCRC cohort, MUC7, PABPC1, and B2M were mutatedin 19, 27, and 7 samples, respectively, out of the 126 totalKOCRC samples.cosine similarities against single base substitution (SBS)COSMIC (Tate et al. 2019) signatures to identify the bestmatches (Fig. 3a, b). We thereby identified ‘defective DNAmismatch repair (dMMR)’ (COSMIC Signature 6), ‘POLE’(COSMIC Signature 10), ‘unknown’ (COSMIC Signature5), and ‘sequencing artifact’ (COSMIC Signature 45) inthe KOCRC cohort, and ‘aging’ (COSMIC Signature 1),‘dMMR’, and ‘POLE’ signatures in the EUCRC populations. Both cohorts have ‘dMMR’ and ‘POLE’signatures,which have also been verified in many other cancer types.The ‘unknown’ signature, COSMIC Signature 5, also arisesin all cancer types but remains to be verified.Mutational signature analysisGSEA and oncogenic pathwaysWe used the NMF algorithm to identify mutational signatures in the KOCRC and EUCRC patients and calculatedUsing transcriptomic data, we conducted GSEA using 50hallmark gene sets from MSigDB. To identify significantly13
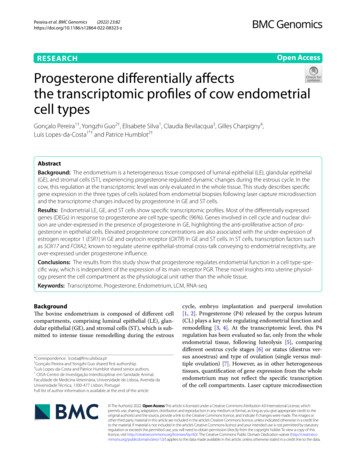
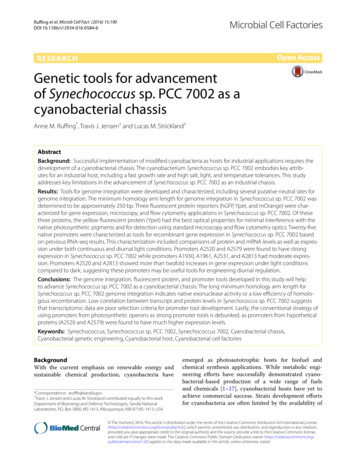
Genes & GenomicsaAltered in 110 (87.3%) of 126 9%7%6%6%6%6%6%6%4%3%2%Primary SiteGenderAgeStageMissense MutationNonsense MutationFrame Shift DelFrame Shift InsIn Frame InsIn Frame DelSplice SiteMulti HitbKOCRC(n 126)Primary SiteColonRectumGenderFemaleMalecEUCRC(n 245)StageAge 20 30 40 50 60 AT46320*HSPG21516*GNAS69*KOCRC (n 126) v/s EUCRC (n 80%Stage IStage IIStage IIIStage IV 80 9080%-4.250.004.25Log odds ratioEUCRCKOCRCFig. 2 Mutation analysis of driver genes. (a) Mutational profiles ofthe KOCRC cohort are shown with clinical data. The annotations fordriver genes (intOgen, MutSigCV, and reported) are indicated on theleft side. (b) Comparison of the mutation frequencies of driver genesbetween the KOCRC and EUCRC cohorts. Only genes with sig-nificant differences in frequency are shown (p-value 0.05). A 2 2Fisher’s exact test was performed for each gene. (c) Forest plot of differently mutated genes for p-values 0.05 between the KOCRC andEUCRC groupsenriched gene sets, we applied an FDR cutoff of 0.01(Fig. 4a). The results indicated that seven hallmark genesets were significantly enriched in both cohorts, whereasanother 12 and 5 were exclusively enriched only in theKOCRC and EUCRC groups, respectively (Fig. 4b). The12 gene sets enriched and up-regulated only in the KOCRCcohort were ‘mitotic spindle’, ‘G2M checkpoint’, ‘adipogenesis’, ‘myogenesis’, ‘interferon gamma response’, ‘unfoldedprotein response’, ‘PI3K/AKT/mTOR signaling’, ‘MYCtargets v2’, ‘epithelial mesenchymal transition’, ‘inflammatory response’, ‘IL2 STAT5 signaling’, and ‘peroxisome’.The five gene sets enriched and down-regulated only in theEUCRC cohort were ‘TNFα signaling via NFκB’, ‘proteinsecretion’, ‘apical surface’, ‘oxidative phosphorylation’, and‘reactive oxygen species pathway’.We used ten canonical oncogenic signaling pathwaysderived from TCGA cohorts (Sanchez-Vega et al. 2018)(Fig. 4c) to perform pathway analysis. Pathway analyseswere performed using genomic data. In most pathways, thefrequencies of affected samples were similar in both cohorts.However, in the β-catenin/WNT and p53 signaling pathways,significantly more fractions of samples were affected in the13
Genes & Genomicsacosine similarity against validated signatures KOCRCSignature 1Signature 2Signature 3Signature BS7cSBS7bSBS7aSBS6SBS5SBS4SBS3SBS2SBS10.40.2cosine similarity against validated signatures EUCRCSignature 1Signature 2Signature 0.10.10.00.0Best match: SBS6 [cosine-similarity: 0.93]Aetiology: defective DNA mismatch repair0.30.20.20.10.10.00.0Best match: SBS45 [cosine-similarity: 0.941]Aetiology: Possible sequencing artefact0.30.40.2Best match: SBS1 [cosine-similarity: 0.914]Aetiology: spontaneous or enzymatic deamination of 5-methylcytosineBest match: SBS10b [cosine-similarity: 0.861]Aetiology: Polymerase epsilon exonuclease domain mutationsBest match: SBS6 [cosine-similarity: 0.93]Aetiology: defective DNA mismatch repair0.30.20.20.10.10.00.0C ABest match: SBS5 [cosine-similarity: 0.903]Aetiology: Unknown0.30.6EUCRCBest match: SBS10a [cosine-similarity: 0.818]Aetiology: Polymerase epsilon exonuclease domain mutations0.30.8C GC TT AT CT G0.20.10.0C AC GC TT AT CT GFig. 3 Mutational signatures among the KOCRC and EUCRCpatients. (a) Heat maps of cosine similarities between a group ofSBS COSMIC signatures (v3) and the mutational signatures of eachcohort. The mutational signatures for the KOCRC and EUCRC popu-lations were divided into four groups using the NMF algorithm. Eachmutational signature found by this algorithm was compared to theSBS COSMIC signature (v3). (b) Plots of decomposed mutationalsignatures for the KOCRC and EUCRC cohortsEUCRC cohort, whereas the Notch signaling pathway hada higher fraction of affected samples in the KOCRC cohort.We first compared the proportions of each CMS in the twocohorts after deducting the ‘unspecified’ subtype (Fig. 5a,b, Supplementary Fig. 2). The prevalence of CMS1-4 forthe KOCRC cohort were 11.3%, 30.0%, 13.8%, and 45.0%,respectively. For the EUCRC cohort, these percentages were13.1%, 30.6%, 19.7%, and 36.6%, respectively (p 0.5215).We next compared the reported features of each CRCCMS with our current data (Fig. 5a, SupplementaryFig. 2). CMS1 is known as an MSI high and BRAF mutation enriched subtype (Guinney et al. 2015). In the EUCRCCMS classificationA prior study established four CMSs for CRC and developed a tool named ‘CMSclassifier’ (Guinney et al. 2015). Toinvestigate how well our data fitted with existing findings,we utilized ‘CMSclassifier’ to analyze our transcriptomicdata from both the KOCRC and EUCRC cohorts.13
Genes & Genomicscohort, CMS1 samples (n 24) showed this expected highMSI and BRAF mutation rate (62%), whereas the KOCRCCMS1 samples (n 9) showed MSI high features but noBRAF mutations. CMS3 is known to have a high frequency of KRAS mutation (Guinney et al. 2015). This factwas also found in our cohort, in which CMS3 samplesshowed the highest KRAS mutation frequencies of thefour subtypes. The KRAS mutation frequency was 55%for KOCRC CMS3 (n 11) and 61% for EUCRC CMS3(n 36) (Fig. 5c). Additionally, even though some variation may be anticipated because of the limited number ofsamples, CMS4 samples for both of our present cohortstended to have higher proportions of cancer stage IV casesthan other subtypes (Fig. 5d).Fusion genes in the KOCRCs patientsWe used STAR-Fusion software to identify fusion genesin the KOCRC cohort present in at least four patients.Four intrachromosomal fusion genes (SEPTIN7P2-PSPH,OR51S1-TP53I11, PTPRK-RSPO3, and PMS2P6-CCDC146in 47, 20, 7, and 7 cases, respectively) and two interchromosomal fusion genes (YAF2-RYBP and FBXO25-SEPTIN14found in 13 and 6 patients, respectively) were therebyidentified.We then examined whether these six fusion genes hadany effects on gene expression. The samples harboring aPTPRK-RSPO3 fusion showed a dramatic increase inRSPO3 expression (Wilcoxon test, p 2.0357 10–5; Supplementary Fig. 3, Fig. 6a). We observed two different kindsof PTPRK-RSPO3 fusions that contained either exon1 orexon7 of PTPRK and exon2 of RSPO3 (Fig. 6b). Furthermore, the PTPRK-RSPO3 fusion showed a mutually exclusive pattern with the APC mutation (Fig. 6c).DiscussionBy comparing large cohorts and establishing the genomiclandscape of KOCRCs, the commonalities and differencesbetween CRC patients of Korean and European ancestrycould be identified and discussed. In the comparative analyses of the clinical data for these populations, it was notablethat the KOCRC and EUCRC cohorts showed significantage differences, with a median age of about 58 and 68,respectively. The lower median age of the KOCRC patientsis likely to be related to the higher prevalence of this cancerin Korea and the national health checkups for all Koreancitizens over the age of 50. These checkups include a CRCscreen using a stool occult blood test and a colonoscopy,which can improve the early diagnosis of CRC.The KOCRC and EUCRC cohorts in our present studyshowed differences in the mutation frequencies in severaldriver genes. Of note, the lower mutation frequency of theBRAF gene in our Korean subjects is consistent with anotherstudy of CRCs from distinct ethnic groups that also foundvariations in the BRAF mutation frequency (Hanna et al.2013). In addition, the higher mutation frequencies observedin the GNAS and DENND5B genes in our KOCRC cases issupported by another study that identified 13 loci that weresignificantly associated with the risk for CRC in Asians.Two of these 13 loci were located inside or near the proteincoding regions of GNAS and DENND5B (Lu et al. 2019).We additionally identified three new putative driver genes(MUC7, PABPC1, B2M) in our KOCRC population. MUC7has often been associated with other cancer types, particularly bladder cancer, and its expression levels have beenassayed in many tumor types (Retz et al. 1998). However, thesignificance of MUC7 mutations in CRC remains uncertain.PABPC1 (poly A binding protein cytoplasmic1) is known toplay a role in the post-transcriptional control of mRNA andmay be involved in tumorigenesis (Takashima et al. 2006).In addition, several studies have revealed that this gene hasimportant roles in tumor progression and carcinogenesis inboth esophageal and gastric cancer (Takashima et al. 2006;Zhu et al. 2015). B2M mutations are often reported in highlevel microsatellite instability (MSI-H) CRCs (Tikidzhievaet al. 2012). Robust evidence is available that correlates B2Mvariations and immune escape in CRC (Grasso et al. 2018;Ozcan et al. 2018), and this gene also acts as a driver in diffuse large B cell lymphoma (DLBC) (Fan et al. 2020).The most frequently mutated genes in our EUCRC cohortwere APC, TP53, FAT4, and BRAF. These four genes areinvolved in major carcinogenesis pathways, including theWnt, Hippo, and MAPK signaling pathways. Of the genesmost frequently mutated in the KOCRC cohort, the activating mutation in GNAS has been reported previously in APCdeficient mice to promote intestinal tumorigenesis by activating the Wnt and ERK1/2 MAPK pathways (Wilson et al.2010). In another prior study, the GNAS mutation functionedas an alternative activator of the Wnt/beta-catenin signalingpathway in gastric adenocarcinoma (Nomura et al. 2014).These results suggest that the Wnt/beta-catenin pathway isactivated in Korean CRC patients by a GNAS-mediated alternative pathway and a canonical APC pathway. We speculatethat this alternative mechanism of Wnt pathway activationby GNAS may partially explain the lower mutational frequency of the APC gene in the KOCRC compared to the13
Genes & ******************************b3APOPTOSIS2ESTROGEN RESPONSE EARLYESTROGEN RESPONSE LATE1INTERFERON ALPHA RESPONSE0XENOBIOTIC METABOLISM-1FATTY ACID METABOLISMALLOGRAFT REJECTION-2MITOTIC SPINDLE-3G2M CHECKPOINT FDR 0.001 FDR 0.01 FDR 0.05ADIPOGENESISMYOGENESISKOCRC12EUCRC57INTERFERON GAMMA RESPONSEUNFOLDED PROTEIN RESPONSEPI3K AKT MTOR SIGNALINGMYC TARGETS V2EPITHELIAL MESENCHYMAL TRANSITION*INFLAMMATORY RESPONSEIL2 STAT5 SIGNALINGPEROXISOME*************TNFA SIGNALING VIA NFKBKOCRCEUCRCPROTEIN SECRETIONAPICAL SURFACEOXIDATIVE PHOSPHORYLATIONREACTIVE OXYGEN SPECIES PATHWAYKOCRC EUCRCcCohort100%EUCRCSymbol Meaning********75%Fraction mutated samplesKOCRC*nsP 0.05*P 0.05**P 0.01***P 0.001****P 3TGF-BetaMYCCell CycleNRF2
Genes & Genomics Fig. 4 Analyses of gene sets and pathways among the different CRCcohorts. (a) Heat map of the GSEA results for hallmark gene sets.The heatmap was drawn according to normalized enrichment scores(NES). Asterisk labeling is based on FDR values. (b) Venn diagramof enriched hallmark gene sets in the KOCRC and EUCRC cohorts.(c) Comparison of the mutation frequency of genes in 10 hallmarkpathways across the KOCRC and EUCRC patient subjects. Asterisksindicate significant differences based on a chi-square test. The p-values for the WNT, NOTCH, and TP53 pathways were 1.64e-09, 4.88e06, and 0.011, respectivelyEUCRC cohort in our current study. However, we predictthat the PTPRK-RSPO3 fusion gene likely plays a role in analternative mechanism of Wnt pathway activation. The Wntdependent endogenous Rspo2 and Rspo3 chromosomal rearrangements can initiate and maintain colorectal carcinogenesis (Han et al. 2017). Another previous study has suggesteda role for the PTPRK-RSPO3 fusion gene in activating Wnt/beta-catenin signaling because it showed a mutually exclusive pattern with APC or beta-catenin mutations (Hao et al.2016), which is in line with our present data indicating itsmutual exclusiveness with APC mutations. Taken together,the cumulative evidence now suggests that two alternativepathways, including GNAS-mediated and PTPRK-RSPO3fusion-mediated mechanisms, may play an important role inthe activation of Wnt/beta-catenin signaling in place of APCmutations in Korean CRC lesions. Additionally, DENND5B,a guanine nucleotide exchange factor that activates RAB39Aand RAB39B, was previously identified as one of 13 loci significantly associated with risk for CRC in Asians (Lu et al.2019). Further studies are needed to determine the roles ofDENND5B in colorectal carcinogenesis.Our current mutational signature analysis results suggested that KOCRCs and EUCRCs are very similar exceptfor the unknown signature (COSMIC Signature 5), indicating that the major mutational signatures are conservedamong these two cohorts. The aging signature (COSMICSignature 1) was evident in EUCRC cases which were notsurprising since the median age of the EUCRC cohort wasolder than that of the KOCRC cohort. POLE has a crucialrole in chromosomal DNA replication due to its proofreading capacity and is known to be mutually exclusive withdMMR. Somatic mutations in the proofreading domainsof POLE have been identified in relation to microsatelliteinstability (MSI), which has been found to occur in CRCdue to a dMMR system with key MMR genes inactivated byvarious mechanisms (Domingo et al. 2016; Kim et al. 2013).Moreover, mutations in polymerase proofreading–associatedsyndrome involving POLE and POLD1 constitute 0.3–0.7%of familial cancer cases when only CRC and polyposis areconsidered (Mur et al. 2020).In our GSEA and pathway analysis for mutated genes, weidentified significant differences in some hallmark gene setsand pathways between the KOCRC and EUCRC patients.These results indicate that Korean CRC cases may requiredifferent therapeutic approaches than the current conventional methods. Among the gene sets enriched in KOCRCwere upregulated immune-related gene sets such as ‘interferon gamma response’, ‘inflammatory response’, and ‘IL2STAT5 signaling’, indicating the possibility that immunotherapy-based approaches could be effective in these cases.In the CMS analysis we conducted in our present series,we assessed the previously established four CRC subtypes(CMS1-4) (Guinney et al. 2015). CMS1 is the MSI immunogenic type, CMS2 is the canonical type, CMS3 is a metabolictype and CMS4 is a mesenchymal type. CMS1 was enrichedfor MSI tumors and BRAF-mutations. CMS2 tumors hadepithelial characteristics with marked WNT and MYC signaling augmentation and
the two datasets in terms of clinical data, driver genes, mutational signature, gene sets, consensus molecular subtype, and fusion genes. Results These two cohorts showed similar proles in driver mutations but dierences in the mutation frequencies of some driver genes (including APC, TP53, PABPC1, FAT4, MUC7, HSPG2, GNAS, DENND5B, and BRAF .