Transcription
Int. J. Biol. Sci. 2015, Vol. 11IvyspringInternational Publisher88International Journal of Biological SciencesResearch Paper2015; 11(1): 88-98. doi: 10.7150/ijbs.10583Integrative Genomic and Transcriptomic Characterization of Matched Primary and Metastatic Liver and Colorectal CarcinomaStephanie Roessler1,#,*, Guoling Lin1,2,#,*, Marshonna Forgues1, Anuradha Budhu1, Shelley Hoover3, R. MarkSimpson3, Xiaolin Wu4, Ping He5, Lun-Xiu Qin2, Zhao-You Tang2, Qing-Hai Ye2, , Xin Wei Wang1, 1.2.3.4.5.Laboratory of Human Carcinogenesis, National Cancer Institute, NIH, Bethesda, MD, USA;Liver Cancer Institute, Fudan University, Shanghai, China;Laboratory of Cancer Biology and Genetics, National Cancer Institute, NIH, Bethesda, MD, USA;Laboratory of Molecular Technology, NCI-Frederick, SAIC-Frederick, Frederick, MD 21701, USA;Division of Hematology, Center for Biologics Evaluation and Research, Food and Drug Administration, Bethesda, Maryland 20892, USA.* These authors contributed equally to this work.# Current address: SR, Institute of Pathology, University Hospital Heidelberg, Heidelberg, Germany; GL, Division of Hepatobiliary and PancreaticSurgery, Department of Surgery, First Affiliated Hospital, School of Medicine, Zhejiang University, Hangzhou, China. Corresponding authors: Xin Wei Wang (xw3u@nih.gov) or Qing-Hai Ye (ye.qinghai@zs-hospital.sh.cn). Ivyspring International Publisher. This is an open-access article distributed under the terms of the Creative Commons License ). Reproduction is permitted for personal, noncommercial use, provided that the article is in whole, unmodified, and properly cited.Received: 2014.09.19; Accepted: 2014.10.13; Published: 2015.01.01AbstractMetastasis is the main cause of cancer mortality but its process remains poorly understood andthus hampers more effective treatment and improved cancer prognosis. To search for metastasisdriver genes responsible for tumor spread, we integrated genomic and transcriptomic profiles of61 matched primary tumors and distant metastases of liver or colorectal carcinoma isolated bylaser-capture microdissection and assayed by array-based technologies. We found that primarytumor lesions and their matched distant metastases were largely similar at the genomic andtranscriptomic levels, but substantial differences could be found between primary tumors with orwithout accompanying metastases. Interestingly, metastasis genes were principally tumor type andorgan site-specific. Despite distinct pathway enrichment, different metastasis gene sets sharedcommon prognostic capacity and were predictive of hepatocellular carcinoma survival in an independent cohort. Thus, the metastatic propensity is inherent to the primary tumor and the lackof general metastasis genes necessitates the development of specific treatment modalities.Key words: Liver cancer; Colon cancer; Organ site-specific metastasis; Profiling.IntroductionThe progression of a primary tumor to metastaticdisease is believed to be a multistep process whichrequires the ability of cells to survive in the circulation, extravasate into the parenchyma of distant organs, adapt to the new environment and outgrowsecondary lesions [1, 2]. Only few tumor cells are believed to be capable of completing this process. Inaddition, metastases arise at different rates and different organ sites are favored depending on the cancertype [3]. Thus, it is expected that there is a significantdifference in tumor biology between primary tumorcells and their metastasized progenies. Although,many metastasis-related genes have been identified,the extent to which these genes are involved in themetastasis development of different tumor entities,their role in organ site-specific metastasis, and howthey drive progression remains unclear [4, 5].An effective and physiologically relevant approach to identify candidate metastasis driver genes isto perform genomic characterization of primary andpaired metastatic lesions from the same individual.Such a comparison provides the most meaningful andhttp://www.ijbs.com
Int. J. Biol. Sci. 2015, Vol. 11physiological relevance to human cancer. However,such high quality patient samples of primary tumorsand matched metastases are generally not availabledue to the fact that most of the metastatic lesions develop many years after initial cancer diagnosis andintervention. Thus, most studies investigating genesinvolved in metastasis rely on in vitro assays, animalmodels or metastases from autopsy without matchedprimary tumors. One approach which was taken inearlier studies is the selection of metastatic cells via invivo mouse models, whereby, primary tumor tissuesor cell lines are introduced into mice and organsite-specific metastatic cells are selected over multiplecycles and analyzed [6-8]. These studies led to thediscovery of many pro-metastatic genes [9]. But onlyfew studies so far compared a limited amount ofprimary tumors and paired metastases. Interestingly,gene profiling of 8 primary breast tumors and pairedmetastases revealed striking similarity between theprimary tumor and the distant metastasis of the samepatient [10]. In addition, the analysis of a metastasissignature obtained from comparison of multiple cancer types and unmatched primary tumors was able topredict patient outcome in breast, lung, prostate adenocarcinoma and medulloblastoma [11]. Previously,we have shown that primary hepatocellular carcinoma (HCC) samples and their corresponding intrahepatic metastases derived from surgical resection donot exhibit any statistically significant differences [12].However, these results were based on intrahepaticmetastatic lesions and thus their difference may beminimal.To overcome the limitations described above, wecollected high quality gastrointestinal tumor specimens derived from patients with primary tumors andcorresponding distant metastases, whose metastaticlesions were determined to be potentially treatable bysurgery. We collected a set of paired primary anddistant metastatic liver and colon carcinomas fromsurgical resection with the goal of identifying metastasis dissemination-related genes. We performed geneexpression profiling of laser capture microdissectedtumor and paired metastasis and genome-wide somatic copy number alteration (SCNA) profiling toensure that the identified genes are tumor-specific.We found that liver metastases display some genomicinstability compared to their paired primary tumorsbut the gene expression profiles of primary liver andcolorectal carcinoma did not show any significantdifferences. In contrast, liver metastases of colorectalcarcinoma patients differed greatly from liver carcinoma. The integrative analysis of gene expression andSCNA data showed that potential cancer driver genesare enriched in primary tumor lesions with metastaticpotential and that the organ site-specific metastasis89gene signatures are associated with HCC prognosisdespite of their distinct gene sets and related pathways.MethodsLiver and colorectal carcinoma tissue samplesand clinical data. Primary tumors and metastatictissues were obtained with informed consent frompatients who underwent radical resection or livertransplantation between 2004 and 2006 at the LiverCancer Institute (LCI, Fudan University, Shanghai,China). The study was approved by the InstitutionalReview Board of LCI, Fudan University, Shanghai. Atotal of 39 patients, 7 colorectal adenocarcinoma, onegastric adenocarcima, 26 HCC, 4 cholangiocarcinomaand one angiosarcoma patient were recruited. Synchronous liver metastasis from all 7 colorectal carcinoma patients, synchronous lung metastasis from 2liver cancer patients, 5 synchronous lymph node metastasis, and 3 synchronous adrenal gland metastasiswere obtained at the time of surgery of the primarytumor. For 11 liver cancer patients, metachronouslung metastases were resected after primary tumorsurgery and 10 HCC patients did not develop anymetastasis at 2 years post resection. All patients werediagnosed by two independent pathologists, withdetailed information on clinical presentation andpathological characteristics. In addition, tissue samples of 5 patients with hemangioma were obtained.Tissue samples were fresh frozen in liquid nitrogenwithin 30 minutes of surgical excision.Laser capture microdissection (LCM). Enrichedtumor cells from 61 primary and metastatic tumorspecimens were obtained by laser capture microdissection (LCM). Selected tissue foci were microdissected with a laser microdissection microscope(LMD6000, LeicaMicrosystems, Buffalo Grove, IL)equipped with a 355nm ultraviolet laser diode fromHematoxylin & Eosin stained, 8µm thick, tissue sections mounted on glass slides containing a polyethylene naphthalate (PEN) membrane (Life Technologies, Grand Island, NY). Representative LCM imagesare shown in Figure 1B and Supplementary Material:Figure S1. The dissected cell population was selectedwith the aid of a drawing tablet and integrated pentool (Wacom. Vancouver, WA). One Hematoxylin/eosin-stained section of each specimen was reviewed by a pathologist to confirm diagnosis andpresence of tumor. The pathologist indicated whichrepresentative sections of the tumors should be microdissected. Tumor cells from primary tumor andmetastatic specimens were collected.RNA isolation and gene expression microarrays.Following LCM, total RNA was isolated from dissected tissues using the PicoPure protocol (Arcturus,http://www.ijbs.com
Int. J. Biol. Sci. 2015, Vol. 11Mountain View, CA). RNA quality was analyzed using the Agilent 2100 Bioanalyzer RNA 6000 Pico Assay (Agilent, Santa Clara, CA). The mRNA was amplified with two linear amplification steps by in vitrotranscription using the MEGAscript T7 kit (Ambion,Austin, TX), followed by the labeling step using theBioArray HighYield RNA Transcript Labeling Kit T3from Enzo Life Sciences (Farmingdale, NY). LabeledcRNA was hybridized onto Affymetix HG-U133 Plus2.0 Arrays. CEL files with the normalized expressiondata, and additional tumor marker information, weredeposited in the GEO repository (GSE40367).Analysis of gene expression data. All AffymetrixHG-U133 Plus 2.0 microarrays were normalized withMAS 5.0 in BRB array tools Version ).Arrays were normalized to the median array. Afterexclusion of probes with more than 50% missing or50% absent calls, 23,515 probes of a total of 54,675probes on the HG-U133 Plus 2.0 arrays remained.Class comparison of the gene expression data wasperformed in BRB-Array Tools (http://linus.nci.nih.gov/BRB-ArrayTools.html). For survival risk prediction, genes whose expression was significantly relatedto survival by univariate Cox proportional hazardsregression were used by principal component analysis. Next, to compute a prognostic index, the weightedaverage of the principal component values was calculated, using the regression coefficients derived fromthe Cox regression. Finally, this prognostic index wasused to split samples into two groups of equal size bythe median of the prognostic index. Thereby, a highvalue of the prognostic index corresponded to a highvalue of hazard of death (high risk), and consequentlya relatively poor predicted survival (low risk). In order to evaluate the predictive value of the method,10-fold cross-validation with 1000-fold random permutation of the Cox-Mantel log-rank test was performed. We used clustering applying Euclidean distance and average linkage of the survival groups foreach gene signature to analyze patient subgroups.DNA isolation and arrayCGH. Somatic copynumber alterations of 7 colon adenocarcinomas withpaired liver metastasis and 10 liver carcinoma withmetastasis to the lymph node, adrenal gland or lungwere analyzed by Agilent array-based comparativegenomic hybridization (CGH) as previously described[13]. Briefly, genomic DNA was isolated using proteinase K digestion (P2308, Sigma-Aldrich, St. Louis,MO) and subsequent Phenol/Chlororform extraction.Purified DNA was quantified by the fluorometricassay Quant-iT Pico Green dsDNA (Invitrogen,Carlsbad, CA). ArrayCGH Human-Genome-CGH105A Oligo Microarrays G4412A were carried outaccording to the manufacturer's instructions (Agilent,90Santa Clara, CA). Five micrograms of genomic DNAand reference DNA of the opposite gender (humangenomic DNA, Promega, San Luis Obispo, CA) weredigested with the restriction enzymes AluI and RsaI.Digested DNA was labeled using the BioPrime ArrayCGH Genomic Labeling kit (Invitrogen, Carlsbad,CA) according to the manufacturer's instructions.Tumor and reference DNA were combined and hybridized to Human Genome CGH 105A Oligo Microarray glass slides (G4412A, Agilent, Santa Clara, CA)for 36–40 hours at 65 C, washed and dried. Subsequently, dried array slides were scanned using theDNA Microarray Scanner (Agilent, Santa Clara, CA).Raw image files of the arrays were processed usingFeature Extraction software 8.1 (Agilent, Santa Clara,CA). Arrays with derivative log ratio spread (DLRS)higher than 0.2 log units were repeated and accordingto MIAME guidelines, raw data Feature Extractionfiles were deposited into the GEO repository(GSE41210).Analysis of arrayCGH data. All algorithms wereimplemented in the R programming language (version 2.15.0; www.r-project.org). Signal intensitieswere preprocessed by the Agilent feature extractionsoftware followed by segmentation analysis using thesnapCGH (version 1.26.0) R package available at theBioconductor (www.bioconductor.org) as previouslyreported [13]. In brief, sex chromosomes were excluded from the arrayCGH analysis because the opposite gender was used as a reference for qualitycontrol. Intensity ratios of the tumor over referencesamples were logarithm-2 (log2) transformed, median-centered, and subjected to an improved circularbinary segmentation algorithm [14]. Segments without significant statistical differences were merged intothe same states using the method provided by Willenbrock and Fridlyand [15]. Centers of the segmentation means for individual arrays were determinedby setting the mode of density distribution as thebaseline (log2 ratio 0). The DNA copy number aberrations at particular genomic locations were determined by the corresponding segmentation means.Regions with segmented log2 ratios greater than 0.3and smaller than -0.3 were considered regions of gainand loss, respectively. For unsupervised hierarchicalclustering of the arrayCGH data, segmented data wasconverted to 1, -1, 0 according to their respective status of gain, loss and no change, and then weighted bythe squares of the frequencies of copy number gain orloss at a particular genomic location. Adjacent probeswith identical DNA copy number profiles across allsamples were combined to form unique segments.Average-linkage clustering was performed based onthe Euclidean distance metric. The significance of thedifference in gain or loss status between HCC subhttp://www.ijbs.com
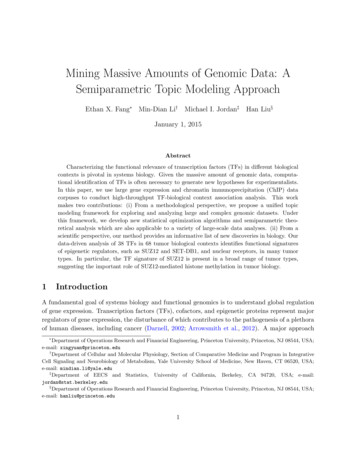
Int. J. Biol. Sci. 2015, Vol. 11groups in unique segments was determined by theFisher’s exact test and the p-values were adjusted using Benjamini-Hochberg correction. Adjacent significant regions with gaps less than 50kb were combinedand considered as one large region with differentialgenomic aberrations between subgroups.Correlation analysis. To calculate the Spearmanor Pearson correlation coefficients (r) for genes withmore than one probe set, the mean gene expressionwas calculated. For each gene, the correlation coefficient between the segmented log2 ratios of the DNAcopy number and the expression values was computed, as done previously [13]. The empirical nulldistribution was obtained from the Spearman orPearson correlation coefficients calculated from 1,000random permutations, as indicated. Genes with correlation coefficients greater than the one corresponding to the 95th percentile of the empirical null distribution were considered positively correlated betweenDNA copy number alteration and expression.Pathway analyses and statistics. Organsite-specific metastasis gene lists resulting from classcomparisons were analyzed by Ingenuity cts/ipa). We performed IPA of the respectivecorresponding probe sets to each organ site specificmetastasis gene list with the associated fold change asinput. For each of the three gene signatures enrichment of genes in canonical pathways was analyzedseparately. The statistical significance was defined asp 0.05. To account for multiple testing, a statisticalsignificance of p 0.001 and False Discovery Rate(FDR) 0.1 ( 10% false positives) were used.ResultsGene expression profiling of matched primarytumors and distant metastases reveals a highdegree of similarity.We conducted gene expression profiling of a total of 61 matched primary liver and colon carcinomalesions with paired synchronous metastasis to thelung, lymph nodes, adrenal glands, or liver, and ofliver carcinomas without tumor relapse at 2-year posttumor resection (Supplementary Material: Table S1and Figure 1A). To exclude gene expression patternsof the tumor stroma, enriched tumor epithelia wereobtained by laser capture microdissection (LCM) andrepresentative images of LCM are shown in Figures1B and S1. Because the liver microenvironment wasshown to exhibit a distinct metastasis signature whichis characteristic of a Th1/Th2-like cytokine shift, wealso attempted to isolate tumor stroma for gene expression profiling by LCM [16]. However, we werenot able to obtain enough material to perform micro-91array analysis and thus, focused our analysis on thecomparison of tumor epithelia in primary tumors andpaired metastasis. Unsupervised hierarchical clustering of the gene expression data revealed four majortumor-site-specific and organ-specific clusters wheremost of the primary tumors (14/17) preferentiallyclustered with their paired extrahepatic metastases(Figure 1C), reminiscent of our previous findings withintrahepatic metastases [12]. Among primary livercarcinoma with extrahepatic metastasis (PEM), 2synchronous (PEM-12, PEM-13) and 8 metachronouslung metastases fell into the same cluster. Thus, synchronous and metachronous metastasis to the lungshowed more similarities than metastasis to otherorgans such as the lymph node or adrenal gland. Itappears that tumors and their paired metastases sharesimilar gene expression profiles and that liver cancerswith different metastatic sites have distinct transcriptomes.Table 1: Differentially expressed genes and performance ofclassifier.ClassifierClinical groupsColonPrimary vs. metastasisNo. ofcases7/7Lymph node Primary vs. metastasis5/5AdrenalglandPrimary vs. metastasis3/3LungPrimary vs. metastasis2/2All casesPrimary vs. metastasis17/17LungNM vs. lung metastasis10/12ColonNM vs. colon metastasis10/7Lymph node NM vs. lymph nodemetastasis10/5p-valuea FDRb 0.001 0.01 0.001 0.01 0.00111 0.983 0.983NA c 0.01 0.001 0.01 0.001 0.01 0.001 0.01 0.001 0.01 0.0010.916NA1NA1 0.064 0.124 0.001 0.065 0.024 0.01 0.094No. ofgenes280138725407301783Parametric p-value for two-sided t-test. b False Discovery Rate (FDR); bold indicates significant FDR values at FDR 0.1 (10%). c NA: not available.aIdentification of metastasis-related genesacross tissue types.To further search for metastasis-related genes,we compared gene expression profiles of primarycolorectal carcinomas (gastrointestinal metastasis:GIM) and paired synchronous liver metastases usingpairwise class comparison even when increasing statistical power by comparing all primary liver andcolorectal tumor samples (PEM GIM) to their pairedmetastasis (Table 1), indicating that these primarycarcinomas and their paired metastasis are transcriptomically similar. Taken together, our resultsindicate that primary colorectal or liver carcinomashttp://www.ijbs.com
Int. J. Biol. Sci. 2015, Vol. 11and their paired synchronous metastasis do not exhibit any significant transcriptomic differences. Theseresults reinforce the hypothesis that the ability tometastasize is inherent to the primary tumor andmetastasis should be compared to non-metastatictumors.In contrast to a minimum difference amongprimary and paired metastatic lesions, class comparison of non-metastatic liver cancers (NM) to thosewith lung metastases or lymph node metastasis resulted in 369 and 1011 significant probes sets, whichcorrespond to 280 and 730 genes, respectively. In addition, liver metastases of colorectal carcinomas differed in 2002 probe sets to NM which represent 138792genes (p 0.001; Supplementary Material: Table S2).However, the identified differential gene sets exhibited a small overlap of only 14 genes, suggesting thatmost genes are tumor type and organ site-specific(Figure 1D; Supplementary Material: Table S2). Mostof the 14 genes’ function is related to metabolism(5/14 or 36%). Three of the genes are involved in proliferation, while 3 others are related to cell-cell orcell-matrix interaction and the remaining genes haveroles in fibrosis, autoimmunity and histone modification. Taken together, it appears that the metastaticgenes of different organ-specific metastases are distinct.Figure 1: Gene expression analysis of colorectal and liver carcinoma and metastases. (A) Colorectal tumors and paired metastasis to the liver are indicated in pink.Liver carcinoma with metastasis to the lymph node and to the lung are depicted in green and yellow, respectively. (B) Representative images of laser capture microdissection(LCM) of a primary cholangiocarcinoma before (top panel) and after LCM (bottom panel) of a case with lymph node metastasis (PEM-02A). In green are two areas selected forLCM. (C) Unsupervised clustering of 61 primary and metastatic clinical tumor specimens analyzed by gene expression microarrays. Colorectal carcinomas (GIM), liver carcinomas (PEM) with metastasis to the lymph node or the lung, non-metastatic liver carcinomas (NM) and normal liver (NL) are indicated. Paired tumor-metastasis samples whichcluster next to each other are indicated with black dots and samples which do not cluster together with red arrows. (D) Overlap of gene lists resulting from comparison ofnon-metastatic (NM) cancer to lung metastases, to lymph node metastases and to liver metastasis of colorectal carcinoma. (E) In this study, 17 liver and colorectal carcinomaswith their respective paired metastasis have been used to perform gene expression analysis of LCM-enrich tumor epithelium and to measure somatic copy number alterations(SCNA). The data obtained was subsequently used for integrative comparison of primary carcinoma and paired metastasis.http://www.ijbs.com
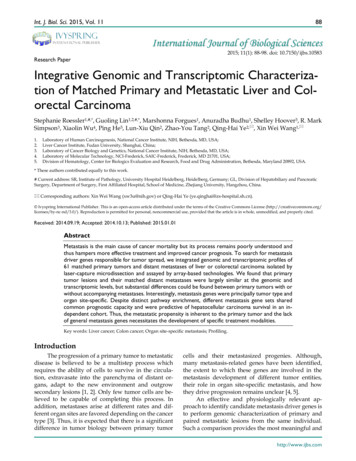
Int. J. Biol. Sci. 2015, Vol. 11Somatic copy number alterations in primarytumors and metastases.Since genomic alterations have been implicatedin metastasis, we performed an integrative analysis ofgenomic and transcriptomic profiling in order toidentify metastasis driver genes (Figure 1E). To determine genomic differences between primary tumorsand distant metastases, we analyzed the somatic copynumber alteration (SCNA) profiles by array-basedcomparative genomic hybridization (arrayCGH). Weonly included cases with fresh frozen metastatic tissues available which left us with 34 clinical specimensof 7 colorectal carcinoma and 10 liver cancer patients.The comparison of primary and metastatic liver tumors showed that both exhibit differences in theirSCNA profiles (Figure 2A and B). In addition, colorectal tumors showed few SCNAs and similarly toliver, colorectal tumors and paired liver metastasisthey exhibited differences in their SCNA profiles(Figure 2C and D). Unsupervised hierarchical clus-93tering of the genomic alterations revealed that all 7primary and paired metastatic colorectal carcinomapairs each clustered together, whereas, only 5 out of10 liver carcinoma pairs clustered adjacent to eachother (Figure 3A). Next, we analyzed the mean number of SCNAs per sample which was comparable withprevious studies (Figure 3B) [17]. Thus, liver tumorsappeared to have accumulated more genomic aberrations than colorectal tumors. Although not significant,there was a trend of more SCNAs in liver carcinomawith paired extrahepatic metastasis (PEM) than colorectal carcinoma with matched metastases to the liver(GIM). We calculated the difference of SCNA countsin primary versus metastatic tissue pairs for each patient. Consistent with the clustering results (Figure3A), the difference of SCNA counts in primary versusmetastatic tissue pairs was larger in PEM specimensthan in GIM specimens (t-test p 0.044; Figure 3C).This suggests that the genomic instability is higher inPEM than in GIM.Figure 2: Frequencies of significant aberration in SCNAs of gain and loss areas in gastrointestinal and liver carcinoma. (A) Frequencies of significant SCNAsare plotted as a function of genome location for 10 primary liver cancer cases. Positive values indicate frequencies of samples showing copy number increases, shown in red, andnegative values indicate frequencies of samples showing copy number decreases, shown in green. Chromosome boundaries and centromere position are indicated by verticalsolid and dashed lines, respectively. (B) Frequencies of SCNAs in the corresponding distant metastases of these 10 liver cancer cases. (C and D) Frequencies of significantSCNAs of 7 primary colorectal cancer and 7 paired colorectal metastases to the liver are plotted as a function of genome location, respectively. Horizontal dashed blue linesindicate frequency of and -0.2.http://www.ijbs.com
Int. J. Biol. Sci. 2015, Vol. 1194Figure 3: Distinct patterns and frequencies of significant aberration in SCNA profiles in primary and metastatic gastrointestinal (GIM) and liver carcinoma (PEM). (A) Unsupervised clustering of SCNA profiles of 17 paired primary and metastatic tumor specimens is shown. Paired tumor-metastasis samples are indicated withblack dots and un-paired samples with red arrows. Colorectal carcinomas with liver metastasis (GIM), liver carcinomas (PEM) with lung metastasis and metastasis to the lymphnode are shown in pink, yellow and green respectively. (B) Mean number of deletions and amplifications per sample type are shown for primary (P) and metastatic (M) tissues ofcolorectal (GIM) and liver carcinoma patients (PEM). Mean deletion counts are displayed as grey and amplification counts as black bars, respectively. (C) Difference of SCNAcounts in primary versus metastatic tissue pairs for GIM and PEM. (D and E) Differences (y axis) between frequencies of gain (D) and loss (E), respectively, across the genome forGIM versus PEM cases. SCNA frequencies are plotted as a function of positioned location in the genome with positive values indicating higher frequencies in GIM versus PEM.Comparison of SCNA frequency in GIM andPEM samples showed that the gained and lost regionsdiffer by up to 60% (Figure 3D and E). Chromosome1q, 8q and 17q gain and loss of large regions ofchromosomes 3p, 4q, 9p, 13q, 16q and 21 were mainlyassociated with liver carcinoma, whereas gain of 13qand loss of 18 were most prevalent in colorectal carcinoma. The statistical analysis of SCNAs showed that14 gain regions and 27 loss regions are significantlydifferent between GIM and PEM (SupplementaryMaterial: Table S3). Further analysis revealed thatmost of the loss (13/14) and gain regions (22/27) havea higher frequency of aberration in PEM than GIM.Thus, colorectal and liver tumors have specific genomic aberration profiles. In addition, primary tumors and matched metastases display some genomicdifferences, which indicate genomic instability incontrast to the transcriptomic profiles that do notshow any significant differences.http://www.ijbs.com
Int. J. Biol. Sci. 2015, Vol. 11Integration of gene expression profiling withsomatic copy number alterationsTo identify potential cancer driver genes, wesought to integrate SCNA with gene expression profiling by performing correlation analysis, a strategysuccessfully used previously [13, 18]. Gene expressionprofiles of 7 primary colorectal cancer cases withpaired metastasis and for 10 primary liver cancers and9 paired metastases were available (N 33; PEM-11Mgene expression microarray failed the quality control).We applied Pearson or Spearman correlation analysisof the gene expression and SCNA profiles for eachgene of the 33 specimens and compared the resultingdensity distribution to the random distribution (Figure 4A and B). We found that 3,593 out of 12,714 genes(28.26%) of the Pearson correlation and 3,566 out of12,714 genes (28.05%) of the Spearman distributionfell into the 95th percentile of the corresponding random distribution. Thus, Pearson and Spearman correlation performed similarly and about 28% of genesshowed correlation between SCNA and gene expression and therefore are potential cancer driver genes.Distinct regulatory pathways are enriched inorgan site-specific metastasisDue to the small overlap of metastasis genes ofonly 14 genes, we further analyzed the organsite-specific metastasis genes to determine their functional networks. We therefore focused on the organsite-specific genes after integration of gene expressionprofiling with somatic copy number alteration. Forty-nine (21.3%) of the 230 lung metastasis-specificgenes showed significant correlation which corre-95sponds to 52 probe sets (Supplementary Material:Table S4). We found that 66 (22.5%; 81 correspondingprobe sets; Supplementary Material: Table S5) out of293 lymph node-specific genes displayed correlationand 203 (21.3%; 256 corresponding probe sets; Supplementary Material: Table S6) genes of the 952 colorectal liver metastasis-specific genes showed significant correlation. We performed Ingenuity PathwayAnalysis (IPA) of the respective corresponding probesets and the associated fold change as input andfound that the top 5 canonical pathways differedgreatly. The top 2 pathways obtained from IPA forlymph node metastasis genes (Mevalonate Pathwayand Geranylger
MO) and subsequent Phenol/Chlororform extraction. Purified DNA was quantified by the fluorometric assay Quant-iT Pico Green dsDNA (Invitrogen, Carlsbad, CA). ArrayCGH Human-Genome-CGH- 105A Oligo Microarrays G4412A were carried out according to the manufacturer's instructions (Agilent, Santa Clara, CA). Five micrograms of genomic DNA