Transcription
FORECAST PROCESS IMPROVEMENT LESSONS FROM SUCCESSFUL COMPANIESTHE VALUE OF INFORMATION SHARING INTHE RETAIL SUPPLY CHAIN: TWO CASE STUDIESTonya Boone and Ram GaneshanPREVIEWRetail supply chains are complex, with eachcompany in the chain having multiple echelonsof distribution. Forecasting and requirementsplanning are further challenged by managers’reliance on “local” rather than chain-wide retaildemand to make key operational decisions. Afrequent consequence is the bullwhip effect .Using two case studies, Tonya and Ram show howinformation sharing – both within the company’sboundaries and with external partners – canmitigate the bullwhip effect and reduce supplychain costs.the retail level. Each individual company in the supplychain forecasts its demand, plans its stocking levels,and makes its replenishment decisions independent ofthe other companies.retail supply chain is a network of firms,activities, organizations, and technologies.The network procures raw material fromvendors, transforms the materials intointermediate and finished product, and distributesfinished product to retail outlets. Many retail supplychains are complex, with companies in the supplychain having multiple echelons of distribution.It is typical to see retail distribution centers (DCs)forecasting store shipments, and then ordering fromthe manufacturer based on these forecasted needs.Meanwhile, the manufacturer stocks its DC based on itsown forecasts of retail requirements. Such independentforecasting by members in the supply chain gives riseto what is called the bullwhip effect, which refers tothe increased volatility in orders as these propagatethrough the supply chain. The inherent volatilityin orders makes forecasting more difficult, leads tounwarranted increases in inventory throughout thesupply chain, and results in inefficient use of workingcapital and production capacity. Further, products thathave volatile demand at the customer level face theadded risk of higher stock-outs.In a multitiered supply chain, decisions are often basedon “local” information, rather than actual demand atThe bullwhip effect originally was named by plannersat Procter and Gamble (P&G) who coined the termAINTRODUCTION: THE “BULLWHIP” EFFECTTonya Boone is an Associate Professor of Operations & Information Technology at the Mason School of Businessat the College of William & Mary. Tonya’s research concentrates on the areas of sustainable supply chains andmanaging knowledge organizations. She is the editor of the book New Directions of Supply Chain Management:Technology, Strategy, and Implementation.Ram Ganeshan is an Associate Professor and Area Chair of Operations & Information Technology Group atthe Mason School of Business at the College of William & Mary. Ram’s primary research focus is on designingand managing effective supply chains. In 2001, he was awarded the Wickham Skinner Early Career prize forhis research on supply-chain management. He is coeditor of the book Quantitative Models for Supply ChainManagement.12FORESIGHT Issue 9 Spring 2008
after observing erratic swings in orders and inventoryfor their Pampers disposable diapers. Although theretail demand for the Pampers brand was fairlyconstant, retailers were changing their forecasts basedon their own idiosyncratic planning processes. Some,for example, were adjusting forecasts for promotionsor perceived requirements. These adjustments weresending a distorted signal of actual retail demand upthe chain. Wholesalers based their planning on thesesignals, which amplified the errors in demand forecastswhen they placed their wholesale orders with themanufacturer. It was as if demand was responding tothe crack of a whip.P&G also discovered that its own orders to materialsuppliers, such as 3M, followed a similar pattern: wildfluctuations in orders that bore little resemblance to theactual demand for diapers (Siems, 2005). The bullwhipphenomenon is reminiscent of the children’s game of“Telephone,” where each successive participant passesalong a message by whispering it to the next person,with the result that the final message bears little or noresemblance to the original one.Lee et al. (1997) enumerate the key causes of theproblem:(i) Each member of the supply chain is independentlyupdating forecasts;(ii) Pricing and promotions occur at all levels in thesupply chain;(iii) Companies place orders in batches; and(iv) There may be special order requirements (such asminimum order quantities or rationing) of each of themembers in the chain.In many industries, firms have taken steps to mitigatethe bullwhip effect. One initiative was to integrate acompany’s internal information repositories, bringingall relevant forecast and transactional information intoa central location. Another was information integrationamong the external partners in the supply chain.KEY POINTS Independent forecasting by members inthe supply chain gives rise to the bullwhipeffect, which refers to the increasedvolatility in orders as these propagatethrough the supply chain. To mitigate the bullwhip effect, firms cancreate centralized information repositoriesthat provide internal (within the firm) andexternal (among supply-chain partners)information visibility. The first case study illustrates how amidsize retailer invested in merchandisingtechnology that centralized its internalinformation, enabling it to reformulate itsbuying process and to streamline supplychain operations. The second case study shows howsharing information with external partnersusing initiatives such as CollaborativePlanning, Forecasting, and Replenishment(CPFR) will better match supply to retaildemand and improve working-capitalefficiency.VMI, CRP, AND CPFRApproaches to information visibility are many, andthey differ from company to company, even within thesame industry. In the consumer-products industry, inaddition to using electronic data interchange (EDI)for order transmission, firms have initiated vendormanaged inventories (VMI). In this system, the supplierof the product keeps track of the retail inventories, andreplenishes the retail stocks as needed.Barilla SpA, a pasta manufacturer, gathered inventoryinformation at the distributor’s location and replenished distributor inventories based on targets it had setfor the distributors. Within weeks of implementation,inventory in their Marchese DC decreased by 16.7%while increasing the service level from around 93% toalmost 100% (Hammond, 1995). In the grocery industry, where the process is called continuous replenishment planning (CRP), Campbell’s Soup replenishes itsretailers to match the rate at which customers buy itssoups off the shelves.Spring 2008 Issue 9 FORESIGHT13
While many VMI or CRP-like initiatives have resultedin significant improvements in retail operations, theyare “passive”: firms in the partnership share dataand transfer the responsibility of forecasting and/or replenishment to the supplier. In contrast, someretailers have turned to a more proactive collaborationinitiative, called collaborative planning, forecasting,and replenishment (CPFR). The distinguishing featureof CPFR is that members of the retail supply chaincollaborate on business plans, and jointly execute theprocesses of forecasting and replenishment.CPFR was the brainchild of the Voluntary Interindustry Commerce Standards (VICS) association, anonprofit formed in 1986 to develop standards andguidelines for improving supply-chain efficiency.VICS membership includes major retailers, like WalMart, and manufacturers, like P&G. VICS’ “CPFRcommittee” offers detailed guidelines (see cpfr.org) onhow members of a retail supply chain can collaborateto improve efficiency. The guidelines are based onstandard technologies and are scalable, enabling readyimplementation across different industries.We now present two case studies. The first illustratesthe benefits from information centralization, while thesecond outlines a successful CPFR initiative. In the firstcase, a midsize retailer is able to centralize information and reorganize supply-chain operations, gainingefficiencies in procurement, distribution, and replenishment. The second case is a simulation of the CPFR14FORESIGHT Issue 9 Spring 2008process in a retail supply chain. Both cases reveal howtransparency of information can reduce the bullwhipeffect and improve working-capital efficiency.CASE STUDY 1 – THE VALUE OFINTERNAL INFORMATION VISIBILITYThis retailer is small to midsized, with annual salesjust under 1 billion. It operates in more than twentylocations, each location having multiple retail outlets.Depending on location, the retail outlets are departmentstores, mass-merchandisers, or convenience stores.Corporate headquarters sets overall financial goalsand merchandising policies, coordinates resourcesacross retail locations, and maintains responsibilityfor financial reporting. The Chief Operating Officer,located at the corporate headquarters, overseesoperations for the entire retail organization.Traditionally, however, each retail location has operated independently, making forecasting, buying, replenishment, and distribution decisions locally. A RetailManager at each location is responsible for the operations of all the outlets in that area. Reporting to theRetail Manager is a team of buyers and merchandisingmanagers who plan assortments, forecast needs, andmake replenishment decisions for their product categories. Based on inventory levels and outstanding orders,each buyer places orders (via phone, fax, or electronically) to the vendors. The vendors ship these items toan area distribution center, where they are unloaded,manually checked for errors, ticketed, and stocked instorage bays. Finally, the product is moved to the storefront to be sold.The buyers use a legacy merchandising system togenerate orders, and the receivers use this system tounload, check, and transfer product to the store. Whilepoint-of-sale scanners tracked sales at the retail level,no such technology was being used in the ordering andreceiving processes, making storage and retrieval ofdata and tracking of store and warehouse inventory acumbersome manual task.
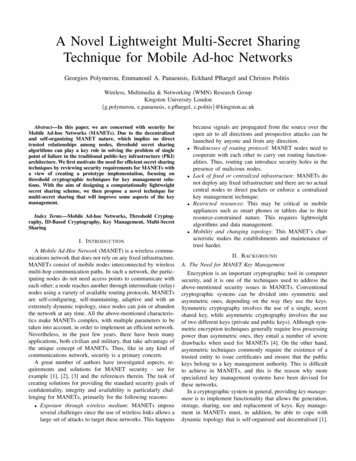
Figure 1. Supply Chain Costs Before and After Information Visibility(a) LOCATION X(b) LOCATION YSavings 32.79%Savings erInventoryHandlingThen this retailer adopted a state-of-the-artmerchandising system in an effort to increaseefficiency in its supply chain. The retailer installed128-bit scanners that capture the product bar codesas a transaction occurs (the products are tagged byvendors). Now all transactions – receiving product intoDCs, moving them to the store, and the actual sale atthe store – could be retrieved at corporate headquarterseasily, securely, and accurately. The system had createdinformation visibility by integrating sales data from allretail locations into a single database.Figure 1(a) and (b) shows the impact of informationvisibility on yearly supply-chain costs at the retailer’stwo biggest locations, X and Y. The overall cost savingwas estimated at 33% at Location X and 15% atLocation Y.Leveraging this new information visibility, the retailerwas able to move its buyers to corporate headquarters.Planning could now be centralized, but continued tobe based on “local” information. Each location stillretained buyers for items unique to that location.While centralizing the buying function reduced thenumber of buyers at Location X, it resulted in a 10%StorageBeforeAfterNOTE: Costs are disguised butrelative magnitude is preserved.increase in ordering costs for Location Y; nevertheless,the retailer reaped a net saving on order-processingcosts. Central buying also enabled more efficientplanning: buyers now observe product turns in realtime, and hence make better assortment decisions.Since products from vendors are now scanned, the DCs’receiving operations could be streamlined, providingup to a 34% savings in handling costs for LocationX and 27% for Location Y. The bar codes enabledcorporate headquarters to track inventory accurately,reducing shrinkage costs by 6% at Location X and 4%at Location Y.CASE STUDY 2 – EXTERNAL INFORMATIONVISIBILITY: THE CPFR ADVANTAGEThis second case study illustrates the benefits ofinformation sharing and visibility across the differentcompanies in a retail supply chain. Using data on a fastmoving consumer-goods product, we simulated productflows through the supply chain. (For those interested,specific details are available from the authors.)While information sharing can take several forms, ourfocus here is on CPFR, and specifically its forecastingcomponent. The key lesson is this: simple changes inthe location or management of the forecasting functionSpring 2008 Issue 9 FORESIGHT15
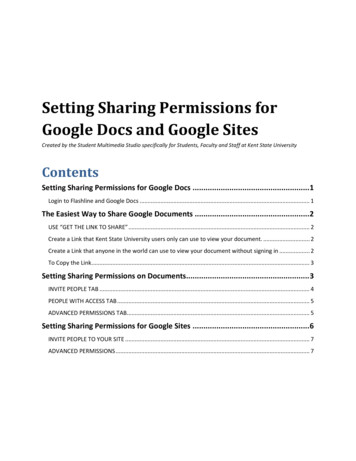
Figure 2. Actual Versus Forecasted Needs at Retail DC “D” and Manufacturing DC “M”7,000,0005,250,000Average error at “M” 45% of mean retail demand3,500,0001,750,000Average error at “D” 17% of mean retail demand012345678910 11 12 13TIMERetail DC “D” Actual NeedsRetail DC “D” ForecastManufacturing DC “M” Actual NeedsManufacturing DC “M” Forecastcan produce substantial improvements in working-capital efficiency, even with the same forecasting tools.M) for the next 13 periods. These requirements arecurrently being forecast by the manufacturing DC.For this CPFR illustration, we have deliberately chosena product whose sales are predictable with relativelylow errors. We consider this product to be “internallysaturated,” in that planners have honed the forecasts overtime to such levels that new forecasting tools will notsignificantly alter the forecasts. Demand for this productis seasonal, and it is sold through mass-merchandisingand grocery channels. The product is manufactured atLocation M, stored in a DC close to the manufacturingplant, and distributed through six retail DCs – LocationsA through F – to more than 60 retail outlets.Based on our simulations of activity at this manufacturing DC, we calculated that the forecast errors forthis product averaged 8% for the DC but exploded to45% as the product worked its way through the supplychain to final sale. This is the bullwhip effect in action:the independent forecasts were “locally” good, but theamplification in errors results in a poor forecast for theoverall retail supply chain.Figure 2 shows a sample of actual and forecastedshipments over a 13-period (rolling) planning horizonat retail DC Location D. The forecasts have accuratelycaptured the trend and seasonality in sales, leaving anaverage error of 17%. Based on forecast errors, safetystock targets and shipment plans were computed for theplanning horizon. The average beginning inventory atLocation D (i.e., the planned inventory to meet safetystock needs) was 383,458 pounds.In each retail DC, planned shipments are offset by theshipment lead-times, and aggregated to arrive at theshipping needs of the manufacturing DC (Location16FORESIGHT Issue 9 Spring 2008If this company institutes a CPFR process, the sixDCs will have visibility into store sales data andstore planning calendars (such as promotions andstore openings), either by POS data directly or viatechnologies that give DC planners direct access toactual or anticipated store inventory positions. Themanufacturing DC, meanwhile, will have completeinformation about the retail DC inventories.The difference here is that the retail DCs and themanufacturing DC will no longer have to forecastdemand independently. Instead, the manufacturer andretailer will collaboratively determine the forecasts andagree to a distribution plan to meet demand at the retailoutlets (complete information visibility).
Table 1. Supply Chain Inventory Comparison@ RETAIL DC LOCATIONSABCDEFTotal Retail DC 51117,9071,171,470WITH ,160Manufacturing DC Location M1,982,8901,806,925Total Supply Chain Inventory3,154,3602,872,085Table 1 shows a comparison of the inventory levelspre- and post-CPFR. The total supply-chain inventorywhen CPFR is used is 2,872,085, an 8.95% decrease ininventory, while maintaining the same level of customerservice, and realizing an estimated savings of almost halfa million dollars a year for this product. The reductionin inventory is achieved through information visibility:since both the retail and the manufacturing DC are awareof the actual requirements through time, they can holdless in safety or buffer inventory. The remaining safetyinventories typically cover uncertainties other thanforecast errors – such as weather and transportationdelays and other unforeseen contingencies to maintainthe appropriate level of customer service.This illustrative simulation has only focused on theinventory savings. CPFR also improves efficiencies intransportation management (by efficient load planning),capacity and production scheduling (by producing onlywhen needed), and long-term flexibility of the supplychain (by responding faster to the customer).IMPLEMENTATION COSTS AND GUIDELINESWhile we have focused on the benefits of informationvisibility, it must be said that there are investment costsrequired to implement new information systems, andthese costs are often significant. The retailer in thefirst case study had to invest in the merchandisingsystem and upgrade its technology to modern 128bit scanners. The implementation took severalemployee-months. While the benefits of integrationfar outweighed the costs for this particular retailer, oneneeds to have proper cost controls. The reorganizationof the buying function entailed layoffs and altered jobdescriptions, as well.External information integration is even morechallenging, since it encompasses different entitiesand organizational cultures. VICS offers a 5-step setof guidelines for adoption of CPFR (collated frominformation in cpfr.org):(i) Create a front-end agreement on objectives;(ii) Develop a business plan that spells out forecastingneeds, production schedules, and key performancemetrics;(iii) Create a joint forecast that is linked to an eventcalendar that tracks pricing, promotions, and otherrelevant information;(iv) Agree on replenishment strategies;and, finally,(v) Agree on a technology partner to bring CPFRto fruition.Meeting these guidelines requires trust, flexibility,and leadership. It is our contention that the benefitsof information visibility will be worth the costs insystems set-up.REFERENCESHammond, J. (1995). Barilla SpA (A)-(D), Harvard BusinessSchool case #9-694-046, Harvard Business School Publishing,Boston, MA.Lee, H., Padmanabhan, V. & Whang, S. (1997). The bullwhip effect in supply chains, Sloan Management Review, 38, 3, 93-102.Siems, T. F. (2005). Supply chain management: The science of better, faster, cheaper, Southwest Economy, Issue 2, March/April, 6-12.Acknowledgement: We would like to thank Professor Roy L.Pearson, Chancellor Emeritus Professor of Business at the College of William & Mary, for his insightful comments on earlierversions of this paper.CONTACTTonya Boone and Ram GaneshanCollege of William & MaryRam.Ganeshan@mason.wm.eduSpring 2008 Issue 9 FORESIGHT17
Traditionally, however, each retail location has operat-ed independently, making forecasting, buying, replen-ishment, and distribution decisions locally. A Retail Manager at each location is responsible for the opera-tions of all the outlets in that area. Reporting to the Retail Manager is a team of buyers and merchandising