Transcription
DOI: 10.1007/s002670010258Modeling Urban Growth Effects on Surface Runoffwith the Integration of Remote Sensing and GISQIHAO WENG*Department of Geography, Geology, and AnthropologyIndiana State UniversityTerre Haute, IN 47809, USAABSTRACT / A methodology is developed to relate urbangrowth studies to distributed hydrological modeling using anintegrated approach of remote sensing and GIS. This linkageis possible because both studies share land-use and landcover data. Landsat Thematic Mapper data are utilized to detect urban land-cover changes. GIS analyses are then conducted to examine the changing spatial patterns of urbangrowth. The integration of remote sensing and GIS is appliedto automate the estimation of surface runoff based on the SoilLand-use and land-cover changes may have four major direct impacts on the hydrological cycle and waterquality: they can cause floods, droughts, and changes inriver and groundwater regimes, and they can affectwater quality (Rogers 1994). In addition to these directimpacts, there are also indirect impacts on climate andthe subsequent impact of the altered climate on thewaters. Urbanization, the conversion of other types ofland to uses associated with the growth of populationand economy, is a significant land-use and land-coverchange especially in recent human history. The processof urbanization has a considerable hydrological impactin terms of influencing the nature of runoff and otherhydrological characteristics, delivering pollutants to rivers, and controlling rates of erosion (Goudie 1990).At different stages of urban growth, various impactscan be observed (Kibler 1982). In the early stage ofurbanization, removal of trees and vegetation may decrease evapotranspiration and interception and increase stream sedimentation. Later, when constructionof houses, streets, and culverts begins, the impacts mayinclude decreased infiltration, lowered groundwater table, increased storm flows, and decreased base flowsduring dry periods. After the development of residential and commercial buildings has been completed,increased imperviousness will reduce the time of runKEY WORDS: Remote sensing–GIS integration; Urban growth; Surfacerunoff; Zhujiang Delta; China*e-mail: geweng@scifac.indstate.eduEnvironmental Management Vol. 28, No. 6, pp. 737–748Conservation Service model. Impacts of urban growth on surface runoff and the rainfall–runoff relationship are examined bylinking the two modeling results with spatial analysis techniques. This methodology is applied to the Zhujiang Delta ofsouthern China, where dramatic urban growth has occurredover the past two decades, and the rampant urban growthhas created severe problems in water resources management. The results revealed a notably uneven spatial pattern ofurban growth and an increase of 8.10 mm in annual runoffdepth during the 1989 –1997 period. An area that experiencedmore urban growth had a greater potential for increasing annual surface runoff. Highly urbanized areas were more proneto flooding. Urbanization lowered potential maximum storage,and thus increased runoff coefficient values.off, concentration so that peak discharges are higherand occur sooner after rainfall starts in basins. Thevolume of runoff and flood damage potential willgreatly increase. Moreover, the installation of sewersand storm drains accelerates runoff (Goudie 1990). Asa result, the rainfall–runoff process in an urban areatends to be quite different from that in natural conditions depicted in classical hydrological cycles. This effect of urbanization, however, varies according to thesize of a flood. As the size of the flood becomes largerand its recurrence interval increases, the effect of urbanization decreases (Hollis 1975).The integration of remote sensing (RS) and geographic information systems (GIS) has been widely applied and has been recognized as a powerful and effective tool in detecting urban growth (Ehlers and others1990, Treitz and others 1992, Harris and Ventura 1995,Yeh and Li 1996, 1997). Remote sensing collects multispectral, multiresolution, and multitemporal data,and turns them into information valuable for understanding and monitoring urban land processes and forbuilding urban land-cover data sets. GIS technologyprovides a flexible environment for entering, analyzing,and displaying digital data from various sources necessary for urban feature identification, change detection,and database development. In hydrological and watershed modeling, remotely sensed data are found to bevaluable for providing cost-effective data input and forestimating model parameters (Engman and Gurney1991, Drayton and others 1992, Mattikalli and others1996). The introduction of GIS to the field makes it 2001 Springer-Verlag New York Inc.
738Q. Wengpossible for computer systems to handle the spatialnature of hydrological parameters. The hydrologicalcommunity now increasingly adopts GIS-based distributed modeling approaches (Berry and Sailor 1987,Drayton and others 1992, Mattikalli and others 1996).However, no attempt has been made to relate urbangrowth studies to distributed hydrological modeling,although both studies share land-use and land-coverdata. This is especially true in applying an integratedapproach of remote sensing and GIS to developingcountries such as China.This paper attempts to develop an integrated approach to remote sensing and GIS to examine theeffects of urban growth on surface runoff at the locallevel. Using the Zhujiang Delta of South China between1989 and 1997 as a case study, the specific objectives ofthis paper are: (1) to detect urban land-cover changesusing satellite remote sensing and GIS and to studyspatial patterns of urban growth; (2) to examine theeffect of such urban growth on surface runoff; and (3)to evaluate the impact of urban growth on rainfall–runoff relationship.Distributed Surface Runoff ModelThe model used for estimating surface runoff in thisstudy was developed by the United States Soil Conservation Service (SCS). It has been widely applied toestimate storm runoff depth for every patch within awatershed based on runoff curve numbers (CN)(USDA 1972). The SCS equation for storm runoffdepth is mathematically expressed as:Q 共P 0.2S兲 2共P 0.8S兲(1)where: Q is storm runoff; P is rainfall; S is potentialmaximum storage, and S (1000/CN) 10; CN isrunoff curve number of hydrologic soil group–landcover complex.To solve this equation, two input values are necessary: P and CN. Precipitation data are often availablefrom meteorological observations. A runoff curve number is a quantitative description of land cover and soilconditions that affect the runoff process. The CN valuesare normally estimated using field survey data withreference to USDA’s SCS tables (Table 1). From Table1, it is apparent that CN values approaching 100 areassociated with high runoff from cultivated agriculturalland, whereas low to moderate CN values indicate thereduced runoff from heavily vegetated areas (Slack andWelch 1980). A hydrological soil group code A, B, C, orD was set up by the SCS for over 4000 soils in the UnitedStates based on permeability and infiltration characteristics. Group A soils are coarse, sandy, well-drained soils,with the highest rate of infiltration and the lowestpotential for runoff. Group D soils, on the other hand,are heavy, clayey, poorly drained soils, with the lowestrate of infiltration and highest potential for runoff.Group B and C soils are intermediate between groups Aand D.Since the availability of Landsat data in the 1970s,several attempts have been made to use these satellitedata to determine CNs because of the cost-effectivenature of these data. Mintzer and Askari (1980) employed Landsat MSS data, in combination with colorinfrared photography, to derive the runoff coefficientsfor the watersheds of Mill Creek in Ohio, USA, by usingpolynomial regression modeling. Ragan and Jackson(1980) compared the estimation of curve numbersfrom Landsat MSS with those from field surveys andfrom high-level aerial photography. It was suggestedthat there was no significant difference among thethree sources, but a modified curve number classification system compatible with Landsat data needs to beestablished. Slack and Welch (1980) conducted a similar study for the Little River watershed near Tifton,Georgia, USA. They generated four hydrologically important land classes: agricultural vegetation, forest, wetland, and bare ground from Landsat MSS data, andfound that curve numbers for six subwatersheds and forthe entire watershed were estimated within two curvenumber units. Rango and others (1983) claimed only a5% error in land-cover estimation by Landsat data atthe basin level, but a much greater error at the celllevel.The development and maturity of GIS technology inthe late 1980s have made it possible to combine variousdata sources for the derivation of model input parameters and have automated the SCS modeling process.Berry and Sailor (1987) used Map Analysis Package(MAP) to automate the procedures for estimating input parameters for Soil Conservation Service method ofpredicting storm runoff volume and lag to peak timing.Drayton and others (1992) used GIS to develop therunoff model for the Tywi catchment of West Wales,UK, based on a rectangular grid cell network. Theincorporation of topographic information allows themto further derive flow routing and to generate a hydrograph. Mattikalli and others (1996) conducted themodeling in a vector GIS environment using Arc/Info,and evaluated the effect of land use change on riverdischarge by comparing rainfall-runoff curves over timeand on water quality as indexed by nitrogen loading.
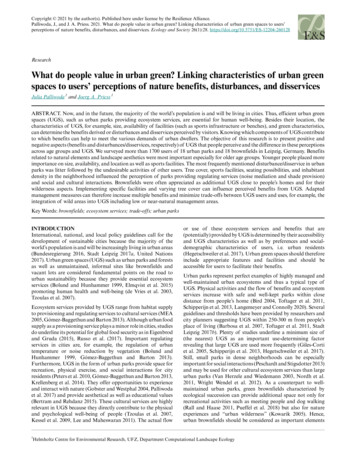
739Integrated GIS Approach to Urban Growth EffectsTable 1. Runoff curve numbers for hydrologic soil-cover complexes (USDA 1972) (antecedent moisture condition IIand Ia 0.2S)Land useFallowRow cropsCover treatment orpracticeStraight rowStraight rowContouredContoured and terracedSmall grainStraight rowContouredContoured and terracedClose seeded legumesa orrotation meadowStraight rowContouredContoured and terracedPasture or orFairGoodRunoff curve number for hydrologicsoil 8584828189858583838089848088837978837977Close drilled or broadcast.Study AreaThe study area, the Zhujiang (literally “the PearlRiver”) Delta, is located between latitudes 21 40 N and23 N, and longitudes 112 E and 113 20 E (Figure 1). Itis the third biggest river delta in China and has an areaof 17,200 sq km. Because of the constraints of satelliteimagery coverage, this research focuses on the corearea of the delta that includes the following 15 cities/counties shown in Figure 1. Geomorphologically, theZhujiang Delta consists of three subdeltas, the Xijiang(West River), Beijiang (North River), and Dongjiang(East River) Deltas, which originated approximately40,000 years ago (Department of Geography, Zhongshan University 1988). The process of sedimentationcontinues today, extending seaward at a rate of 40m/year (Gong and Chen 1964). The delta has a subtropical climate with an average annual temperature of21 –23 C, and an average precipitation of 1600 –2600mm. Because of the impact of the East Asian mon-soonal circulation, about 80% of the rainfall comes inthe period from April to September with a concentration in the months of May, June, and July, when thedelta is most prone to flooding (Ditu Chubanshe 1977).Another hazard is typhoons, which occur most frequently from June to October.The drainage system in the delta is well developed asa result of abundant rainfall. Of the total annual runoffof 341.2 billion m3, the Xijiang contributes the most(72.10%), followed by the Beijiang (14.13%), and theDongjiang (9.14%). The annual mean discharge forthe Xijiang ranges from 848 to 48,800 m3/sec; for theBeijiang, it ranges from 139 to 14,900 m3/sec, and forthe Dongjiang, it ranges from 31.4 to 12,800 m3/sec(Department of Geography, Zhongshan University,1988). The load discharge of the river system is large,with an annual total silt discharge of 83.36 million tons,of which the Xijiang is the major contributor (87%)(Huang and others 1982). About 20% of the silt dis-
740Q. WengFigure 1. Location of the study area.charge is deposited in the delta region while 80% enters the sea, thus causing a seaward extension in themouth region of the Zhujiang. The rivers of the systemarrive at the South China Sea through eight estuaries(“gates” in Chinese), namely, Humen, Jiaomen, Hongqili, Hengmen, Modaomen, Jitimen, Hutiaomen, andYamen from north to south. Perhaps the most distinguishing characteristic of the river system is its numerous tributaries. There are 100 main branches in thesystem, with a total length of over 1700 km. The drainage density in the Xijiang and the Beijiang deltas is 0.81km/sq km, and 0.88 km/sq km in the Dongjiang Delta.The average channel width– depth ratio is 1.8 to 11.5.However, 68% of all channels have a ratio of less than6.0, which indicates that most river channels in thedelta are stable. The average channel gradient in allmajor rivers is low: 0.0023% in the Xijiang, 0.0037% inthe Beijiang, and 0.026% in the Dongjiang.The Delta’s fertile alluvial deposits, in combinationwith the subtropical climate, make it one of the richestagricultural areas in China. A variety of crops, vegetation, cash crops, and fruit trees are the major agricultural products. Agricultural land accounts for almosthalf of the total area. Known as an ecologically wellintegrated agriculture–aquaculture system (Zhong1980; Ruddle and Zhong 1988), the dike-pond land is aunique landscape feature of the delta, accounting for4% of the area. Inside the delta, there are over 160 hillsand terraces located at heights of 100 –300 m above sealevel (Huang and others 1982). These hills and terracesare largely occupied by forest (28%) and grassland(15%) (Department of Geography, Zhongshan University 1988). Only a small portion of the land was urbanor built-up in 1978. However, urban growth has beenspeeded up due to accelerated economic developmentafter 1978, when the Chinese government initiated economic reform policies. Massive parcels of agriculturalland are disappearing each year for urban or related
Integrated GIS Approach to Urban Growth Effects741uses. Because of the lack of appropriate land-use planning and measures for sustainable development, rampant urban growth has created severe environmentalconsequences.Economically, the Zhujiang Delta is the largest areaof economic activity in South China. Hong Kong andMacau are located here. Since 1978, the delta has become very important due to its dramatic economicexpansion, and therefore has been regarded as a modelfor Chinese regional development. The establishmentof the Shenzhen and Zhuhai Special Economic Zonesin 1979 and the Zhujiang Delta Economic Open Zonein 1985 has stimulated Hong Kong and foreign firms tolocate their factories there as village-township enterprises. The labor-intensive industries, in associationwith the cash crop production have transformed thespatial economy of the delta (Lo 1989, Lin 1997, Weng1998).Integrated RS–GIS Approach to RunoffModelingIntegration of GIS and remote sensing (RS) in runoff modeling involves two processes: (1) hydrologicalparameter determination using GIS, and (2) hydrological modeling within GIS. Hydrological parameter determination using GIS entails preparing land-cover,soil, and precipitation data that go into the SCS model,while hydrological modeling within GIS automates theSCS modeling process using generic GIS functions.Remote sensing is used for obtaining land-cover dataeach year and for obtaining information about thenature, rate, and location of land-use and land-coverchanges. Urban growth analysis is then carried out bysuperimposing administrative boundaries on the landuse and land-cover change map. After a surface runoffimage is obtained from the hydrological modeling, thetechnique of image differencing is applied to evaluatethe changes in surface runoff over the time. The urbanexpansion map is overlaid with the runoff change mapto analyze the impact of land-use and land-coverchange on the environment. These methods and implementation procedures are elaborated belowHydrological Parameter Determination Using GISDerivation of land-cover data and change detection.Land-use and land-cover patterns for 1989 and 1997were mapped by the use of Landsat Thematic Mapperdata (dates: 13 December 1989 and 29 August 1997). Amodified version of the Anderson scheme of land use/cover classification that takes into account local conditions (Anderson and others 1976) has been adopted.Figure 2. The procedure for deriving land use/cover dataand change detection from satellite imagery.The categories include: (1) urban or built-up land, (2)barren land, (3) cropland, (4) horticulture farms, (5)dike-pond land, (6) forest, and (7) water. With the aidof Erdas Imagine computer software, each Landsat image was enhanced using linear contrast stretching andhistogram equalization to increase the volume of visibleinformation. All images are rectified to a common Universal Transverse Mercator (UTM) coordinate systembased on the 1:50,000 scale topographic maps ofGuangdong Province produced by the Chinese government. Each image was then radiometrically correctedusing a relative radiometric correction method (Jensen1996). A supervised classification with the maximumlikelihood algorithm was conducted to classify theLandsat images using bands 2 (green), 3 (red), and 4(near infrared). The accuracy of the classification wasverified by field checking or comparing with existingland-use and land-cover maps that had been fieldchecked. A typical implementation procedure for satellite image classification is shown in Figure 2.In performing land-use and land-cover change detection, a cross-tabulation detection method was employed. A change matrix was produced with the help ofErdas Imagine software. Quantitative areal data of theoverall land use/cover changes as well as gains andlosses in each category can be compiled. In order toanalyze the nature, rate, and location of urban landchange, an image of urban and built-up land was extracted from each original land cover image. The two
742Q. Wengextracted images were then overlaid and recoded toobtain an urban land cover change (growth) image.This urban growth image was further overlaid withseveral geographic reference images to help analyze thepatterns and processes of urban expansion, includingan image of the county/city boundary, major roads,and major urban centers. These layers were constructed in a vector GIS environment and convertedinto a raster format (grid size 30 m). The county/cityboundary image was utilized to find urban land changeinformation within each county/city.Derivation of soil data. The soil data are available in abook entitled “Soils of Guangdong” (Liu 1993), basedon results from the second national soils survey donebetween 1979 and 1990. The soil types were extractedfrom the 1:2,800,000 provincial soil map and digitizedinto a polygon coverage and registered to the UTMcoordinate system. Ten types of soils are found in thestudy area, which can be grouped into two major categories: (1) podzolized old and young red earths(39.17%), and (2) noncalcarcous alluvium and paddysoils (60.83%). The former is seen in the uplands withclay accumulation and low base supply known as Udultsin soil taxonomy (Soil Conservation Service 1975), andthe latter in the floodplains and deltas. Red earths arenormally permeable and well drained and can be related to class A or B in the hydrological soil group codesof the SCS classification. Paddy soils have been modified by intensive agricultural activities, and their hydrological properties are subject to human influences. Asthe fields were reclaimed from the sea at various periods of time, a distinction can be made according totheir distances from the sea (Lo and Pannell 1985).Inland fields, enclosed with irrigation dikes, were usually developed earlier than those found along the coastand are more fertile and higher yielding. The fieldsfound near the coast are susceptible to flooding, andtheir soils tend to be more saline and less suitable foragricultural purposes. The majority of the paddy soilsconsists of loam or silt loam and can be classified intohydrosoil group C. In most of Shunde County in thecentral delta, however, a much larger proportion ofclay may be found in the soils. These soils are groupedin the class D given their relative weak permeabilityand infiltration. The hydrological soil group codes(A, B–C, and D) were associated with each polygon inthe soil coverage. This coverage was converted into araster layer with a resolution of 30 m. After thevector-to-raster conversion, a 3 3 mode filter waspassed over the data layer to eliminate any “slivers”(Lo and Shipman 1990).Derivation of precipitation data. Rainfall data are available for all cities and counties of the delta in Guang-dong Statistical Yearbooks (Guangdong Statistical Bureau 1990, 1998) and Guangdong Province Gazetteerof Geography (Liu 1998). These rain gauges were usually located in the urban center of a county seat or a cityproper, and recorded continuous data from the early1950s. Daily, monthly, and yearly rainfall totals are available for every year. The gauge stations were digitizedand registered to the UTM coordinate system. A Theissen polygon coverage (in which two neighboring stations have an equal distance to the boundary) was builtusing Arc/Info (a vector GIS program) commands. Byassigning average yearly rainfall totals to each polygonin the coverage, a rainfall data layer was generated. Thedata layer was then converted into raster format with aresolution of 30 m.Hydrological Modeling within GISTo start modeling, a land cover image and the soillayer were combined and recoded to calibrate CN values with the aid of the standard SCS table (USDA1972); and a CN image was thus created. By using themap algebra function of the GIS, a potential maximumstorage (S) can be computed for each pixel. A layer ofpotential maximum storage was then created for eachyear. This layer was further overlaid with the rainfalllayer to create a runoff image (Figure 3).Image differencing was performed between the 1989and the 1997 runoff layers. The resulting differencingimage was reclassified into runoff change zones. Theareal extent and spatial occurrence of these zones werestudied in reference to the spatial patterns of urbangrowth in order to understand the effects of land-useand land-cover changes.Urban growth alters the relationship between rainfall and runoff through potential maximum storage. Anaverage value of potential maximum storage for eachcity/county was computed by superimposing city/county boundaries on a potential maximum storagelayer. Assuming uniform rainfall events from 10 to 100mm with an increment of 10 mm occurred in eachcity/county, runoff depths for these events can be calculated based on the SCS model: Q (P 0.2S)2/(P 0.8S). Runoff coefficients, defined as the ratio of runoffto rainfall, can also be computed for each event. Arunoff coefficient curve was constructed as a functionof the size of the flood. By comparing the curve in 1989and in 1997, the effect of urbanization can be examined, showing how it varies according to the size of theflood. By relating runoff coefficient curve patterns andchanges with urban growth patterns in each city/county, the effect of urbanization was further studied.
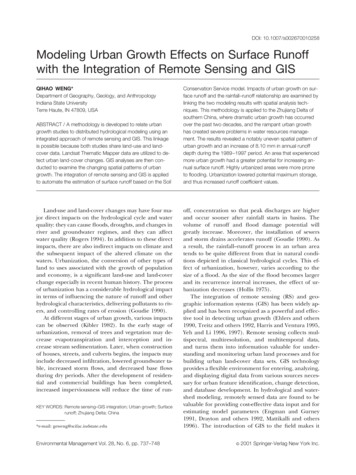
743Integrated GIS Approach to Urban Growth EffectsTable 2. Satellite-detected urban expansion in theZhujiang Delta, 1989 –1997Figure 3. The implementation procedure of GIS-based surface runoff modeling.Results and AnalysesUrban Growth in the Zhujiang DeltaThe RS-GIS analysis indicates that urban or built-upland has expanded by 47.68% percent (65,690 ha) inthe delta during 1989 –1997. Overlaying the 1989 and1997 land use/cover maps reveals that most urban orbuilt-up land increases were at the expense of cropland(37.92%) and horticulture farms (16.05%). The overlayof this map with a city/county map reveals the arealextent and spatial occurrence of urban expansionwithin administrative regions. Table 2 and Figure 4illustrate the result of this GIS overlay. It is shown thatin absolute terms the greatest urban expansion occurred in Dongguan ( 23478.90 ha), Bao’an( 14941.08 ha), Nanhai (8004.1 ha), and Zhuhai( 5869.71 ha). However, in percentage terms, the largest increase in urban or built-up land occurred in Zhuhai (1100.00%), followed by Shenzhen (306.65%),Bao’an (233.33%), and Dongguan (125.71%). Massiveurban sprawl in these areas can be ascribed to ruralUrban area(ha)ChangeCity/countyTotalarea 327.270.0024.001100.00areas urbanization of rural areas, a common phenomenon in postreform China. Rapid urban developmentin the form of small towns on the east side of the deltais highly influenced by investment from Hong Kong. Incontrast, the old cities, such as Guangzhou and Foshan,do not show a rapid increase in urban or built-up landbecause they have no land on which to expand further(as they have already expanded fully in the past) andbecause of the concentration of urban enterprises inthe city proper. Shenzhen and Zhuhai were designatedas Special Economic Zones at the same time, but thepace of urbanization in the two cities is quite different.Urban development in Shenzhen was mostly completedin the 1980s, while Zhuhai’s urban expansion appearedprimarily during the period of 1989 –1997 ( 5869.71ha).Impact of Urban Growth on Surface RunoffThe impacts of land-use and land-cover change onsurface runoff were examined by comparing predictedrunoff volumes in 1989 with those in 1997. The runoffimage of 1997 was subtracted from that of 1989. Theresulting image of change indicated that the annualrunoff volume had increased by 8.10 mm during the8-year period due to land-use and land-cover changes.This number refers to a uniform runoff depth for thewhole delta, and it has a standard deviation of 9.57 mm.To understand the spatial pattern of the surfacerunoff changes, the change image was reclassified intoten categories (Table 3). Each of these categories is aset of contiguous or discontinuous locations that exhibit the same value, and each is conventionally called
744Q. WengFigure 4. Urban growthamong cities in the ZhujiangDelta, 1989 –1997.Table 3.imageClass assignments of the runoff changeRunoff change valueRunoff zone 3.9 3.9 to 2.9 2.9 to 1.9 1.9 to 0.9 0.9 to 0.10.1 to 1.11.1 to 2.12.1 to 3.13.1 to 4.14.112345678910a zone in raster GIS. Zone 1 has the largest negativevalue ( 3.9 mm), indicating a decrease in runoffchange, while zone 10 has the largest positive value (4.1mm), indicating an increase in surface runoff. A visualinterpretation of the areal extent and spatial occurrence of these zones (Figure 5) implies a similaritybetween the urban expansion pattern and the spatialpattern created by aggregating zones 8 –10. These threezones have an increase in the value of surface runoffvolume ranging from 2.10 to 24.59 mm, occupying3.33% of the total area of the delta. By superimposinga city/county map onto these changed runoff zones,the percentages of the aggregated runoff zone in totalcity/county area were computed. A correlation analysiswas then carried out to examine the relationship between the distribution of the aggregated runoff zoneand that of urban expansion within each city andcounty. The result showed a relatively strong positivecorrelation between the two mapped patterns with amultiple r value of 0.67 (significant at the 0.05 level).This correlation suggests that the more urban growth acity or county experienced, the greater potential it hadto increase surface runoff.Impact of Urban Growth on Rainfall–RunoffRelationshipFigure 6 shows the runoff coefficient as a function ofrainfall from 10 to 100 mm in each city/county in1989 –1997. The cities/counties with greater urbangrowth, such as Shenzhen, Zhuhai, and Bao’an, have adistinctive curve for 1989 from that for 1997. In contrast, those cities/counties with less urban growth havetwo similar curves. This is particularly true in Zengeheng, Sanshui, Panyu, and Xinhui, where the twocurves are so similar that visual differentiation is nearlyimpossible. According to the SCS model, the rainfall–runoff relationship is controlled by potential maximumstorage. Therefore, the effect of urban growth on therelationship can be studied by relating the following
Integrated GIS Approach to Urban Growth Effects745Figure 5. Surface runoffchanges in the Zhujiang Delta,1989 –1997.two variables: changes in potential maximum storagevalue and urban growth rates (percentage of urbangrowth). A correlation analysis between them gives amultiple r value of 0.6 (significant at the 0.05 level).This result suggests that urban growth was a major contributor to the changes in potential maximum storageand thus in the relationship between rainfall and runoff.A city or county with a higher degree of urbanization(ratio of urbanized area to total area) has generally alower average value of potential maximum storage,
The integration of remote sensing and GIS is applied to automate the estimation of surface runoff based on the Soil . shed modeling, remotely sensed data are found to be valuable for providing cost-effective data input and for estimating model parameters (Engman and Gurney 1991, Drayton and others 1992, Mattikalli and others .