Transcription
2021 U.S. Department of EnergyVehicle Technologies OfficeAnnual Merit ReviewCOMPREHENSIVEVEHICLE TOTAL COSTOF OWNERSHIP (TCO)FRAMEWORKerhtjhtyhyDAVID GOHLKE (PRESENTING)Argonne National LaboratoryPROJECT ID: VAN038VTO Annual Merit ReviewJune 22, 2021This presentation does not contain any proprietary, confidential, or otherwise restricted information.
OverviewTimeline Barriers addressed Project start: October 1, 2019Project end: March 31, 2021100% complete (1.5 years)Budget “Fill gaps or deficiencies in the analysistoolset based on the best publiclyavailable, up to date techno-economicassessments.” (ISATT roadmap, 2018)Partners Total project funding: 510,000(100% DOE share)All funding from FY 2020 or forwardfunded from FY 2019No FY 2021 funding2Collaboration across several DOE labs: Lawrence Berkeley National Laboratory National Renewable Energy Laboratory Oak Ridge National Laboratory Sandia National Laboratories
RelevanceRelevance DOE VTO is interested in being able to compare economics of vehicle operationacross multiple technologies in a balanced manner In order to accurately compare the costs of two vehicles, the total cost of ownership (TCO)should consist of all costs related to both purchasing and operating the vehicle. This TCO analysis builds on previous work to provide a comprehensive, internallyconsistent perspective of all relevant vehicle costs of ownership for light-duty vehicles(LDV) and medium/heavy duty vehicles (MHDV). Data from this project is made public so that future researchers can build upon ourframework.3
Approach/StrategyApproach – GeneralDevelop framework forcalculating total cost ofownership based ondiscounted cash flowQuantify the Total Cost ofOwnership (TCO) and LevelizedCost of Driving (LCOD) forscenarios of interestIdentify and fill gaps inknowledge for major costcomponents of vehicleownership and operation4
Approach/StrategyApproach – Milestones Multiple tasks spread across multiple labs. Key tasks presented here No FY2021 milestones or go/no-go decision points remainingTasksFY2020SubtasksQ1Q2Identify R&D gapsCost factorsGather dataQuantify each factorSynthesisFrameworkCross-factor linkageCollaborationWorkshopsOnline dataWeb toolPublicationDraft reportFinal report5Q3FY2021Q4Q1Q2Q3
Approach/StrategyApproach – Scope Modeled vehicles from Autonomie with varying sizes, vocations, powertrains, andtechnological advancementSizes and VocationsPowertrains and FuelsTimeframeClass 4 DeliverySpark-Ignition (gasoline) Internal Combustion Engine2020Midsize SedanClass 6 DeliveryCompression-Ignition (diesel) Internal Combustion Engine2025Small Sport Utility VehicleClass 8 BusGasoline Hybrid Electric Vehicle2030Large Sport Utility VehicleClass 8 RefusePlug-in Hybrid Electric Vehicle2035Pickup TruckClass 8 VocationalHydrogen Fuel Cell Electric Vehicle2050Class 8 Tractor – Day CabBattery Electric VehicleLight DutyMedium & Heavy DutyCompact SedanClass 8 Tractor – Sleeper Cab6
Approach/StrategyApproach – Cost Components We identified 8 key factors as most important cost components for quantifying TCOCost ComponentsMajor Gaps AddressedVehicleDepreciation; Retail markupFinancingLoan termsFuelCharging infrastructureInsuranceAnnual & per-mile costsSlide 10Maintenance & repairAnnual & per-mile costsSlides 11-12Tax & feesRegistration; taxesPayload changesEstimation of payload lossLaborCost of EV charging7Slide 9Slide 13
AccomplishmentsTechnical Accomplishments and Progress Publication of major technical report: “ComprehensiveTotal Cost of Ownership Quantification for Vehicles withDifferent Size Classes and Powertrains”https://www.osti.gov/biblio/1780970 Development of software tool for third parties to maketheir own TCO omlrol9u66ncdi8fanvh5 Publication of literature review summarizing findings fromnearly 200 other studies:https://escholarship.org/uc/item/8dq1b82q Organization of two-part industry workshop on TCO frommanufacturer and fleet perspectivesA. Burnham et al., 20218
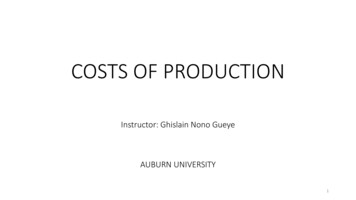
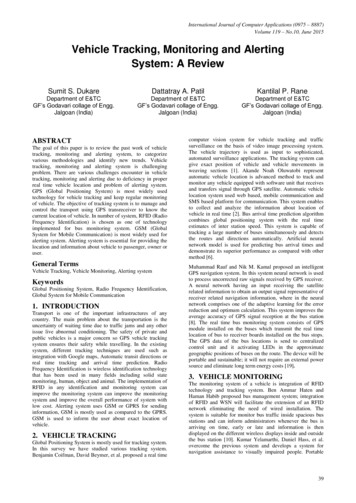
AccomplishmentsTechnical Accomplishments – Vehicle Costs Depreciation for LDV as a function ofMSRP, vehicle age, powertrain, size class,and market segment100%100%Size ClassCarLight Truck90%Adjusted Retention Rate Depreciation for MHDV as a function ofMSRP, vehicle age, and vehicle Sleeper, default VMT90%Sleeper, high VMT80%Sleeper, low 9MY18MY17MY16Model YearMY15MY14Retained Value MSRP 𝐴𝑅𝑅𝑖,𝑙,𝑝 MSRP 𝑏𝑙,𝑝 𝑒𝑥𝑝 𝑘𝑙,𝑝 𝑖MY130123456789101112131415Vehicle Age, Class 8 Sleeper TrucksRetained Value Retail Price expሺ𝐴 𝑎 𝑀 𝑠)9
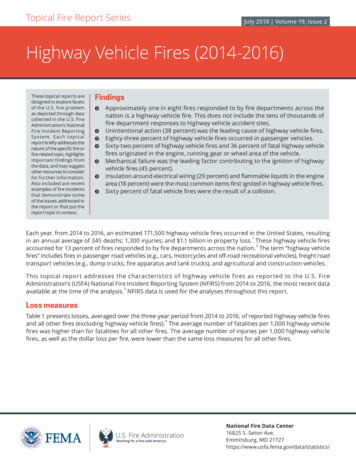
AccomplishmentsTechnical Accomplishments – Insurance Quantified typical insurance rates for LDV,including liability, comprehensive, andcollision as a function of MSRP, vehiclesize, powertrain, and residual valueSize Class CorrelationPowertrain Correlation14001200 Identified insurance rates for MHDV as afunction of vocation, and for tractors as afunction of MSRP and annual vehicle milestraveledCar 0.0089x 221.42Gas Car 0.0089x 221.42SUV 0.0046x 241.39HEV Car 0.0103x 182.77PUT 0.0059x 206.42BEV Car 0.0074x 258.11Typical annual insurance rates 1,400 40,000 35,000 1,200 30,000 1,000 25,000800 800600 600400 400 20,000 15,000 10,000 80kMSRP, Gasoline Vehicles 100k 0 20k 40k 60k 80k 0 100kMSRP, CarsComprehensive & Collision - 500 deductible10Class 8 Refuse 60kTransit Bus 40kClass 4 Delivery 20kClass 6 Delivery 0Class 8 Vocational0 0 200Tractor - Day cabGasolineHEVBEVCarSUVPUT200 5,000Tractor - SleeperAnnual Premium1000
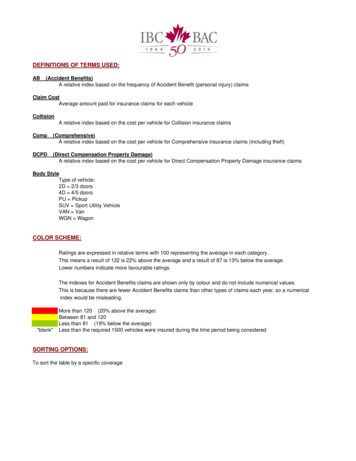
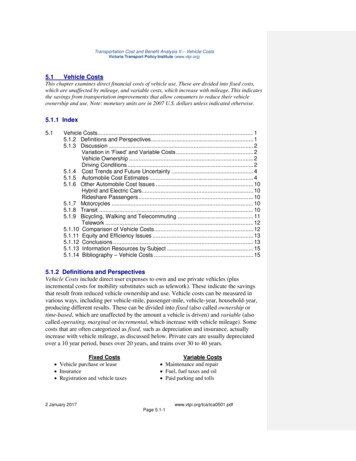
AccomplishmentsTechnical Accomplishments – Maintenance and Repair Compiled scheduled LDV maintenance forICEV, HEV, PHEV, and BEV Quantified LDV repair costs as a functionof vehicle MSRP, vehicle size, andpowertrain throughout vehicle lifetimeScheduled LDV Maintenance Costs 0.110 0.101 0.100 0.094 0.090Maintenance Cost per Mile 0.090 0.080 0.070 0.061 0.060 0.050 0.040 0.030 0.020 0.010 0.000ICEVHEVPHEVBEVTransmission Service*Spark Plugs*Oxygen Sensor*Timing Belt*Fuel Filter*Engine Air Filter*Oil Filter*Cabin Air FilterEngine Coolant*EV Battery Coolant*Brake FluidEngine Oil*Brake Rotors*Brake Calipers*Brake Pads*Shocks and StrutsTire RotationTires ReplacedHVAC ServiceHeadlight BulbsAccessory Drive Belt*Wiper BladesStarter BatteryMulti-Point 620.600.470.47Repair ሺPowertrain & type multipliers) ሺage factor) ሺMSRP factor)11
AccomplishmentsTechnical Accomplishments – Maintenance and Repair Compiled data on MHDV maintenance andrepair (M&R) costs by vocation for dieseltrucks Compiled variations in MHDV M&R costsfrom conventional diesel ICE trucks bypowertrain based on data from alternativefuel 4%79%79%Mid100%87%84%60%60%High88%73%69%41%41%
AccomplishmentsTechnical Accomplishments – Payload Stakeholders identified potential loss in payload as a significant concern for BEVs, thoughanecdotal evidence suggests few truck trips are at gross vehicle weight rating (GVWR). Quantified fraction of tractor-trailer tripswhich are weight-limited in order toestimate loss in payload for a givenincrease in vehicle massAutonomie modeled vehicle weight (2025)ICEVBEV (low-tech)BEV (high-tech)28,300 lb35,400 lb39,000 lb A MY2025 BEV sleeper cab loses anaverage of 2300 lbs of cargo capacityrelative to the ICEV (after accounting forthe one-ton weight allowance for BEV).This increases costs by 4.9%. However, in Autonomie low-tech case,batteries have lower energy density(kWh/kg). In this case, the expectedpayload loss is 4400 lbs, for a 10.3%13 increase in costs.
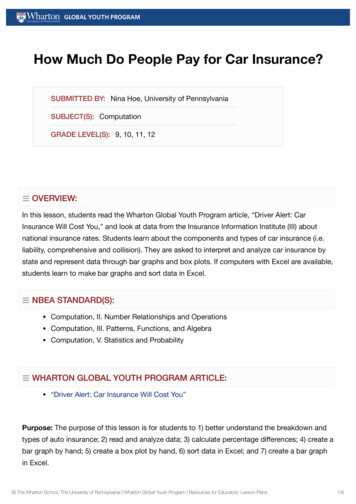
AccomplishmentsTechnical Accomplishments – Levelized Costs Calculation & comparison of Levelized Costof Driving (LCOD) across many perspectives– Changes in costs throughout vehicle lifetime– Comparison of lifetime costs for differentpowertrains– Comparison of lifetime costs for differentvehicle use casesPer-Mile Cost of Ownership, ICE-SI, Small SUV, MY2025 1.20 1.00 0.80 0.60 0.40 0.20 irTax & fees1112131415InsuranceAvg. 15-year per-Mile Cost of Driving - 2025, Small SUVAverage 10-year per-Mile Cost of Driving - 2025, Diesel Trucks 0.60 7.00 6.00 5.00 4.00 3.00 2.00 1.00 0.00 0.50 0.40 0.30 0.20 0.10Tractor SleeperTractor Class 8Class 6Day cab Vocational DeliveryClass RTax & feesPayloadLaborClass 8Refuse ntenanceRepairTax & feesFCEVInsuranceBEV300
Reviewer CommentsResponses to previous years reviewer comments This is the first year that the project has been reviewed.15
Challenges and BarriersRemaining Challenges and Barriers Real-world data for alternative powertrains, particularly for MHDV, is very sparse Not all vehicles are operated in the same way – variations in VMT and ownership time Data-driven analysis using today’s costs is not necessarily going to hold true in futureAny proposed future work is subject to change based on funding levels.16
Future WorkProposed Future Research While this specific project is finished, there are several areas ripe for continued researchoutside the bounds of this project:– Applications of TCO analysis– Regional resolution of costs– Extension to other vehicle vocations & powertrains The groundwork we have set in this project can be used by other researchers to improveestimates of TCO / LCODAny proposed future work is subject to change based on funding levels.17
Collaboration / CoordinationCollaboration and Coordination with other Institutions Multi-lab research effort– Task leads from LBNL,NREL, ORNL, andSandia, in addition toArgonne TCO workshops for heavy-duty sector to vet methods and assumptions with industry– Vehicle manufacturer panel– Fleet panel One-on-one interviews with third parties to better understand main cost factors Feedback from US DRIVE Integrated Systems Analysis Tech Team (ISATT)18
SummarySummary Multi-lab research effort to identify and fill gapsfor holistic calculations of vehicle costs for LDVand MHDV– Previous VTO analyses generally focused juston vehicle purchase cost and fuel expenditures– Potential variations in rank-order of the cost oftechnology from including maintenance, repair,insurance, financing, and taxes & fees Published major report documenting costestimates for each important component forfuture analysis– Report also includes quantification of TCO forseveral scenarios and detailed sensitivityanalyses exploring magnitude of differentassumptions on TCO calculations19
In order to accurately compare the costs of two vehicles, the total cost of ownership (TCO) should consist of all costs related to both purchasing and operating the vehicle. This TCO analysis builds on previous work to provide a comprehensive, internally consistent perspective of all relevant vehicle costs of ownership for light-duty vehicles