Transcription
Transportation Cost and Benefit Analysis II – Vehicle CostsVictoria Transport Policy Institute (www.vtpi.org)5.1Vehicle CostsThis chapter examines direct financial costs of vehicle use. These are divided into fixed costs,which are unaffected by mileage, and variable costs, which increase with mileage. This indicatesthe savings from transportation improvements that allow consumers to reduce their vehicleownership and use. Note: monetary units are in 2007 U.S. dollars unless indicated otherwise.5.1.1 Index5.1Vehicle Costs. 15.1.2 Definitions and Perspectives . 15.1.3 Discussion . 2Variation in ‘Fixed’ and Variable Costs . 2Vehicle Ownership . 2Driving Conditions . 25.1.4 Cost Trends and Future Uncertainty . 45.1.5 Automobile Cost Estimates . 45.1.6 Other Automobile Cost Issues . 10Hybrid and Electric Cars. 10Rideshare Passengers . 105.1.7 Motorcycles . 105.1.8 Transit . 105.1.9 Bicycling, Walking and Telecommuting . 11Telework . 125.1.10 Comparison of Vehicle Costs . 125.1.11 Equity and Efficiency Issues . 135.1.12 Conclusions . 135.1.13 Information Resources by Subject . 155.1.14 Bibliography – Vehicle Costs . 155.1.2 Definitions and PerspectivesVehicle Costs include direct user expenses to own and use private vehicles (plusincremental costs for mobility substitutes such as telework). These indicate the savingsthat result from reduced vehicle ownership and use. Vehicle costs can be measured invarious ways, including per vehicle-mile, passenger-mile, vehicle-year, household-year,producing different results. These can be divided into fixed (also called ownership ortime-based, which are unaffected by the amount a vehicle is driven) and variable (alsocalled operating, marginal or incremental, which increase with vehicle mileage). Somecosts that are often categorized as fixed, such as depreciation and insurance, actuallyincrease with vehicle mileage, as discussed below. Private cars are usually depreciatedover a 10 year period, buses over 20 years, and trains over 30 to 40 years.Fixed Costs Vehicle purchase or lease Insurance Registration and vehicle taxesVariable Costs Maintenance and repair Fuel, fuel taxes and oil Paid parking and tolls2 January 2017www.vtpi.org/tca/tca0501.pdfPage 5.1-1
Transportation Cost and Benefit Analysis II – Vehicle CostsVictoria Transport Policy Institute (www.vtpi.org)5.1.3 DiscussionVariation in ‘Fixed’ and “Variable” CostsSome costs usually categorized as fixed are actually partly variable; they increase to somedegree with vehicle use, and decline when vehicle travel is reduced. Depreciation,insurance and parking are partly variable since increased driving increases the frequencyof repairs and replacement, reduces vehicle resale value, and increases the risks ofcrashes, traffic and parking citations. Used vehicle price guides (www.edmunds.com andwww.kbb.com) indicate that mileage-related depreciation is typically about 0.055between 50,000 and 100,000 miles on a five-year old car, and much higher for lowmileage newer cars.1 Similarly, maintenance costs for older vehicles depend greatly ondistance driven. Vehicle leases often have “excessive mileage” charges averaging about10 per mile (typically over 15,000 annual miles).Vehicle OwnershipConsumers can often achieve considerable savings by reducing vehicle ownership. Forexample, if improved transport options (better walking and cycling conditions or publictransit services) allow 10% of households to avoid purchasing a second car, the savingsaverage 200-400 annually per household (assuming 2,000 to 4,000 in annual savingsper vehicle). Cumulative savings can be large. A study by McCann found that householdsin communities with better transit services and more accessible land use patterns spendless than 5,500 annually on transportation while residents of more automobile dependentregions spend more than 8,500 annually on transportation2. See section 5.1.5 below formore information on automobile ownership marginal costs.Driving ConditionsVehicle operating costs per mile vary depending on driving patterns and conditions. Fuelconsumption per vehicle-mile tends to increase at speeds over 55 mph, under 20 mph, andunder stop-and-go driving conditions (Energy and Emission Reductions).3 Vehicleoperating costs are about 40% higher on urban arterials than highways, and costs increaseproportional to travel time when congestion reduces traffic speed to 30 mph on a highwayor 20 mph on an arterial (see discussion in Chapter 5.5).4 Roadway investment modelsprovide detailed vehicle cost estimates (fuel, oil and tires, and sometimes maintenance) orvarious vehicle classes and road conditions.5 They are designed to predict the vehicle costsavings resulting from roadway improvements.1Art Ludwig (2002), Understatement of Auto Operation Costs by AAA (www.oasisdesign.net); htm2 Barbara McCann (2000), Driven to Spend; The Impact of Sprawl on Household Transportation Expenses,Surface Transportation Policy Project (www.transact.org). Values not adjusted for inflation.3 ORNL, Transportation Energy Book, Oak Ridge National Laboratories, U.S. Department of Energy(www-cta.ornl.gov/data), updated annually.4 Kenneth Small (1992) Urban Transportation Economics, Harwood (Chur) p. 76.5 TransFund (1998), Project Evaluation Manual, TransFund New Zealand (www.transfund.govt.nz); TTI(1997), MicroBENCOST, Texas Transportation Institute (http://tti.tamu.edu); Earl Klaubert (2001),Highway Effects on Vehicle Performance, Turner-Fairbank Highway Research Center, FHWA, FHWA-RD00-164 (www.tfhrc.gov/library/library.htm).2 January 2017www.vtpi.org/tca/tca0501.pdfPage 5.1-2
Transportation Cost and Benefit Analysis II – Vehicle CostsVictoria Transport Policy Institute (www.vtpi.org)Vehicle costs can vary depending on vehicle type, travel conditions, and market factorssuch as fuel taxes and vehicle and parking fees. Analyses vary in the scope of costs theyconsider. For example, when estimating automobile commuting costs, and therefore thesavings from improvements to alternative modes and commute trip reduction programs,many calculators only consider fuel and parking costs. Few consider the higher fuel andmaintenance costs for driving under congested, urban-peak conditions. Some considermaintenance and tire replacement costs, and a few consider mileage-based depreciation(the incremental decline in the value of a vehicle, or its future operating life, withincreased vehicle travel). Fixed and external costs are often ignored. As a result, the fullcosts of driving, and therefore the full benefits of vehicle travel reductions, tend to behigher than many estimates indicate. Table 5.1.3-1 summarizes various user costcategories.Table 5.1.3-1CategoryVehicle Costs CategoriesDescriptionVehicle operating costs Fuel, oil and tire wear.Distance-based maintenance andOther distance-baseddepreciation, mileage lease fees, additionalcostscrash and citation risk costs.Special feesParking fees and road tolls.Vehicle ownershipTime-based depreciation, financing,costsinsurance, registration fees and taxes.Residential parkingResidential parking costs.Typical Values15-20 per vehicle-mile. Higherunder congested conditions.10-20 per vehicle-mile.Varies. 3,000-5,000 per vehicle-year. 200-2,000 per vehicle-year.Automobiles involve various types of costs. Different types of analysis consider different types ofcosts.Formatted: Bullets and Numbering2 January 2017www.vtpi.org/tca/tca0501.pdfPage 5.1-3
Transportation Cost and Benefit Analysis II – Vehicle CostsVictoria Transport Policy Institute (www.vtpi.org)Cost TrendsReal (inflation-admusted) automobile costs declined between 1970 and 1985, but havetended to increased since 1985. Fuel prices are expected to incease in the long-run due torising demand and declining production (called peak oil), as discussed in Chapter 11.6Formatted: Bullets and Numbering5.1.4 Automobile Cost EstimatesTable 5.1.5-1 Automobile Cost Estimate Summary Table – Selected SourcesPublicationMarginal cost savings inUSA from a shift to transitfrom private automobiles in2006.Annual cost to householdsper additional vehicleaveraged about 3,500 and 0.20 per mile.2007 USDAnnual cost peradditional vehicleaveraged about 3,600 and 0.21per mile.AAA – 2008 Vehicle CostEstimatesFixed and variable costs forvarious types of vehicles inthe US for the first five yearsof operation.Average cost per mile for amedium sedan ranges from 0.47 to 0.72 per mile and 7190 to 9369 per yeardepending on distancedriven.Original is in 2007USDCAA – 2007 Driving CostsAn estimate of the cost ofoperating specific vehiclesfor the first four years inCanada.Cost per kilometer for a2.2L sedan range from 0.36 to 0.72 per Km.USD 0.54 to 1.08per mileBarnes & Langworthy(2004). Per Mile Costs ofOperating Automobiles andTrucksCost estimates for passengercars, light trucks andcommercial trucksPer mile: Automobiles 0.17, Light trucks 0.22,Commercial Trucks 0.49.Costs reported in2007 USDUS Consumer ExpenditureSurvey 2004Reports actual expendituresof the actual vehicle fleet,not just newer vehicles.Average cost per mile was 0.26 and the average pervehicle cost was 4,532Costs reported in2007 USDTransport Canada Full-CostInvestigation projectAnalyzes the costs forvehicles by age class inCanada in 2000. Shows howcosts and distance traveleddecline with vehicle age.Average cost per km rangesfrom 0.26 to 0.40.Average is 0.32 ( 0.51 permile).Average cost per kmranges from 0.24 to 0.37. Average is 0.30 ( 0.48 permile).NCTR (2008) – Shift inHousehold TransportationSpendingCostsCost ValueThis table summarizes cost estimates of various studies. Results vary depending on the analysisperspective, including the types of costs and vehicles considered. Detailed descriptions of eachcost estimate study are discussed in this chapter.6S. Donovan, et al. (2008), Managing Transport Challenges When Oil Prices Rise, Research Report 357,New Zealand Transport Agency (www.ltsa.govt.nz); at www.ltsa.govt.nz/research/reports/357.pdf.2 January 2017www.vtpi.org/tca/tca0501.pdfPage 5.1-4
Transportation Cost and Benefit Analysis II – Vehicle CostsVictoria Transport Policy Institute (www.vtpi.org) The National Center for Transit Research analyzed vehicle expenses in Exploration ofa Shift in Household Transportation Spending from Vehicles to Public Transportation(Polzin, Chu and Raman 2008) www.nctr.usf.edu/pdf/77722.pdf. The accompanyingspreadsheet model calculates marginal savings that result from reductions inhousehold vehicle ownership; for example, due to transit oriented development orother travel option improvements. They find the annual cost to households peradditional vehicle averaged about 3,500 in 2006, but conclude that marginal annualsavings per reduced vehicle are probably somewhat less since households are likely toshed lower value vehicles. In the model they use a marginal cost of 0.20 per mile,but suggest that this value be adjusted to reflect specific situations. Averagehousehold vehicle expenditures are shown below in Table 5.1.5-2, and marginalsavings per reduced vehicle are shown in Table 5.1.5-3Table 5.1.5-2 Vehicle Expenditures Including Rental Cars (Polzin, Chu and Raman 2008)(2006 Dollars)Vehicles per HH012345 1 355 3,102 9,972 10,891 10,862 11,208Adults per Household3 847 743 3,748 3,832 7,289 7,723 15,826 11,084 17,470 19,057 20,001 25,72624 764 3,949 7,411 10,976 15,078 26,7295 680 5,481 7,198 10,481 14,307 29,324Spending varies depending on household composition and vehicle ownership. In this study,vehicle travel expenses include car rentals, but excludes taxi and public transit expenses. Notethat vehicle costs do not decline to zero with zero vehicle ownership. Source: Figure 15, p. 33.Table 5.1.5-3Household Savings by Vehicle Ownership (Polzin, Chu and Raman 2008)Savings per Relinquished Vehicle (2006 Dollars)Adults per HouseholdVehicles per HH12341 2,747 2,901 3,089 3,1852 6,870 3,540 3,892 3,4623 919 8,537 3,361 3,5654- 29 1,644 7,973 4,1015 346 2,531 6,669 11,6515 4,801 1,717 3,283 3,827 15,016Reduction in cost per vehicle relinquished varies considerably depending on householdcomposition and number of vehicles owned. Note that the data is from a fairly small sample, thegeneral trends indicated may be more reliable than specific values. Source: Figure 16, p. 34. The American Automobile Association publishes estimated costs of owning andoperating various vehicle types as summarized in Table 5.1.5-4. This reflects costsduring the first five years of a vehicle’s life and so has relatively high depreciationand insurance costs, and almost no repair costs. Note that depreciation is nowadjusted for mileage, unlike earlier AAA data.2 January 2017www.vtpi.org/tca/tca0501.pdfPage 5.1-5
Transportation Cost and Benefit Analysis II – Vehicle CostsVictoria Transport Policy Institute (www.vtpi.org)Table 5.1.5-4American Automobile Association 2008 Vehicle Cost Estimates7Small SedanGas & oilMaintenanceTiresOperating costs/mileInsuranceLicense & registrationDepreciationFinancingOwnership costs/yearTotal for 12,500 annual milesAverage cost per mileMedium Sedan8.21 4.26 0.61 13.08 948 419 2,430 553 4,350 5,985 0.3510.54 4.51 0.87 15.92 957 572 3,401 786 5,716 7,706 0.46Large Sedan11.51 4.92 0.82 17.25 1,022 711 4,551 998 7,282 9,438 0.58SUV14.394.940.9520.28 948 727 4,619 1,023 7,317 9,852 0.59Van12.164.870.7417.77 897 602 3,818 832 6,149 8,370 0.49This table summarizes vehicle cost estimates published by the American Automobile Association.It represents typical costs during the first six years of vehicle operation, and so tends tooverestimate depreciation and financing costs and underestimate repair costs. It also ignoresincidental costs, such as user parking fees and road tolls. The Canadian Automobile Association (www.caa.ca) also publishes a version ofDriving Costs. One vehicle covered is summarized in Table 5.1.5-5 below.Table 5.1.5-5 Annual Costs for 2.2 L Cobalt Sedan (2006 Canadian Dollars)8KilometersDrivenper Year12,000 km16,000 km18,000 km24,000 km32,000 kmAnnualOperatingCosts (variable) 1,500.00 2,000.00 2,250.00 3,000.00 4,000.00AnnualOwnershipCosts (fixed) 7,081.00 7,081.00 7,081.00 7,261.00 7,501.00Total CostCost perKilometer 8,581.00 9,081.00 9,331.00 10,261.00 11,501.00 0.715 0.568 0.518 0.428 0.359This table summarizes estimated costs for relatively new (first 4years) 2007 Chevrolet CobaltLTZ four-door sedan — 2.2 litre 4-cylinder. Note that ‘fixed’ costs increase slightly withincreased mileage because depreciation is adjusted for mileage, as in the AAA data above. The U.K. Automobile Association (www.theaa.co.uk) provides ownership andoperating costs for gasoline and diesel powered cars in a similar format to the AAAand CAA data above. Annual reports since 1998 are available atwww.theaa.com/motoring advice/running costs/index.html.7AAA (2008), Your Driving Costs 2008, American Automobile Association (www.aaa.com); DrivingCosts2009.pdf.8 CAA (2007). Your Driving Costs 2007, Canadian Automobile Association (www.caa.ca); atwww.caa.ca/documents/2007-04-27 DrivingCostsBrochure2007.pdf.2 January 2017www.vtpi.org/tca/tca0501.pdfPage 5.1-6
Transportation Cost and Benefit Analysis II – Vehicle CostsVictoria Transport Policy Institute (www.vtpi.org) The 2013 American Household Survey includes information on average householdexpenditures on transporation, as summarized below.Table 5.1.5-6Average Household Transportation Expenditures9FuelAuto insuranceCar paymentsCar maintenanceParkingPublic transportationTotals Per Vehicle 1,263 758 2,526 316 189NA 5,053Barns and Langworthy use various sources to estimate vehicle operating costs, assummarized in the table below. This report provides a model for calculating thesecosts under different driving conditions. Costs are estimated to increase about 25%under city driving conditions, and about 17% on roads with poor quality pavement.The report suggests methods to determine how operating costs will change in thefuture. Data below has been adjusted for inflation by CPI.Table 5.1.5-7Cost tals Per Year 2,400 1,440 4,800 600 360 432 10,032Baseline Vehicle Operating Costs (2007 Cents Per n/Light Truck8.84.21.17.621.7Commercial Truck24.211.94.09.049.0Table 5.1.5-8 summarizes actual average household transportation expenditures fromthe annual Consumer Expenditure Survey, which provides detailed data on whatconsumers actually spend on their vehicles by demographic and geographic groupsince 1984.11 Note that this is significantly lower than most other published vehiclecost estimates because it includes old as well as new vehicles.U.S. Census (2013), “Table S-O4C-AO,” 2013 American Housing Survey; at nal-summary-report-and-tables---ahs-2013.html.10 Gary Barnes and Peter Langworthy (2004), “Per Mile Costs of Operating Automobiles and Trucks,”Transportation Research Record 1864, Transportation Research Board (www.trb.org), pp. 71-77.11 Piyushimita Thakuriah and Yihua Liao (2005), An Analysis Of Variations In Vehicle-OwnershipExpenditures, TRB 84th Annual Meeting (www.trb.org).92 January 2017www.vtpi.org/tca/tca0501.pdfPage 5.1-7
Transportation Cost and Benefit Analysis II – Vehicle CostsVictoria Transport Policy Institute (www.vtpi.org)Average US Vehicle Expenditures, 2004 (2007 Dollars)12Table 5.1.5-8Vehicle PurchasesFuel and oilFinancing chargesMaintenance and repairsInsuranceOther vehicle expensesTotal vehicle expensesPublic transport expensesTotal transport expensesPerPortion ofHousehold Household Total 3,9757.8% 1,8703.7% 3780.7% 7631.5% 1,127.882.2% 498.421.0% 8,611.2017% 515.971.0% 9,127.1718.0%Per VehicleYear 2,092 984 199 401 593.19 262.08 4,532.58NANAPer VehicleMile 0.16 0.08 0.01 0.04 0.05 0.02 0.36NANA“Public Transport” includes intercity air, rail, bus transport and local transit services. Transport costs increased as a portion of household budgets during the last century,indicated in the table below. This reflects increased vehicle ownership and use duringthis period, and reductions in other expenditures, particularly food and clothing.Table ealth careOtherAverage Household .7%10.9%1986–8719.4%33.7%25.7%5.2%4.0%12.0%This table indicates the portion of expenditures devoted to various categories of goods by singlewage earner urban households for various periods during the Twentieth Century. Transportationexpenditures increased significantly during this period, reflecting increased motorized travel. Table 5.1.5-10 summarizes Transport Canada’s Estimates of Light Road VehiclesFinancial Cost in Canada. This study analyzes costs for vehicles of various ages inCanada in 2000; these values have been adjusted by CPI to 2007 dollars.12Consumer Expenditure Survey, BLS (www.bls.gov), annual reports.David S. Johnson, John M. Rogers and Lucilla Tan (2001), “A Century Of Family Budgets In TheUnited States,” Monthly Labor Review (www.bls.gov/opub/mlr/2001/05/art3full.pdf), May, pp. 28-46.132 January 2017www.vtpi.org/tca/tca0501.pdfPage 5.1-8
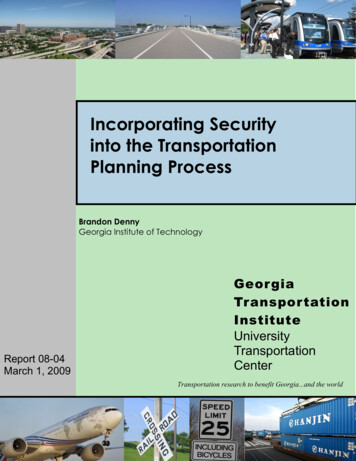
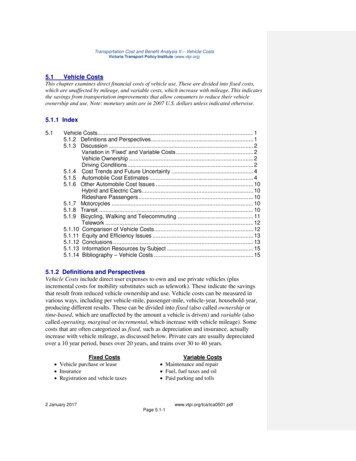
Transportation Cost and Benefit Analysis II – Vehicle CostsVictoria Transport Policy Institute (www.vtpi.org)Table 5.1.5-10Vehicle Age0 to 23 to 56 to 89 to 1112 to 1415 Sum or Weighted AverageAverage Vehicle Cost by Vintage – (2007 Canadian Dollars)14Portion ofFleet19%19%19%19%14%10%100%Average 517,562Average costper vehicle9,3197,7805,8254,1763,4752,459 5,883Average costper km0.400.360.310.290.270.26 0.32Both total and average financial costs tend to decrease with vehicle age. Note that vehiclesbetween 9 and 14 years old made up 33% of the Canadian automobile fleet in 2000. Canadian 0.32 per km was USD 0.48 per mile based on 2007 exchange rates.Figure 5.1.5-1 illustrates the large reduction in shipping costs that occurred between 1850and 2000 due to technological improvements, including larger and more efficientvehicles, more efficient loading and transfer systems (such as containerization) andeconomies of scale (more shipping volumes).Railroad Freight Costs15Average Dollars Per TonMileFigure 5.1.5-1 0.25 0.20 0.15 0.10 0.05 0.0018501900Years19502000Shipping costs per ton-mile declined significantly during the last 150 years.14TC (2007), Estimates of Light Road Vehicles Financial Cost in Canada, Full Cost Investigation Project,Transport Canada (www.tc.gc.ca/pol/en/aca/fci); /Road/r005/r005.pdf.15 William L. Garrison and David M. Levinson (2006), The Transportation Experience: Policy, Planning,and Deployment, Oxford University Press (www.us.oup.com), p. 290.2 January 2017www.vtpi.org/tca/tca0501.pdfPage 5.1-9
Transportation Cost and Benefit Analysis II – Vehicle CostsVictoria Transport Policy Institute (www.vtpi.org)5.1.6 Other VehiclesHybrid and Electric CarsHybrid vehicles are more costly to purchase but more fuel efficient in urban conditionsthan standard models.16 For example, the 2009 Camry Hybrid lists for about 6,600 morethan a non-hybrid version, a 9 per vehicle-mile premium if depreciated over 5 years at8% interest and 15,000 annual miles.17 It is rated at 33 miles-per-gallon (MPG) in citydriving, 50% better than a standard Camry’s 22 MPG, but only achieves a 10% gain (31vs. 34 MPG) in highway driving. The Toyota Prius achieves 48 MPG in city driving and45 MPG in highway driving. A 2008 GMC Yukon four wheel drive hybrid is rated at 20MPG in both city and highway conditions, which is not very fuel efficient butsignificantly more efficient than the standard model’s 15 MPG city driving rating.The US DOE reports that electric cars require new battery sets every 20,000-30,000 milescosting 2,000- 3,000 (averaging 6-15 per vehicle-mile), and consume 0.25 to 0.5 kWhper mile, so energy costs average 2-5 per mile based on typical residential energy rates.18Electric cars and plug-in hybrids will likely have a similar cost profile to present hybrids,with significant variable cost benefits in urban commercial fleets.Rideshare PassengersA rideshare passenger using an otherwise empty seat generally incurs minimalincremental vehicle costs, estimated to be a 5% increase in fuel consumption and othervariable costs, so adding 2 passengers increases variable costs 10%.5.1.7 MotorcyclesAlthough motorcycles are less expensive than a car to purchase and operate, their costsper passenger-mile tend to be relatively high due to low annual mileage and occupancy.An average motorcycle is driven only 2,500 miles annually and travels 50 miles pergallon of fuel.19 Over 2,600 annual miles the average cost per mile is about 1.35.5.1.8 TransitTable 5.1-9 summarizes U.S. transit expenses and revenues. Expenditures are dividedinto capital (facilities and vehicles) and operation (labor, maintenance and fuel).Revenues are divided into fares (user payments) and subsidies (other revenues). Transitfares and operating costs vary depending on conditions and perspective.20 Urban peak16Based on EPA fuel efficiency data at www.fueleconomy.gov.Data from Carsdirect.com (www.carsdirect.com); s USB90TOC201A0,USB90TOC021A0.18 USDOE Alternative Fuels Data Center (www.afdc.doe.gov) and Fuel Economy Website(www.fueleconomy.gov/feg/hybrid sbs.shtml).19 BTS, National Transportation Statistics, Bureau of Transport Statistics (www.bts.gov), annual report.20 Todd Litman (2004), Evaluating Public Transit Benefits and Costs, VTPI (www.vtpi.org); Brian D.Taylor, Hiroyuki Iseki and Mark Garrett (2000), How Much Does A Transit Trip Cost?, University ofCalifornia Transportation Center (www.uctc.net); at www.uctc.net/scripts/countdown.pl?702.pdf. 20William Vickrey (1994). Pricing in Urban and Suburban Transport, Public Economics; Selected Papers byWilliam Vickrey, Cambridge University Press (www.uk.cambridge.org).172 January 2017www.vtpi.org/tca/tca0501.pdfPage 5.1-10
Transportation Cost and Benefit Analysis II – Vehicle CostsVictoria Transport Policy Institute (www.vtpi.org)travel tends to have high costs and high revenue, while off-peak and rural travel has lowercosts and revenues. Revenue per-mile is highest for short trips and lower for longerdistance trips. Transit service experiences economies of scale: unit costs decline withincreased ridership, so routes with high load factors have low costs per passenger mileand high cost recovery. Marginal costs tend to be lower than the average costs (a 10%ridership increase increases costs less than 10%).21Table 5.1.8-1 U.S. 2002 Public Transit Expenses and Revenues (2007 Dollars)22BusCapital Expenses (m)Operating Expenses (m)Total Expenses (m)Average Fare Per TripFare Revenues (m)Subsidy (Total Exp. - Fares)Vehicle Revenue Miles (m)Passenger Miles (m)Avg. Veh. OccupancyAvg. Trip Distance (miles)Unlinked Trips (m)Total Exp. Per Pass. MileFare Rev. Per Pass. MileSubsidy Per Pass. MilePercent Subsidym million 3,543 14,726 18,267 0.83 4,365 13,9021,86419,52710.52.85,268 0.94 0.22 0.7176%TrolleyBus 220 219 438 0.60 70 3691318814.18.7116 2.33 0.37 1.9784%Heavy Commuter Demand Light Other TotalsRailRailResponse Rail 5,340 2,774 202 2,016 296 14,392 4,994 3,504 1,914 910 535 26,799 10,333 6,278 2,117 2,927 831 41,191 1.09 4.10 2.74 0.78 1.33 1.08 2,917 1,695 216 264 154 9,682 7,417 4,583 1,900 2,663 675 31,509604259525601023,42713,6639,4506511,4321,034 88414793371169,017 0.76 0.67 3.25 2.05 0.81 0.90 0.21 0.18 0.33 0.19 0.15 0.21 0.54 0.48 2.93 1.86 0.66 0.6972%73%90%91%81%76%5.1.9 Bicycling, Walking and TelecommutingA good bicycle with accessories typically costs 500-1,000, or 50-100 annually over aten-year operating life, plus 50-200 annually for maintenance if ridden 2,000 annualmiles, averaging 5-15 per mile. Many households own bicycles for recreational purposesso the incremental costs for using them for utilitarian trips is small. Shoes typically last500-5,000 miles of walked. Walking and cycling burn calories that may increase foodrequirements, although most North Americans benefit from losing weight, so increasedenergy consumption is often considered a benefit rather than a cost (i.e., a weight lossstrategy or an opportunity to eat more enjoyable foods). If utilitarian bicycling or walkingsubstitutes for other exercise activities they can be considered to have negative costs (i.e.,if bicycling or walking reduce the need to pay health club dues or medical costsassociated with sedentary living they provide benefits and save money).Donald J. Harmatuck (2005), “Cost Functions and Efficiency Estimates of Midwest Bus TransitSystems,” Transportation Research Record 1932, TRB (www.trb.org), pp. 43-53.22 Public Transportation Fact Book Statistics, American Public Transit Association (www.apta.com);National Transit Database, Federal Transit Administration (www.ntdprogram.gov/ntdprogram/data.htm ).212 January 2017www.vtpi.org/tca/tca0501.pdfPage 5.1-11
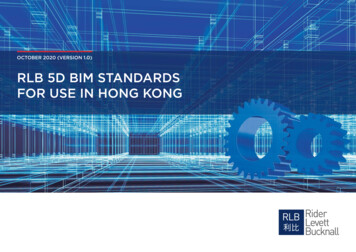
Transportation Cost and Benefit Analysis II – Vehicle CostsVictoria Transport Policy Institute (www.vtpi.org)TeleworkTelework often uses home office space, telecommunications equipment and services thatcan cost hundreds or thousands of dollars annually, but many households make suchinvestments for personal use, and these costs can be partly offset by savings in businessoffice space. The incremental equipment cost of telework is therefore likely to average 500-1,500 annually for a typical part-time teleworker.5.1.10 Comparison of Vehicle CostsFigure 5.1.10-1 illustrates the differences in vehicle costs for various modes. It showshow some modes (such as automobile) have relatively high fixed costs and relatively lowvariable costs, as least as they are normally perceived (as described above, a portion ofdepreciation costs are actually variable, but this is not always recognized by users), whileother modes such as taxi and carsharing have minimal fixed costs but higher variablecosts. Walking, cycling and transit have relatively low vehicle costs.User Expenses for Various Modes23Figure 5.1.10-1 5, 0001996 Dollars Per YearNew CarAverage Car 4, 000Compact Car 3, 000Carshare/RentalPublic Transit 2, 000TaxiMotorcycle 1, 000BicycleTelecommute
provide detailed vehicle cost estimates (fuel, oil and tires, and sometimes maintenance) or various vehicle classes and road conditions.5 They are designed to predict the vehicle cost savings resulting from roadway improvements. 1 Art Ludwig (2002), Understatement