Transcription
PepsiCoPresentation to Consumer Analyst Group of New YorkFebruary 18, 2016Indra NooyiChairman and Chief Executive OfficerHugh JohnstonVice Chairman and Chief Financial Officer1
Safe Harbor Statement& Non-GAAP InformationThis presentation should be viewed in conjunction with PepsiCo’s webcast presentation at the Consumer Analyst Group of New York Conference on February 18,2016 and PepsiCo’s Form 8-K filed with the Securities and Exchange Commission on February 11, 2016.Safe Harbor StatementStatements in this communication that are “forward-looking statements”, are based on currently available information, operating plans and projections about futureevents and trends. Terminology such as “aim,” “anticipate,” “believe,” “drive,” “estimate,” “expect,” “expressed confidence,” “forecast,” “future,” “goal,” “guidance,”“intend,” “may,” “objective,” “outlook,” “plan,” “position,” “potential,” “project,” “seek,” “should,” “strategy,” “target,” “will” or similar statements or variations of suchterms are intended to identify forward-looking statements, although not all forward-looking statements contain such terms. Forward-looking statements inherentlyinvolve risks and uncertainties that could cause actual results to differ materially from those predicted in such forward-looking statements. Such risks anduncertainties include, but are not limited to: changes in demand for PepsiCo’s products, as a result of changes in consumer preferences or otherwise; changes inthe legal and regulatory environment; imposition of new taxes, disagreements with tax authorities or additional tax liabilities; PepsiCo’s ability to compete effectively;PepsiCo’s ability to grow its business in developing and emerging markets or unstable political conditions, civil unrest or other developments and risks in themarkets where PepsiCo’s products are made, manufactured, distributed or sold; unfavorable economic conditions in the countries in which PepsiCo operates;increased costs, disruption of supply or shortages of raw materials and other supplies; failure to realize anticipated benefits from PepsiCo’s productivity initiatives orglobal operating model; business disruptions; product contamination or tampering or issues or concerns with respect to product quality, safety and integrity; damageto PepsiCo’s reputation or brand image; failure to successfully complete or integrate acquisitions and joint ventures into PepsiCo’s existing operations or tocomplete or manage divestitures or refranchisings; changes in estimates and underlying assumptions regarding future performance that could result in animpairment charge; PepsiCo’s ability to recruit, hire or retain key employees or a highly skilled and diverse workforce; loss of any key customer or changes to theretail landscape; any downgrade or potential downgrade of PepsiCo’s credit ratings; the ability to protect information systems against, or effectively respond to, acybersecurity incident or other disruption; PepsiCo’s ability to implement shared services or utilize information technology systems and networks effectively;fluctuations or other changes in exchange rates; climate change or water scarcity, or legal, regulatory or market measures to address climate change or waterscarcity; failure to successfully negotiate collective bargaining agreements, or strikes or work stoppages; infringement of intellectual property rights; potentialliabilities and costs from litigation or legal proceedings; and other factors that may adversely affect the price of PepsiCo’s common stock and financial performance.For additional information on these and other factors that could cause PepsiCo’s actual results to materially differ from those set forth herein, please see PepsiCo’sfilings with the Securities and Exchange Commission, including its most recent annual report on Form 10-K and subsequent reports on Forms 10-Q and 8-K.Investors are cautioned not to place undue reliance on any such forward-looking statements, which speak only as of the date they are made. PepsiCo undertakesno obligation to update any forward-looking statements, whether as a result of new information, future events or otherwise.Non-GAAP InformationPlease refer to the “Investors” section of PepsiCo’s web site at www.pepsico.com under the heading “Events and Presentations” to find disclosure and areconciliation of any non-GAAP financial measures contained herein.GlossaryPlease refer to the Glossary and attachments to PepsiCo’s Form 8-K filed with the Securities and Exchange Commission on February 11, 2016 available atwww.pepsico.com for the definitions of non-GAAP financial measures including organic, core, constant currency, and free cash flow excluding certain items.2
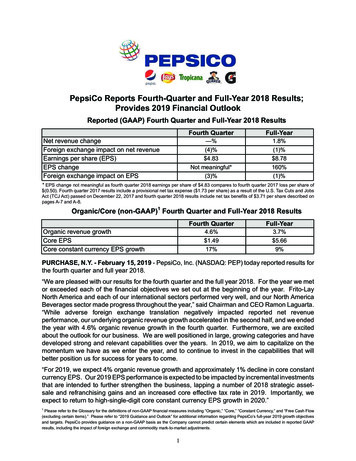
Portrait of a Consistent and Durable CPG CompanyRevenue 63BFree Cash Flow (ex certain items) 8.1BOrganic Revenue Growth5%Core Operating Margin15.8%Core Net ROIC19.6%3 Yr Core Constant Currency EPS (Avg)9%3 Yr Dividends per Share CAGR9%3 Yr Cumulative Cash Returns 24BNote: All figures are for the year 2015. Certain of the above items represent Non-GAAP financial measures that exclude certain items. Please refer to the “Reconciliation of GAAP and Non-GAAP Information” attachmentposted on February 18, 2016 under the “Investors – Events and Presentations” section on PepsiCo’s website at www.pepsico.com to find disclosure and a reconciliation of the above non-GAAP financial measures.3
2015: Delivered Our Financial TargetsTargetMSD Organic Revenue GrowthCore Operating Margin ImprovementProductivity 1 BillionCore Constant Currency EPS Growth 7%,raised to 9%Result 5% 30 bps 1 billion 10%Share Repurchases of 4.5 to 5 Billion,Raised to 5 Billion 5 billionDividends of 4 Billion 4 billionNote: Certain of the above items represent Non-GAAP financial measures that exclude certain items. Please refer to the “Reconciliation of GAAP and Non-GAAP Information” attachment posted on February 18, 2016under the “Investors – Events and Presentations” section on PepsiCo’s website at www.pepsico.com to find disclosure and a reconciliation of the above non-GAAP financial measures.4
Navigating a Stormy Global Environment5
Significant Macro ChallengesSlowing Growth /RecessionGeopolitical InstabilityRegulatoryChangeShiftingConsumer BehaviorChangingRetail EnvironmentGrowing EnvironmentalConsciousness But Some Pockets of Stability / Recovery6
We are Performing as We are TransformingTransforming our Product PortfolioBalancing our Geographic FootprintDriving Productivity to Fund InvestmentsAll While DeliveringAttractiveFinancial ResultsBuilding Capabilities and Adapting ourBusiness ModelReinforcing the Best and Strongest Elementsof our Culture7
Guided by Performance with PurposeDelivering top-tier results in a way that sustains and respectsthe business, society and the tyTalentSustainability8
Strong Positions in Growth CategoriesBalanced Mix inAttractive Growth CategoriesSocial Snacks Projected globalgrowth 5%Highly Complementary,but Diverse PortfolioSocial Beverages Projected globalgrowth 4% Clear #1 position Strong #2position with Leadership inleadershipinsalty snacksmanymarketsand opportunitySnacksto targetBeverages Compete53%otherbroadly47%macrosnackin all LRBoccasionscategoriesEverydayNutritionEveryday Nutrition Projected global growth 6%Note: PepsiCo snacks / beverage data based on 2015 net revenue; Category growth rates based on retail sales from Euromonitor All Channel projections from syndicated data9
Balanced Geographic MixMarket% of Net eloping& EmergingMarkets31%Market% of NetRevenueMexico6Russia4Total10Five Countries Comprise 75% of Total RevenueNote: Data is based on 2015 data10
Well Positioned In Top 5 Markets d & Beverage MarketShare#1#1#1#2#1Contribution to RetailSales Growth (‘10-’14)#1#1#1#2#1Source: IRI MULOC (US); Euromonitor Packaged Snacks, Liquid Refreshment Beverages and Nutrition Sales, 2014 (International Markets); branded manufacturers; LRB represents system-wide sales;Contribution to retail sales growth excludes the impact of M&A11
Good Mix of High Current Margins / Returns and Potentialfor Future Margin / Return ExpansionGrowth ncyExpansionRole in PortfolioRevenue GrowthAbsolute Margin / ROICMargin ImprovementCash FlowROIC Improvement12
Transformation Journey Continues13
Our Priorities: The 5 Cs14
Commercial Drive Innovation UsingDemand Space Framework Capture Health & WellnessGrowth Potential Lift and Adapt to LeverageOur Global Scale Focus on NewPartnerships andFoodservice Opportunities15
Commercial: Global Operating ATION16
Commercial: Mtn Dew17
Commercial: Mtn Dew KickstartLaunched in 2013Estimated Annual Retail Sales Approaching 400 millionGlobal Expansion18
Commercial: Mtn Dew KickstartMtn DewReturned tothe SuperBowl for theFirst TimeSince 200019
Commercial: Mtn Dew Kickstart20
Commercial: Doritos21
Commercial: PepsiMoji More than two billion smartphoneusers globally who send sixbillion emojis on a daily basis Launched in Russia, Canada andThailand in 2015 Expanding to 100 markets22
Commercial: MAXX Deep Ridged Chips Launched in 2012 Now in 33 countries withapproximately 250 millionestimated annual retail sales23
Commercial: Walkers Sunbites Launched in 2007 Now available in eight markets with 400 millionof estimated annual retail sales Uniquely crunchy wholegrain chips with awholesome tasteCrispy CrackersNote: Estimated annual retail sales includes SunchipsPitta BakesCrackers & DipCrispy Snacks24
Commercial: Quaker High Fiber Oats Drink25
Commercial: Quaker Gluten Free26
Commercial: Lipton Pure Leaf27
Commercial: Partnerships28
Commercial: FoodserviceLive NationF!ZZNSPIREStubborn SodaHello GoodnessKola House29
Cost 1B Annual ProductivitySavings TargetedThrough 2019 Leverage Global Functionsand Capabilities Exploit Automation andTechnology Global Smart SpendingImplementation30
Cost: Addressing 53B of Global CostsCategoryAll OtherMarketingLogistics /TransportationLaborDirectMaterialsNote: Estimated based on 2014 data% of CostOur Approach8611 Smart Spending30 Smart Spending Non-Working to Working Manufacturing Optimization Logistics Integration Technology Deployment 45Layers & SpansAutomationSegmentationStandards Compliance Procurement Excellence Waste Reduction Local Sourcing31
Cost: Embedding New Cost Mgmt Behaviors Across PEP1. Visibility2. ValueTargeting3. CategoryOwnership1. Provide transparency to ‘who-spends-how-much-onwhat’ through transactional data analysis2. Conduct benchmarking, value lever analysis and defineexpense policies and procurement initiatives to reduceconsumption and price3. Create an accountability matrix to ensure dual-ownershipof every expense6. Control &MonitorClosed LoopProcess4. SmartSpendingBudget4. Budget from zero annually to expose and eliminateunproductive expenses5. Execute strategic sourcing events to realize pricereductions with suppliers5. Procurement6. Monthly review to identify budget variances, ownersresponsible, and action plans to resolve them32
Cost: Driving Operations Productivity33
Capital Disciplined Capital Allocation Drive Individual BusinessCountry Performance toHigher EVA Leverage Partnerships toImprove Returns andCompetitive Positions Implement Low-CostBusiness Models34
Capital: Capex to Net RevenueCapex to Net Revenue (%)3-Year average 70 basis points lower than 2011 percentage6.05.05.04.34.03.02.01.020112013-2015 (Average)35
Capital: Driving Higher Utilization of AssetsIntegrated Logistics NetworkBoosting Throughput36
Capital: Core Net ROIC ImprovementCore Net ROIC (%)19.616.4 110bps201317.5 110bps2014 210bps2015Note: Core Net ROIC represents a Non-GAAP financial measure that excludes certain items. Please refer to the “Reconciliation of GAAP and Non-GAAP Information” attachment posted on February18, 2016 under the “Investors – Events and Presentations” section on PepsiCo’s website at www.pepsico.com to find disclosure and a reconciliation of the above non-GAAP financial measures.37
CapabilityAdvance Our CommercialAgenda with New Capabilities eCommerce Design Revenue Management Front Line Selling Tools Data Analytics38
Capability: DesignBrand IdentityBrand ExperiencesInnovationCustomer Partnerships39
Capability: Revenue ManagementLay’s Promotion StrategyPepsi Mini Cans40
Capability: Front Line Selling Tools41
Culture Live Our Values Reward Excellence Cultivate Efficiency andAccountability Expect Collaboration42
Virtuous, Self-Reinforcing Growth Cycle Well Positioned inAttractiveCategories Scale Leverage Brand Building AggressiveProductivityPrograms Innovation Go-to-MarketCapability43
Deliver Attractive ReturnsLong-Term GoalsTop Tier TSR Organic Revenue Growth: MSD Operating Margin Expansion: 30-50 bps / year Core, Constant Currency EPS: HSDSupportingFundamentals: Core FCF Growth Net Income Growth Core Net ROIC: 50 bps / year Strong Returns to Shareholders(dividends and sharerepurchases) Complementary Portfolio of Brandsin Snacks, Beverages and NutritionCategories Globally Balanced GeographicFootprintLeading Brand Building, Innovation and Go-to-Market CapabilitiesFlexible, Low-Cost Supply Chains That Are Environmentally SustainableFocus on ProductivityWorld-Class Talent DevelopmentNote: Certain of the above items represent Non‐GAAP financial measures that exclude certain items. Please refer to the “Reconciliation of GAAP and Non‐GAAP Information”attachment posted on February 18, 2016 under the "Investors ‐ Events and Presentations” section on PepsiCo’s website at www.pepsico.com to find disclosure and a reconciliationof the above non‐GAAP financial measures.44
Consistent, Strong PerformanceOrganic Revenue Growth (%)Consistent with long-term target544201320142015Note: Organic revenue represents a Non-GAAP financial measure that excludes certain items. Please refer to the “Reconciliation of GAAP and Non-GAAP Information” attachment posted on February 18,2016 under the “Investors – Events and Presentations” section on PepsiCo’s website at www.pepsico.com to find disclosure and a reconciliation of the above non-GAAP financial measure.45
Delivering ProductivityOn Track to Deliver Aggressive, butRealistic Productivity TargetsCore Operating Profit per Employee ( M)Rationalized 30 plants since 2013 8% since 201137.8 5B36.7 3B'12-'1434.9'15-'19201120132015Note: Core operating profit represents a Non-GAAP financial measure that excludes certain items. Please refer to the “Reconciliation of GAAP and Non-GAAP Information” attachment posted on February18, 2016 under the “Investors – Events and Presentations” section on PepsiCo’s website at www.pepsico.com to find disclosure and a reconciliation of the above non-GAAP financial measure.46
Gross and Operating Margin ExpansionCore Gross Margin (%) 285 bps expansion since 2012Core Operating Margin (%)(excluding A&M and R&D) 195 bps expansion since 201255.053.1 90bps201353.6 140bps22.1 55bps2014 80bps2015201322.4 35bps201423.2 80bps2015Note: The above items represent Non-GAAP financial measures that exclude certain items. Please refer to the “Reconciliation of GAAP and Non-GAAP Information” attachment posted on February 18,2016 under the “Investors – Events and Presentations” section on PepsiCo’s website at www.pepsico.com to find disclosure and a reconciliation of the above non-GAAP financial measures.47
Investing in Growth (I)A&M as a % of Revenue 110 bps since 20116.35.95.220112013201548
Investing in Growth (II)Strengths of our Current Global R&D ModelR&D ( mm) 44% increase since 2011754665GlobalStrategicPlatformsScalableLEADING INNOVATION & versal Lift& Adapt49
Resulting in Attractive Core, Constant-Currency EPS Growth Core Constant Currency EPS Growth (%)10Consistentwith or abovelong-termtarget99201320142015Note: The above items represent Non-GAAP financial measures that exclude certain items. Please refer to the “Reconciliation of GAAP and Non-GAAP Information” attachment posted on February 18, 2016under the “Investors – Events and Presentations” section on PepsiCo’s website at www.pepsico.com to find disclosure and a reconciliation of the above non-GAAP financial measures.50
Free Cash Flow Generation FCF as % of Core Net Income(excluding certain items)Cumulative Free Cash Flow( B, excluding certain items)Average: e: The above items represent Non-GAAP financial measures that exclude certain items. Please refer to the “Reconciliation of GAAP and Non-GAAP Information” attachment posted on February 18, 2016under the “Investors – Events and Presentations” section on PepsiCo’s website at www.pepsico.com to find disclosure and a reconciliation of the above non-GAAP financial measures.51
And Total Shareholder Return3-Year Cumulative TSR Growth (%)59.055.952.6S&P 500Note: For period ending December 31, 2015Consumer StaplesIndexPEP52
ConclusionWell-Positioned, Balanced PortfolioPerforming as we TransformClear PrioritiesManaging business for level and duration of returns53
54
cybersecurity incident or other disruption; PepsiCo's ability to implement shared services or utilize information technology systems and networks effectively; fluctuations or other changes in exchange rates; climate change or water scarcity, or legal, regulatory or market measures to address climate change or water