Transcription
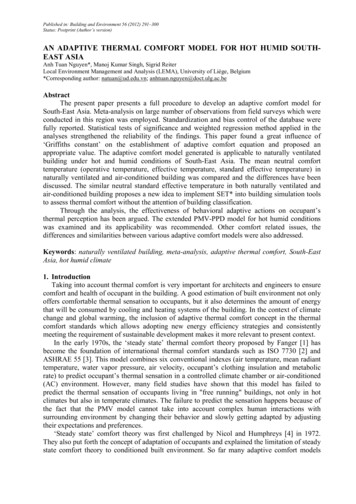
Learning to Predict Where Humans LookTilke JuddKrista EhingerFrédo DurandAntonio it.edutorralba@csail.mit.eduMIT Computer Science Artificial Intelligence Laboratory and MIT Brain and Cognitive SciencesAbstractFor many applications in graphics, design, and humancomputer interaction, it is essential to understand wherehumans look in a scene. Where eye tracking devices arenot a viable option, models of saliency can be used to predict fixation locations. Most saliency approaches are basedon bottom-up computation that does not consider top-downimage semantics and often does not match actual eye movements. To address this problem, we collected eye trackingdata of 15 viewers on 1003 images and use this database astraining and testing examples to learn a model of saliencybased on low, middle and high-level image features. Thislarge database of eye tracking data is publicly availablewith this paper.1. IntroductionFor many applications in graphics, design, and humancomputer interaction, it is essential to understand where humans look in a scene. For example, an understanding of visual attention is useful for automatic image cropping [16],thumbnailing, or image search. It can be used to directfoveated image and video compression [22], [7] and levelsof detail in non-photorealistic rendering [4]. It can also beused in advertising design, adaptive image display on smalldevices, or seam carving [14].Some of these applications have been demonstrated byincorporating eye tracking into the process: a user sits infront of a computer with an eye tracker that records theuser’s fixations and feeds the data into the method. However, eye tracking is not always an option. Eye trackers areexpensive and interactive techniques are a burden when processing lots of data. Therefore, it is necessary to have away to predict where users will look without the eye tracking hardware. As an alternative, models of saliency havebeen used to measure the conspicuity of a location, or thelikelihood of a location to attract the attention of human observers.Most models of saliency [9] [13] [8] are biologicallyFigure 1. Eye tracking data. We collected eye-tracking dataon 1003 images from 15 viewers to use as ground truth data totrain a model of saliency using machine learning. Gaze trackingpaths and fixation locations are recorded for each viewer (b). Acontinuous saliency map (c) is found by convolving a gaussianover the fixation locations of all users. This saliency map can bethresholded to show the most salient 20 percent of the image (d).inspired and based on a bottom-up computational model.Typically, multiple low-level visual features such as intensity, color, orientation, texture and motion are extractedfrom the image at multiple scales. After a saliency mapis computed for each of the features, they are normalizedand combined in a linear or non-linear fashion into a master saliency map that represents the saliency of each pixel.Sometimes specific locations are identified through a combination of winner-take-all and inhibition-of-return operations.Though the models do well qualitatively, the modelshave limited use because they frequently do not match actual human saccades from eye-tracking data, as in Fig 2,and finding a closer match depends on tuning many designparameters.
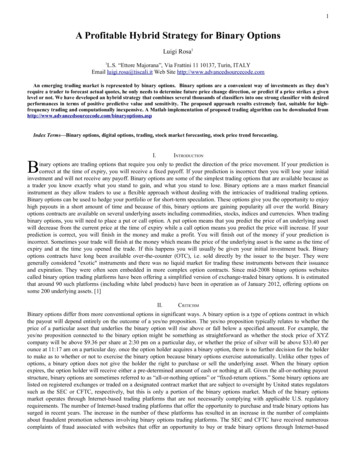
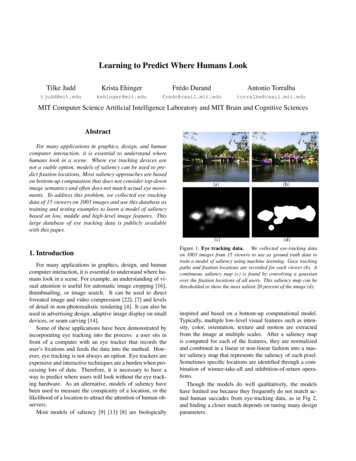
Figure 2. Current saliency models do not accurately predicthuman fixations. In row one, the low-level model selects brightspots of light as salient while viewers look at the human. In rowtwo, the low level model selects the building’s strong edges andwindows as salient while viewers fixate on the text.We make two contributions in this paper. The firstis a large database of eye tracking experiments with labels and analysis, and the second is a supervised learningmodel of saliency which combines both bottom-up imagebased saliency cues and top-down image semantic dependent cues. Our database consists of eye tracking data from15 different users across 1003 images. To our knowledge, itis the first time such an extensive collection of eye trackingdata is available for quantitative analysis. For a given image, the eye tracking data is used to create a “ground truth”saliency map which represents where viewers actually look(Fig 1). We propose a set of low, mid and high-level image features used to define salient locations and use a linearsupport vector machine to train a model of saliency. Wecompare the performance of saliency models created withdifferent features and show how combining all features produces the highest performing model. As a demonstrationthat our model can be used for graphics applications, weshow the DeCarlo and Santella [4] abstracted nonphotorealistic rendering technique adapted to use our saliency modelinstead of eye tracking input.Other researchers have also made some headway on improving low level saliency models. Bruce and Tsotsos [2]present a model for visual saliency built on a first principles information theoretic formulation dubbed Attentionbased on Information Maximization (AIM) which performsmarginally better than the Itti model. Avraham and Lindenbaum’s work on Esaliency [1] uses a stochastic modelto estimate the most probable targets mathematically. Themain difference between these works and ours is that theirmodels are derived mathematically and not trained directlyfrom a large database of eye tracking data. Cerf et al. [3]improve upon the Itti model by adding face detection to themodel. In addition to adding face detection, we add several other higher level features which provide us with anincreased performance over both the Itti and Cerf models.Our work is most closely related to the work of Kienzle et al. [10] who also learn a model of saliency directlyfrom human eye movement data. Their model consists ofa nonlinear mapping from a normalized image patch toa real value, trained to yield positive outputs on fixatedpatches, and negative outputs on randomly selected imagepatches. In contrast to our work, they only used low-levelfeatures. Furthermore, their training set comprises only 200grayscale natural scene images.In the specific situation of trying to predict where people look in a pedestrian search task Ehinger et al. [5] showthat a model of search guidance combining three sources:low level saliency, target features, and scene context, outperforms models based on any of these single sources. Ourwork focuses on predicting saliency in a free viewing context and creates a model with a larger set of image features.2. Database of eye tracking dataWe collected a large database of eye tracking data to allow large-scale quantitative analysis of fixation points andgaze paths and to provide ground truth data for saliencymodel research. The images, eye tracking data, and accompanying code in Matlab are all available on the web to facilitate research in perception and saliency across the visionand graphics community.2.1. Data gathering protocolWe collected 1003 random images from Flickr creativecommons and LabelMe [15] (Fig 3) and recorded eye tracking data from fifteen users who free viewed these images.The longest dimension of each image was 1024 pixels andthe other dimension ranged from 405 to 1024 with the majority at 768 pixels. There were 779 landscape images and228 portrait images. The users were males and femalesbetween the ages of 18 and 35. Two of the viewers wereresearchers on the project and the others were naive viewers. All viewers sat at a distance of approximately two feetfrom a 19 inch computer screen of resolution 1280x1024 ina dark room and used a chin rest to stabilize their head. Aneye tracker recorded their gaze path on a separate computeras they viewed each image at full resolution for 3 secondsseparated by 1 second of viewing a gray screen. To ensurehigh-quality tracking results, we checked camera calibration every 50 images. We divided the viewing into two sessions of 500 randomly ordered images. Each session wasdone on average at one week apart. We provided a mem-
Figure 3. Images. A sample of the 1003 images that we collectedfrom Flickr and LabelMe. Though they were shown at original resolution and aspect ratio in the experiment, they have been resizedfor viewing here.ory test at the end of both viewings to motivate users to payattention to the images: we showed them 100 images andasked them to indicate which ones they had seen before.We discarded the first fixation from each scanpath to avoidadding trivial information from the initial center fixation.In order to obtain a continuous saliency map of an image from the eye tracking data of a user, we convolve agaussian filter across the user’s fixation locations, similarto the “landscape map” of [20]. We also generate a saliencymap of the average locations fixated by all viewers. We canchoose to threshold this continuous saliency map to get a binary map of the top n percent salient locations of the image(Fig 1d).2.2. Analysis of datasetFor some images, all viewers fixate on the same locations, while in other images viewers’ fixations are dispersedall over the image. We analyze this consistency of humanfixations over an image by measuring the entropy of the average continuous saliency map across viewers. Though theoriginal images were of varying aspect rations, we resizedthem to 200x200 pixel images before calculating entropy.Figure 4 shows a histogram of the entropies of the imagesin our database. It also shows a sample of 12 saliency mapswith lowest and highest entropy and their corresponding images.Our data indicates a strong bias for human fixations to benear the center of the image, as is consistent with previouslyanalyzed eye tracking datasets [23] [19]. Figure 4 shows theaverage human saliency map from all 1003 images. 40%of fixations lie within the center 11% of the image; 70%of fixations lie within the center 25% of the image. Thisbias has often been attributed to the setup of the experimentwhere users are placed centrally in front of the screen, andto the fact that human photographers tend to place objectsof interest in the center of photographs [23].We use an ROC metric to evaluate the performance ofhuman saliency maps to predict eye fixations. Using thismethod, the saliency map from the fixation locations of oneFigure 4. Analysis of fixation locations. The first two rows showexamples of saliency maps made from human fixations with lowand high entropy and their corresponding images. Images withhigh consistency/low entropy tend to have one central object whileimages with low consistency/high entropy are often images withseveral different textures. Bottom left is a histogram of the saliencymap entropies. Bottom right is a plot of all the saliency mapsfrom human eye fixations indicating a strong bias to the centerof the image. 40% and 70% of fixations lie within the indicatedrectangles.user is treated as a binary classifier on every pixel in the image. Saliency maps are thresholded such that a given percent of the image pixels are classified as fixated and the restare classified as not fixated. The human fixations from theother 14 humans are used as ground truth. By varying thethreshold, the ROC curve is drawn and the area under thecurve indicates how well the saliency map from one usercan predict the ground truth fixations. Figure 5 shows theaverage ROC curve over all users and all images. Note thathuman performance is remarkably good: 60% of the groundtruth human fixations are within the top 5% salient areas ofa novel viewer’s saliency map, and 90 percent are within thetop 20 percent salient locations.As stated before, the fixations in the database have astrong bias towards the center. Because of this, we findthat simply using a Gaussian blob centered in the middleof the image as the saliency map produces excellent results,
Figure 5. In this ROC curve, human performance is very highdemonstrating that the locations where a human looks are veryindicative of where other humans have looked. The gaussian center model performs much better than chance because of the strongbias of the fixations in the database towards the center.as noted for other datasets as well by [23] [11]. We plot theROC curve for the center Gaussian on figure 5.In order to analyze fixations on specific objects and image features we hand labeled our image dataset. For eachimage, we labeled bounding boxes around any faces andtext, and indicated a line for the horizon if present. Using these labeled bounding boxes we calculated that 10%of fixations are on faces (Fig 6). Though we did not labelall people, we noticed that many fixations landed on people(including representations of people like drawings or sculptures) even if their faces were not visible. In addition, 11%of fixations are on text. This may be because signs are innately designed to be salient (for example a stop sign or astore sign are created specifically to draw attention). We usethese ground truth labels to study fixation prediction performance on faces and as a ground truth for face and horizondetection. We also qualitatively found that fixations fromour database are often on animals, cars, and human bodyparts like eyes and hands. These objects reflect both a notion of what humans are attracted to and what objects are inour dataset.By analyzing images with faces we noticed that viewersfixate on faces when they are within a certain size of theimage but fixate of parts of the face (eyes, nose, lips) whenpresented with a close up of a face (Fig 7). This suggeststhat there is a certain size for a region of interest (ROI) that aperson fixates on. To get a quick sense of the size of ROIs,we drew a rough bounding box around clustered fixationson 30 images. Figure 7 shows the histogram of the radiiof the resulting 102 ROIs. Investigating this concept is aninteresting area of future work.Figure 6. Objects of interest. In our database, viewers frequentlyfixated on faces, people, and text. Other fixations were on bodyparts such as eyes and hands, cars and animals. We found theabove image areas by selecting bounding boxes around connectedareas of salient pixels on an image overlayed with its 3% salientmask.Figure 7. Size of regions of interest In many images, viewers fixate on human faces. However, when viewing the close up of aface, they look at specific parts of a face rather than the face asa whole, suggesting a constrained area of the region of interest.On the right is a histogram of the radii of the regions of interest inpixels.3. Learning a model of saliencyIn contrast to previous computational models that combine a set of biologically plausible filters together to estimate visual saliency, we use a learning approach to train aclassifier directly from human eye tracking data.3.1. Features used for machine learningThe following are the low-, mid- and high-level featuresthat we were motivated to work with after analyzing ourdataset. For each image, we precomputed the features forevery pixel of the image resized to 200x200 and used theseto train our model.
Figure 9. Comparison of saliency maps. Each row of imagescompares the predictors of our SVM saliency model, the Ittisaliency map, the center prior, and the human ground truth, allthresholded to show the top 10 percent salient locations.Figure 8. Features. A sample image (bottom right) and 33 of thefeatures that we use to train the model. These include subbandfeatures, Itti and Koch saliency channels, distance to the center,color features and automatic horizon, face, person and car detectors. The labels for our training on this image are based on athresholded saliency map derived from human fixations (to the leftof bottom right).Low-level features Because they are physiologically plausible and have been shown to correlate with visual attention, we use the local energy of the steerable pyramid filters [17] as features. We currently find the pyramid subbands in four orientations and three scales (seeFig 8, first 13 images). We also include features used ina simple saliency model described by Torralba [12] andRosenholtz [13] based on subband pyramids (Fig 8,bottom left).Intensity, orientation and color contrast have long beenseen as important features for bottom-up saliency. Weinclude the three channels corresponding to these image features as calculated by Itti and Koch’s saliencymethod [9].We include the values of the red, green and blue channels, as well as the probabilities of each of these channels as features (Fig 8, images 20 to 25) and the probability of each color as computed from 3D color histograms of the image filtered with a median filter at 6different scales (Fig 8, images 26 to 31).Mid-level features Because most objects rest on the surface of the earth, the horizon is a place humans naturally look for salient objects. We train a horizon linedetector from mid-level gist features [12].High-level features Because we found that humans fixatedso consistently on people and faces we run the ViolaJones face detector [21] and the Felzenszwalb persondetector [6] and include these as features to our model.Center prior When humans take pictures, they naturallyframe an object of interest near the center of the image.For this reason, we include a feature which indicatesthe distance to the center for each pixel.3.2. TrainingIn order to train and test our model, we divided our setof images into 903 training images and 100 testing images.From each image we chose 10 positively labeled pixels randomly from the top 20% salient locations of the humanground truth saliency map and 10 negatively labeled pixels from the bottom 70% salient locations to yield a trainingset of 18060 samples and testing set of 2000 samples. Wefound that increasing the number of samples chosen per image above 10 did not increase performance. It is probablethat after a certain number of samples per image, new samples only provide redundant information. We chose samplesfrom the top 20% and bottom 70% in order to have samples that were strongly positive and strongly negative; weavoided samples on the boundary between the two. We didnot choose any samples within 10 pixels of the boundary ofthe image.Our tests on models trained using ratios of negative topositive samples ranging from 1 to 5 showed no change inthe resulting ROC curve, so we chose to use a ratio of 1:1.We normalized the features of our training set to havezero mean and unit variance and used the same normalization parameters to normalize our test data.We used the liblinear support vector machine to train amodel on the 9030 positive and 9030 negative training samples. We used models with linear kernels because we foundfrom experimentation that they performed as well as models with radial basis function kernels and models found with
multiple kernel learning [18] for our specific task. Linearmodels are also faster to compute and the resulting weightsof features are easier to understand. We set the misclassification cost c at 1. We found that performance was the samefor c 1 to c 10,000 and decreased when smaller than 1.3.3. PerformanceWe measure performance of saliency models in twoways. First, we measure performance of each model by itsROC curve. Second, we examine the performance of different models on specific subsets of samples: samples insideand outside a central area of the image and on faces.Performance on testing images In Figure 10, we see aROC curve describing the performance of different saliencymodels averaged over all testing images. For each image wepredict the saliency per pixel using a specific trained model.Instead of using the predicted labels (indicated by the signof wT x b where w and b are learned parameters and xrefers to the feature vector), we use the value of wT x bas a continuous saliency map which indicates how salienteach pixel is. Then we threshold this saliency map at n 1,3, 5, 10, 15, 20, 25, and 30 percent of the image for binarysaliency maps which are typically relevant for applications.For each binary map, we find the percentage of human fixations within the salient areas of the map as the measureof performance. Notice that as the percentage of the imageconsidered salient goes to 100%, the predictability, or percentage of human fixations within the salient locations alsogoes to 100%.We make the following observations from the ROCcurves: (1) The model with all features combined outperforms models trained on single sets of features and modelstrained on competing saliency features from Torralba andRozenholtz, Itti and Koch and Cerf et al. Note that we implement the Cerf et al. method by training an SVM on Ittifeatures and face detection alone. We learn the best weightsfor the linear combination of features instead of using equalweights as they do. (2) The model with all features reaches88% of the way to human performance. For example, whenimages are thresholded at 20% salient, our model performsat 75% while humans are at 85%. (3) The model with allfeatures except the distance to the center performs as wellas the model based on the distance to the center. This isquite good considering this model does not leverage anyof the information about location and thus does not at allbenefit from the huge bias of fixations toward the center.(4) The model trained on all features except the center performs much better than any of the models trained on singlesets of features. For example, at the 20% salient locationthreshold, the Torralba based model performs at 50% whilethe all-in-without-center model performs at 60% for a 20%jump in performance. (5) Though object detectors may beFigure 10. The ROC curve of performances for SVMs trained oneach set of features individually and combined together. We alsoplot human performance and chance for comparison.very good at locating salient objects when those objects arepresent in an image, it is not good at locating other salientlocations when the objects are not present. Thus, the overall performance for the object detector model is low andthese features should be used only in conjunction with otherfeatures. (6) All models perform significantly better thanchance indicating that each of the features individually dohave some power to predict salient locations.We measure which features add most to the model bycalculating the delta improvement between the center modeland the center model with a given set of features. We observe that subband features and Torralba’s features (whichuse subband features) add the greatest improvement. After that is color features, horizon detection, face and objectdetectors, and Itti channels.Performance on testing samples To understand the impact of the bias towards the center of the dataset for somemodels, we divided each image into a circular central anda peripheral region. The central region was defined by themodel based only on the feature which gave the distance ofthe example to the center. In this model, any sample fartherthan 0.42 units away from the center (where the distancefrom the center to the corner is 1) was labeled negative andanything closer was labeled positive. This is equivalent tothe center 27.7% of the image. Given this threshold, we di-
Figure 12. Stylization and abstraction of photographs DeCarloand Santella [4] use eye tracking data to decide how to render aphotograph with differing levels of detail. We replicate this application without the need for eye tracking hardware.for methods that would either have a high true negative rateoutside or a high true positive rate inside, such as the centerprior.Figure 11. Here we show the average rate of true positives and truenegatives for SVMs trained with different feature sets on differentsubsets of samples. This value is equivalent to the performance ofthe model if there were an equal number of positive and negativesamples in each subset.vided the samples to those inside and outside the center. Inaddition, we chose to look at samples that landed on facessince viewers were particularly attracted by them.In Figure 11 we plot performance of the model for different subsets of samples. The performance here is definedas the average of the true positive and true negative rates.This is equivalent to the performance of the model if therewere an equal number of positive and negative samples ineach subset.We make the following observations about the trainedmodels from this measure of performance: (1) Even thoughcenter model performs well over all the samples (both samples inside and outside the center), it performs only as wellas chance for the other subsets of samples. (2) While overall samples the performance of the center model and the allfeatures-without-center model perform the same, the latermodel performs more robustly over all subsets of samples.(3) Understandably, the model trained on features from object detectors for faces, people and cars performs better onthe subsets with faces. (4) The SVMs using the center priorfeature and the one using all features perform very well on1000 positive and negative random testing points but areoutperformed both in the inside and outside region. Thisparadox stems from the fact that 79% of the 1000 salienttesting points are in the inside region, whereas 75% of thenon-salient testing points are in the outside. One can showthat this biased distribution provides a lift in performanceDiscussion This eye tracking database allows us to quantify how consistent human fixations are across an image. Ingeneral, the fixation locations of several humans is stronglyindicative of where a new viewer will look. So far, computergenerated models have not matched humans’ ability to predict fixation locations though we feel we have moved a stepcloser in that direction by using a model that combines low,mid and high level features.Qualitatively, we learned that when free viewing images,humans consistently look at some common objects: Theylook at text, other people and specifically faces. If not people, they look at other living animals and specifically theirfaces. In the absence of specific objects or text, humans tendtowards the center of the image or locations where low-levelfeatures are salient. As text, face, person and other objectdetectors get better, models of saliency which include objectdetectors will also get better. Though all these trends are notsurprising, we are excited that this database will allow us tomeasure the trends quantitatively.3.4. ApplicationsA good saliency model enables many applications thatautomatically take into account a notion of human perception: where humans look and what they are interested in. Asan example, we use our model in conjunction with the technique of DeCarlo and Santella [4] to automatically create anon photorealistic rendering of a photograph with differentlevels of detail (Fig 12). They render more details at thelocations users fixated on and less detail in the rest of theimage. While they require information from an eye tracking device in order to tailor the level of detail, we use oursaliency model to predict locations where people look.
4. ConclusionIn this work we make the following contributions: Wedevelop a collection of eye tracking data from 15 peopleacross 1003 images and have made it public for researchuse. This is the largest eye tracking database of natural images that we are aware of and permits large-scale quantitative analysis of fixations points and gaze paths. We usemachine learning to train a bottom-up, top-down model ofsaliency based on low, mid and high-level image features.We demonstrate that our model outperforms several existing models and the center prior. Finally, we show an example of how our model can be used in practice for graphicsapplications.For future work we are interested in understanding theimpact of framing, cropping and scaling images on fixations. We believe that the same image cropped at differentsizes will lead viewers to fixate on different objects in theimage and should be more carefully examined.Acknowledgments This work was supported by NSFCAREER awards 0447561 and IIS 0747120. Frédo Durand acknowledges a Microsoft Research New Faculty Fellowship and a Sloan Fellowship, in addition to Royal DutchShell, the Quanta T-Party, and the MIT-Singapore GAMBITlab. Tilke Judd was supported by a Xerox graduate fellowship. We thank Aude Oliva for the use of her eye trackerand Barbara Hidalgo-Sotelo for help with eye tracking. Wethank Nicolas Pinto and Yann LeTallec for insightful discussions, and the ICCV reviewers for their feedback on thiswork.References[1] T. Avraham and M. Lindenbaum. Esaliency: Meaningful attention using stochastic image modeling. IEEE Transactionson Pattern Analysis and Machine Intelligence, 99(1), 2009.[2] N. D. B. Bruce and J. K. Tsotsos. Saliency, attention, andvisual search: An information theoretic approach. Journalof Vision, 9(3):1–24, 3 2009.[3] M. Cerf, J. Harel, W. Einhauser, and C. Koch. Predictinghuman gaze using low-level saliency combined with face detection. In J. C. Platt, D. Koller, Y. Singer, and S. T. Roweis,editors, NIPS. MIT Press, 2007.[4] D. DeCarlo and A. Santella. Stylization and abstraction ofphotographs. ACM Transactions on Graphics, 21(3):769–776, July 2002.[5] K. Ehinger, B. Hidalgo-Sotelo, A. Torralba, and A. Oliva.Modeling search for people in 900 scenes: A combinedsource model of eye guidance. Visual Cognition, 2009.[6] P. Felzenszwalb, D. McAllester, and D. Ramanan. A discriminatively trained, multiscale, deformable part model.Computer Vision and Pattern Recognition, 2008. CVPR2008. IEEE Conference on, pages 1–8, June 2008.[7] W. S. Geisler and J. S. Perry. A real-time foveated multiresolution system for low-bandwidth video communication. Inin Proc. SPIE, pages 294–305, 1998.[8] X. Hou and L. Zhang. Saliency detection: A spectral residualapproach. Computer Vision and Pattern Recognition, IEEEComputer Society Conference on, 0:1–8, 2007.[9] L. Itti and C. Koch. A saliency-based search mechanism forovert and covert
humans look in a scene. Where eye tracking devices are not a viable option, models of saliency can be used to pre-dict fixation locations. Most saliency approaches are based on bottom-up computation that does not consider top-down image semantics and often does not match actual eye move-ments. To address