Transcription
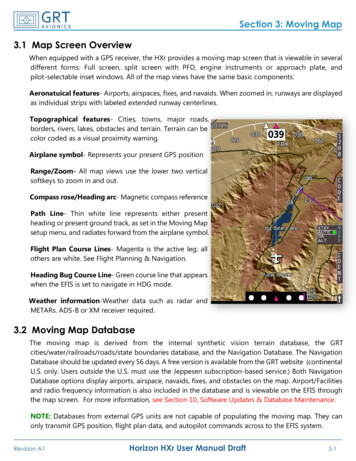
Fig. 7: Regional structural map of the top of the Stark Shale, with Missouri Flats Waterflood Unit indicated with black polygon. The MFWUlies on a SSE-plunging anticline that is parallel to a similar structure lying to the south. Elevation contours are in feet, and datum is sea level.37
Fig. 8: Sub-regional structural map of the top of the Stark Shale, with Missouri Flats Waterflood Unit indicated byblack polygon. Contours show subtle but distinct culminations of the crest of the anticline, but productive wells to thesoutheast are structurally lower than those to the NW, indicating a lack of overall closure in the field. Elevationcontours are in feet, and datum is sea level.38
Fig. 9: Southwest-northeast cross-section through Merit Energy Company Missouri Flats Waterflood Unit, with insetmap showing orientation. Polygons in depth tracks indicate perforations.39
Fig 10: Northwest-southeast cross-section through Merit Energy Company Missouri Flats Waterflood Unit, with inset map showing orientation.Polygons in depth tracks indicate perforations. The southeastern-most well on the right is structurally lower than the non-productive well on the left(northwest). However, the logs show little porosity in the northwest well.40
Fig 11: Northwest-southeast cross-section through Merit Energy Company Missouri Flats Waterflood Unit, withinset map showing orientation. This cross-section shows the separate but subtle closures along the crest of theanticline. Again, the well on the left (northwest) is structurally higher than wells to the southeast, but lacksdevelopment of pores. Polygons in depth tracks indicate perforations.41
Fig. 12: Comparison of porosity in two northwestern-most wells from cross-section in Figure 11. Porosityis in right-hand track of each log; solid line in left log, dashed line in right. Vertical lines indicate 10%porosity – less to the right, greater to the left. The I, J, and K zones are porous in the well on the right, butnot in that on the left. Polygons in depth tracks indicate perforations.42
Fig. 13: Thickness (upper) and average porosity (lower) maps of net pay in the LKC 160 (I-zone) inthe Waterflood Unit. Porosity is well developed in the area of thickest reservoir, but declies to thenorth and east. Highlighted wells completed in the I-zone.43
Fig. 14: Thickness (upper) and average porosity (lower) maps of net pay in the LKC 180 (J-zone) inthe Waterflood Unit. Area of greatest thickness roughly underlies the area of greatest thickness inthe I zone. Highlighted wells completed in the J-zone.44
Fig. 15: Thickness (upper) and average porosity (lower) maps of net pay in the LKC 200 (K-zone)in the Waterflood Unit. Greatest thickness is somewhat east of that in I and J zones but overlapping.Highlighted wells completed in the K-zone.45
Fig. 16: Thickness (upper) and average porosity (lower) maps of net pay in the LKC 220 (L-zone)in the Waterflood Unit. Greatest thickness and highest porosity are in SW portion of the area, anddo not coincide with high porosity and great thickness in the I, J, and K zones. Highlighted wellscompleted in the L-zone.46
no definable overall spatial trend to porosity in the waterflood unit. The LKC 220 or L zone, thelowest zone, has much lower net pay thicknesses than the other three zones.8. DATA AVAILABILITYOil production data for the Missouri Flats Northeast and Missouri Flats Northwestoilfields is available online at the KGS website www.kgs.ku.edu, including annual andcumulative data for the entire field, production for individual leases, and number of producingwells in each year. Well logs, formation top data, and well completion forms, which includeperforation data, are also available online from the KGS. Data on water injection and productionwere not available for consideration in constructing this report nor was information on well-bywell production; presumably such data are available from the operators. Core data are notavailable, although existing correlations might allow estimation of permeability from porosity.No pressure data or estimates of original oil in place were provided.9. SUITABILITY FOR ENHANCED RECOVERYAlthough oil production numbers show that the waterflood in the Missouri FlatsWaterflood Unit has been successful, no water injection or production data are available to theinvestigators. The unit has four reservoir zones, and most of the wells in the unit are notcompleted in all four of them. Without more data it is not possible to allocate oil productionamong the various zones and wells. Without such allocation, and also allocation of injected andproduced water, accurate calculations of remaining oil in place for the several zones are notpossible. Comparison of water injection to production could provide insight into other importantfactors that affect the viability of the unit for a surfactant-flooding demonstration project, such asthe presence of permeability barriers or whether injected water flowed out of the unit in places.In the current arrangement with co-mingled production, any injected chemical surfactantswould be dispersed and produced unevenly, thus lowering the efficiency of flooding.Alternatively, one zone of the four could be proposed for a demonstration project, but this wouldrequire records, tests, or modeling to discover which of the four zones had the most oil left.Perforations in the other three zones would need to be squeezed off, perhaps leaving producibleoil behind. Co-mingling of production is an undesirable characteristic in a candidate for achemical flooding demonstration project, because it is not possible to determine where47
concentrations of remaining oil reside. Ideally, a single, well-defined reservoir interval is soughtfor the demonstration project as this would assure maximum effectiveness of flooding.10. CONCLUSIONThe Missouri Flats Waterflood Unit covers parts of two oilfields and produces oil fromfour Upper Pennsylvanian limestone reservoir zones. Production began in 1975 and cumulativeproduction is over 1.3 million barrels of oil. Merit Energy Company has owned the unit since2008. The reservoir zones are on local structural high of an east-southeast plunging anticline thatdisplays a porosity seal as it rises to the northwest. Net pay thickness of individual reservoirzones reaches a maximum of 20 feet based on 10% porosity cutoff. Waterflooding successfullyboosted oil production starting in 2003, but oil production data and water injection andproduction data on a well-by-well and zone-by zone basis were unavailable at the time this reportwas written.Although waterflooding has been a demonstrated success, the unit is not a strongcandidate for any surfactant flooding demonstration project. The presence of multiple reservoirzones, not perforated in all wells, would lead to decreased efficiency of surfactant floodingcompared to a field with a single reservoir zone. A single reservoir zone could be chosen out ofthe four in the unit, but this would require testing to decide which one to use, and shutting off theother three zones. While surfactant flooding may be deemed viable for this unit in the future,the present project seeks to demonstrate the effectiveness of surfactant flooding as efficiently aspossible and so a stronger candidate for the project would ideally have a single, well definedreservoir zone in order to assure a greater chance of maximum efficiency of the demonstration.11. REFERENCEMerit Energy Co., 2008, Intent to Drill Form, Beesley B2 Well (API# 15-063-21733), retrievedfrom http://www.kgs.ku.edu/PRS/Documents2/2008 08 01 KCC/081108 Beesley B 2.pdf6-4-2010.48
TREMBLEY OILFIELD, RENO COUNTY, KANSASPeter J Senior and Anthony W. WaltonDepartment of Geology, The University of Kansas2. INTRODUCTIONTrembley oilfield is a small field that covers 560 acres in two sections in Reno County incentral Kansas. The field was discovered in 1978, and production continues to the present.Berexco Inc. is the current operator. Trembley oilfield produces from the Hertha LimestoneFormation of the Upper Pennsylvanian Kansas City Group at an average depth of 3491 feet. TheOOIP has been estimated at 2,049,759 barrels. No water influx into the reservoir was apparentduring primary production, indicating a fluid-expansion drive (Waterflood Feasibility Study,1989). This report provides a summary of information on the field location, drilling andproduction history, geology, and suitability for enhanced recovery.2. LOCATIONTrembley oilfield lies approximately sixty miles northwest of Wichita and twenty milessouthwest of Hutchinson (Figure 1). The small town of Arlington lies just to the southeast, andthe north fork of the Ninnescah River flows through the field. Figure 2 shows the Trembley fieldin relation to surrounding fields. The defined field occupies the SW quarter of Section 27 and inSection 34, it occupies the west half of the section, plus the west half of the NE quarter (KansasGeological Survey (KGS) website, http://www.kgs.ku.edu/, 7/17/10). The Trembley Unit,operated by Berexco, encompasses 800 acres: all of the Trembley field, plus the rest of Section34 (Figure 2, 3). Documents limit the effective area of the waterflood to the SESW Section 27and the E/2 NW and SWSWNE Section 34, T24SR8W, with a total area of 148 acres withgreater than 4’ of net pay thickness (CO2 EOR Demonstration Proposal, 1999).3. METHODSThis report was constructed by analyzing data in the public domain and posted on thewebsite of the Kansas Geological Survey (KGS) along with that provided by the field operatorsdirectly to the investigators. The major methods were use of well logs to determine the49
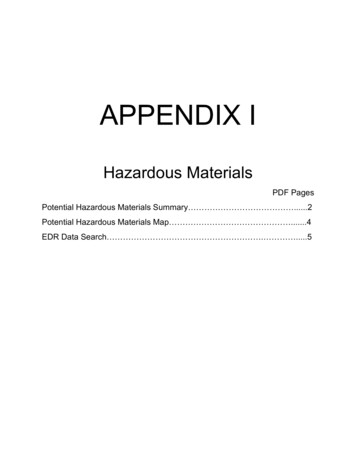
configuration of key horizons to create geologic maps and cross-sections of the reservoir. Thedata and logs were imported into Petra , a subsurface GIS program and analyzed using standardtechniques. Production history, quantities, and rates were provided by the operators ordownloaded from the website of the KGS.Fig. 1: Regional map indicating location of Trembley oilfield.Modified from www.kgs.ku.edu 5-5-2010.Fig. 2: Sub-regional locator map for Trembley oilfield, fromwww.kgs.ku.edu 5-5-2010.50
4. DISCOVERY & DEVELOPMENT HISTORYDiscovery of the field occurred with completion of the Trembley #1 well (API # 15-15520477) in February 1978 by National Cooperative Refinery Association (NCRA). The discoverywell was tested at 192 BOPD from perforations in the Hertha Limestone at 3482 to 3492 feet.Subsequent exploratory drilling in 1978 saw completion of four new producing wells and threedry holes. Development drilling in the Trembley field in 1979 resulted in one new oil well andthree more dry holes. The decade of the 1980s saw one oil well completed in 1982 and dry holesdrilled in 1983 and 1984. In 1993 a dry hole was drilled, and in October of 1999 one new oilwell was completed. Since 1999 no new wells have been drilled.An older well was recompleted in 1999: the Trembley Unit ‘X’ 9 (API # 15-155-205820001) was originally the Barnes 3 well, a dry hole that was drilled as a step-out from the nearbyAbbyville Southwest field (Table 1). The result of over twenty years of development drilling,from 1978 to 1999, has been a good definition of the spatial extent of the reservoir; dry holesdelineate the area within which productive reservoir rock is found, especially around the northernpart of the field (Figure 3).6.PRODUCTION HISTORYOver three decades of oil production from Trembley oilfield, 1978 to 2010, have resulted ina cumulative total of 528,340 barrels of oil produced (Table 2 and Figure 4), or 25.8% of the OOIPreported in the Waterflood Feasibility Study (1989). The primary phase of production lasted fromdiscovery in 1978 to February 1995, when waterflooding began. Primary recovery was initiallyhighly successful, with annual production reaching 72,006 barrels from four wells in 1979, butproduction dropped rapidly to below 10,000 barrels per year by 1984. Annual production numberscontinued to decline until 1995 when it hit a low point, with only 1,943 barrels. The secondaryrecovery phase has also proven highly successful. The reservoir showed a strong initial responseto waterflooding, reaching an all-time high in annual oil production of 72,430 barrels in 1997.Two wells in the southern part of the field however, the Trembley Unit ‘X’ 6 and ‘X’ 7 (API # 15-51
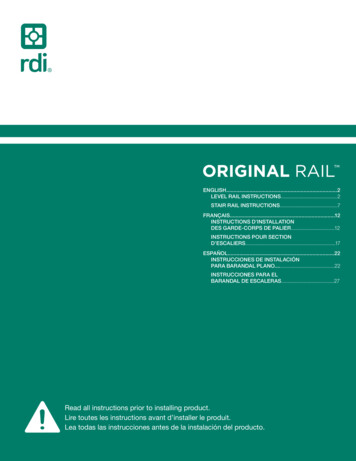
Fig. 3: Distribution of wells in and around Trembley oilfield. Blue outline shows approximate unit boundary.52
Table 1: Wells in Trembley oilfield, from www.kgs.ku.edu 5-5-10. Wells in Berexco’s Trembley Unit are highlighted. In yellowAPI 20495-000115-155-20496LEASE & WELL NTREMBLEY 1TREMBLEY UNIT ‘X’ 334-24S-8WSW SW NENWNational CooperativeRefinery Association(NCRA)23-Feb-7834-24S-8WC SE NWTREMBLEY 'A' 1TREMBLEY UNIT ‘X’ 4NCRABerexco, gOILP&AConverted to EOR WellAuthorized Injection WellEORE2 W2 NWNWS2 SE SWW2 NW NEC NE SW****CORED****TREMBLEY 'A' 55-20537-0001TREMBLEY UNIT ‘X’ 1BARNES 1TREMBLEY 'B' 1TREMBLEY UNIT 155-20557-0001BARNES 2Trembley Unit ‘X”534-24S-8W15-155-20565TREMBLEY 227-24S-8WSE SW SWTREMBLEY 'B' 2TREMBLEY UNIT ‘X’734-24S-8WW2 NE NWSETREMBLEY 'A'315-155-2059921-Apr-7818-Apr-78HINKLE OIL CO.NCRANCRABerexco, &APlugged and AbandonedOILD&AOILEOROILProducingP&AConverted to EOR WellP&ANCRABerexco Inc.14-Dec-78HINKLE OIL & NCRA18-Dec-78NCRABerexco, Inc.29-Mar-7934-24S-8WSW NE SWNWNCRA27-Feb-7927-Feb-79D&APlugged and AbandonedGINN 127-24S-8WS2 SE NWL G STEPHENSON &CO., INC.16-Jul-7916-Jul-79D&APlugged and Abandoned15-155-20581HERRIMAN 127-24S-8WNW SW 9-0001TREMBLEY UNIT 'X' 234-24S-8WNE NE NWNCRABerexco, Inc.D&AOIL14-Jul-8215-155-20927HARRIMAN 127-24S-8WSW SW SE15-155-21016LOCKE 133-24S-8WSE SE SEQUIVERA EXPLMALLONEEWARREN LTD15-155-21266Kimbell 1-33-24S-8W15-155-21440TREMBLEY UNIT ‘X’834-24S-8W15-155-20582-0001TREMBLEY UNIT ‘X’ 934-24S-8W15-155-01019-0001FOSTER 215-155-19028-0001TREMBLEY 'X' 20571****CORED****W2 SW NENCRAEOR18-Dec-78D&AOILEORConverted to EOR WellAuthorized Injection WellPlugged and AbandonedConverted to EOR WellAuthorized Injection WellConverted to EOR WellAuthorized Injection lugged and AbandonedStelbar Oil Co.1-Jul-931-Jul-93D&AP&ABEREXCO INC13-Oct-99OILProducingW2 SE NEBEREXCO INC.16-Oct-99OILProducing27-24S-8WNE NE NEHONEY OIL CO., INC.SWDP&A34-24S-8WSESENWNEBerexco, Inc.OILProducingSE NW NWNESE SE NENW5313-Dec-011-Dec-55P&A
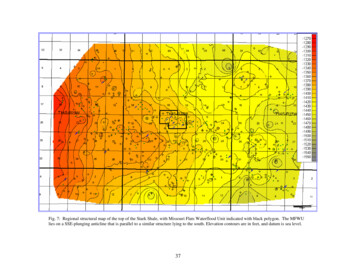
Table 2: Annual and cumulative oil production data, from www.kgs.ku.edu, 5-5-10. 2008 isthe most recent year for which complete data were 9165666666666654444CUMULATIVE BBLS10,000,0001,000,000100,000OIL PRODUCTIONWATER INJECTIONWATER PRODUCTION540806Fig. 4: Cumulative oil production and water injection for Trembley oilfield. Water injection andproduction data from the field operator, oil production data from the 8219198019197810,000
1,000,000OIL PRODUCTIONWATER INJECTIONBBLS/YEARWATER 61994199219901988198619841982198019781,000Fig. 5: Annual oil production and water injection for Trembley oilfield. Water injection andproduction data from the field operator, oil production data from the KGS.155-20537 and 15-155-20566) have been abandoned due to poor performance. The Trembley6X was temporarily abandoned in October 1999 and the 7X in April 2007 according to informationprovided by Berexco Inc. These wells apparently lie south of a permeability barrier in the field,which limits their communication with the wells to the north (CO2 EOR Demonstration Proposal,1999). Since 2001, annual production of water in the field has been close to annual injection, andannual oil production has tapered off continuously since 1997 (Figure 5), but still remainsconsiderably higher than the previous low point.6. GEOLOGYThe reservoir rock at the Trembley oilfield is the Hertha Limestone, the basal formationof the Upper Pennsylvanian Kansas City Group in Kansas (Figure 6). In the field area the Herthais an oolitic limestone, with moldic porosity development resulting from diagenetic dissolutionof ooids (Waterflood Feasibility Study, 1989). Connectivity between the moldic pores results inpermeability in the reservoir. Figure 7 shows a typical well-log response of the Hertha at55
Trembley oilfield. Neither the top of the Hertha Limestone nor the prominent markers of theStark and Hushpuckney shale members have been picked in most of the wells used for mappingin this report. However, the Hertha Limestone is near the base of the Kansas City Group, sostructural maps of that horizon are a close approximation of the structure of the HerthaLimestone (Figures 8 and 9).A large dome-shaped structural high covers about nine sections in Township 24 South,Range 8 West and contains the Morton and Morton Southeast oilfields at its highest part;Trembley oilfield lies on the southeastern extension of this larger structure (Figure 8). Thestructural trend of Trembley is a southeast-plunging anticlinal nose (Figure 9) that shows goodstructural closure in three directions. Cross-sectional views through Trembley show that thestructure is closed to the southwest and northeast (Figure 10), and to the southeast, but not to thenorthwest (Figure 11).Fig. 6: Stratigraphy of the Upper Pennsylvanian Kansas City Group in Kansas,from , http://www.kgs.ku.edu/PRS/petroDB.html, 5-5-10.56
Fig. 7: Well-log showing gamma ray, neutron, and resistivity curves through the reservoir intervalin the Hertha Limestone (red box) in the Trembley ‘A’ 1 well (API # 15-155-20495) ,http://www.kgs.ku.edu/PRS/petroDB.html.57
Fig. 8: Structure map of the base of the Kansas City Group in the Trembley field area. Elevation contoursare given in feet; datum is sea level. Trembley unit outlined in blue. Trembley North, Morton Southeast,and Morton fields occupy the pronounced anticline centering in Sections 17, 21 and 28; Abbyville fieldoccupies two domes to the NE of Trembley Field.58
Fig. 9: Close-up view of structure map of the base of the Kansas City Group in the Trembley field area.Trembley unit outlined in blue. Elevation contours are given in feet below sea level.59
Fig. 10: Southwest-northeast cross-section through Trembley oilfield. Inset map shows location.60
Fig. 11: Northwest-southeast cross-section through Trembley oilfield. Inset map shows location.61
If the structural trap is open to the northwest, updip direction, then a stratigraphiceffect must have prevented further migration of oil out of the field. A contour map ofporosity (Figure 12) and a comparison of well logs (Figure 13) show how porositypinches out around the reservoir. The porosity pinch-out is especially well constrainedby dry holes in the north and northwest of the field. Stratigraphic pinch-out of porositycombines with a structural nose to create a combination anticlinal and stratigraphic trap.The process of waterflooding in Trembley led to discovery of a permeabilitybarrier in the southern part of the field during secondary recovery (Figure 12). Early inthe waterflooding process two injectors, the Trembley 6X and 7X (API #s 15-155-205370001 and 15-155-20566-0001) built up pressure faster than expected. During the winterof 1996 a freeze-up stopped the water injection process, and neither well’s shut-inpressure dropped appreciably, while other wells saw significant decreases (Berexco Inc.Interoffice Memo, 1996). This difference in pressure decrease indicated a lack of flowfrom the southern part of the field to the northern part, which could only be explained bysome sort of permeability barrier in the reservoir. Due to the presence of thispermeability barrier the 6X injection well was converted to a producer for a time beforefinally being plugged and abandoned in December of 2008. No data considered inpreparing this report give any indication of further reservoir compartmentalization.62
Fig. 12: Porosity isopach map of Trembley oilfield showing thickness of rock with porosity exceeding10%. Note inferred permeability barrier; refer to text for discussion. Courtesy of Berexco Inc.,contour interval of 6 ft.63
Fig. 13: Comparison of neutron and deep resistivity curves for well logs from the Trembley A#2 and Trembley #1 wells. Inset map showspositions of the two wells. Porosity in the Hertha Limestone pinches out to the northwest, where the Trembley A#2 well shows only 6 to 8%porosity and no pay, while the Trembley #1 to the southeast has 11 to 23% porosity.64
7. PETROPHYSICSTable 3 summarizes drill-stem test data were provided by Berexco Inc. Drill-stemtests were interpreted to show an initial reservoir pressure of 946 psig. For petrophysicalcalculations, initial reservoir temperature was 110 F, and a cementation factor of 2, andRw of 0.4 were assumed (Waterflood Feasibility Study, 1989). Volumetric reservoirfluid parameters (Table 4), volumetric and pressure data (Tables 5 and 6), and viscositydata (Table 7) are available. Porosity-permeability relationships from core studies showwide scatter, little correlation, and substantial variation from well to well (Figures 14 and15). For example in Figure 15 porosity of about 30% shows permeability ranging fromjust a few to almost 100 millidarcys. Carbonate reservoirs with oomoldic porosity, suchas the Hertha Limestone at Trembley, can display great heterogeneity in porosity andpermeability, sometimes over very short distances.In 1980, Exoil Services of Golden, Colorado, ran tests on core samples tosimulate flooding the reservoir with different fluids. Two-inch radial discs from coreswere prepared by cold-flushing with hexane, drying and then saturating with producedwater. Water was displaced with filtered lease crude in a series of injection pulses atelevated pressure and reservoir temperature. After injection with nitrogen to simulateprimary production, tests were run to simulate flooding with water, polymer, and causticpolymer by injecting each of these fluids into the core samples. Caustic-polymerflooding produced the lowest recovery, while waterflooding and polymer floodingrecovered approximately equal amounts. Polymer flooding resulted in faster cumulativerecovery of the same amount of oil than waterflooding (Waterflood Feasibility Study,1989).65
Well API# and NameDepthRemarks15-155-20507Trembley 1x3460-3525Rec. 3MCF gas, 60' mud, 790' MFO,124-174, 1103, 331-399, 93915-155-20879-0001Trembley 2x3500-3536Rec. 60' GCM, 300' HGCM, 165' FroggyOil, 95-95, 259, 122-109, 27315-155-20477Trembley 3x3465-3500GTS 12 min., 23.3MCFD, rec. 1800' oil,118-247, 1421, 296-118, 140115-155-20495-0001Trembley 4x3469-3501GTS 35 min., TSTM, rec. 315' OGCM,310' gas, 310' oil & gas, 1191, 81, 97,111115-155-20557-0001Trembley 5x3487-3510GTS 15 min., rec. 540' HOGCM, 1560'oil15-155-20537-0001Trembley 6x3480-3506rec. 2950' gas, 110' MCO, 60'OGCM,30' SOGCM15-155-20566-0001Trembley 7x3488-3520rec. 120' foamy oil, 60' SOGCM, 60'VHOGCM, FSIP 781psi15-155-21440Trembley 8x3486-3510rec. 255' CO, 120' GMCO; available atKGS websiteTable 3: Summary of drill-stem tests done in eight Trembley wells; data provided byBerexco Inc.PARAMETERSATURATION PRESSURE(BUBBLE POINT PRESSURE)946 PSIG @ 110 FSPECIFIC VOLUME AT SATURATIONPRESSURE: (FT3 / LB.)0.02016 @ 110 FTHERMAL EXPANSION OF SATURATED OIL@ 2000 PSIVOLUME @ 110 F / VOLUME @70 F 1.01433FROM 2000 PSI TO 1700 PSI 7.03 X 10⁻⁴COMPRESSIBILITY OF SATURATED OIL ATRESERVOIR TEMPERATUREFROM 1700 PSI TO 1500 PSI 7.36 X 10⁻⁶FROM 1500 PSI TO 946 PSI 7.64 X 10⁻⁶Table 4: Volumetric reservoir fluid parameters calculated from an oil sample from the Trembley#1 well (API # 15-155-20477) by Core Laboratories, Dallas, TX (Waterflood Feasibility Study,1989).66
PRESSURE(PSIG)RELATIVE VOLUME: V/Vsat in barrels atindicated pressure per barrel at saturationpressure (946 PSIG).Y 2.9922.7722.5722.363Table 5: Pressure-Volume relations of oil sample from Trembley #1 well (API # 15-15520477) at 110 F by Core Laboratories, Dallas, TX (Waterflood Feasibility Study, 1989).67
DIFFERENTIAL VAPORIZATION @ 110 LRATIO ME(3)1.1041.1471.2161.3521.6312.3794.3753.357OIL 80990.8185DEVIATIONFACTOR CREMENTALGAS GRAVITY0.7980.7870.7620.7440.7680.8851.317Gravity of Residual Oil: 37.3 API at 60 F1:2:3:4:Cubic feet of gas at 14.65 psia and 60 F per barrel of residual oil at 60 FBarrels of oil at indicated temperature and pressure per baller of residual oil at 60 FBarrels of oil plus liberated gas at indicated temperature and pressure per barrel of residual oil at 60 FCubic feet of gas at indicated pressure and temperature per cubic foot at 14.65 psia and 60 FTable 6: Differential vaporization data for oil sample fromTrembley #1 well (API # 15-155-20477) by Core Laboratories, Dallas, TX(Waterflood Feasibility Study, 1989).68
139149.1166.1188.7285.6Table 7: Viscosity data for oil sample from Trembley #1 well at 110 F(API # 15-155-20477) by Core Laboratories, Dallas, TX (WaterfloodFeasibility Study, 1989).69
CORE VS LOG POROSITY3530LOG POROSITY %25201510y 0.4996x 11.7782R 0.3375005101520253035CORE POROSITY %CORE VS LOG POROSITY35y 0.7203x 6.52162R 0.5946LOG POROSITY %30252015TREMBLEY A110TREMBLEY A3TREMBLEY B25Linear (TREMBLEY A1)0010203040CORE POROSITY %Fig. 14: Core versus log porosity for three cored wells in Trembley oilfield, reproduced from datagenerated by Core Laboratories, Dallas, TX (Waterflood Feasibility Study, 1989). Trendline in lowerfigure is for Trembley A1 well data points only.70
CORE POROSITY VS AVG PERM100AVG PERM md1010.1y 0.1512e0.1503x2R 0.45010.0105101520253035CORE POROSITY %CORE POROSITY VS AVG PERM100AVG PERM md101TREMBLEY A10.1TREMBLEY A3y 0.9117e0.0964xR2 0.3125TREMBLEY B2Expon. (TREMBLEY A1)0.01010203040CORE POROSITY %Fig. 15: Core porosity versus average core permeability for three cored wells inTrembley oilfield, reproduced from data generated by Core Laboratories, Dallas, TX(Waterflood Feasibility Study, 1989). Trendline in lower figure is for Trembley A1 welldata points only.71
8. DATA AVAILABILITYOil production data for the Trembley oilfield is available online at the KGS websitewww.kgs.ku.edu, including annual and cumulative data and number of producing wells in eachyear. Data made available by the field operator include water injection rates ranging in timefrom the inception of the waterflood through 2008, primary production data, porosity data fromseveral wells, drill-stem test results, and a general geologic description of the reservoir. Welllogs, completion reports, and formation top data are available online from the KGS, and coresfrom four wells in Trembley are available at the KGS in Lawrence, Kansas.9. SUITABILITY FOR ENHANCED RECOVERY OPERATIONSTrembley oil field has both attractive features as a target for enhanced recovery and somequestions. Favoring the field as a candidate for EOR are its extent, which is well-defined bywells and subsurface structure, its single reservoir bed, the L-zone or Hertha Limestone of theKansas City Group, and its good response to waterflooding. Production rose from 1,943 barrelsin 1995 to 72,430 bbls in 1997, higher even than during early flush production, afterwaterflooding began. Flooding tests on cores from the field were favorable. However, thepermeability barrier identified during waterflood operations raises the question of whetheradditional heterogeneities of permeability may exist. The field has produced only 25.8% of theOOIP, despite having been under waterflood for 15 years. Admittedly, it is not clear how muchof the OOIP is trapped south of the permeability barrier, and now isolated from the waterflood.This situation may have reduced the apparent recovery factor. More extensive analysis ofproduction is necessary to determine the amount and distribution of remaining oil in place in theactive waterflood. The plot of core permeability vs. core porosity shows a low degree ofcorrelation between those properties. This suggests that oil may be trapped in porous, butimpermeable rock,
Fig. 8: Sub-regional structural map of the top of the Stark Shale, with Missouri Flats Waterflood Unit indicated by . Merit Energy Co., 2008, Intent to Drill Form, Beesley B2 Well (API# 15-063-21733), retrieved . (API # 15-155-20582-0001) was originally the Barnes 3 well, a dry hole that was drilled as a step-out from the nearby Abbyville .