Transcription
eBIC: electronBioImaging CentreDan Clare : Single Particle Data collectionWellcome Trust/MRC/BBSRC Strategic AwardHelen Saibil, Kay Grünewald, David Stuart,Gerhard Materlik
Microscopes at Diamond 3 FEI transmission electron microscopes Krios 1 and Krios 2 (300 KeV) are both offeredas part of the user program Talos (200 KeV) installation is almost complete Both Krios microscopes are equipped with thelatest generation of direct electron detectors Quantum-K2 (400 fps – 40 fps) and Falcon II (17 fps) All microscopes have Volta Phase Plates - Notintegrated into single particle software yet!
Data collection at Diamond As of the 02/09/16 - 129 external visits, 62 unique, 354.9 TB of data generated Averaging just over 2TB/ 48 hr session with the Falcon II direct electron detector –single particle only The first facility in the world to have the bioquantum-K2 Summit detector integratedwith EPU and averaging 2.4 Tb/ 48 hr session Multiple 3Å reconstructions comprising multiple submitted/accepted manuscripts. Two reconstructions at better than 3Å In the *first year* of operation we will have provided 220 days for external users,over delivering by 40%. (Krios 1)
Typical User Day Session starts at 9 - 9.30: (most people are early!) 9.15 - 10.15: Load grids into the auto grid cartridges and Krios cassette 10.20 - 10-30: Load grids into the Krios 10.30 – 12: Survey grids to determine the best grid 12 – 12.45: Collect grid atlas image 12.45 – 3: Setup EPU, microscope alignments, detector gain refs. etc. 3 – 4: Check images, assess CTF etc. Automatic collections for 40 hours. Staff monitor remotely (but so can you!).
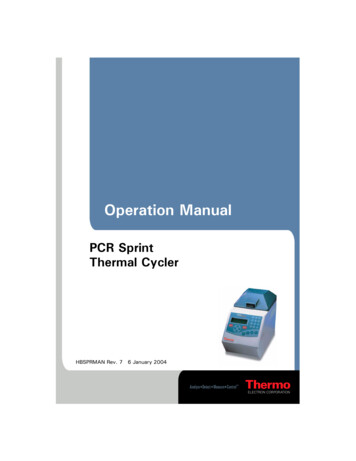
EPU – Automated Image AcquisitionAtlasGrid SquareHoleSummed High resolution imageImages provided by Sonja Welsch (FEI)Setup the template for imageacquisition: Focus,Drift Measurement and Exposure(s)area. This template will beautomatically repeated for everyselected hole.
Things to Consider Before Your Single Particle DataCollection at Diamondo How many grids you want to load Less is more?o Detector Integrating versus counting?o Magnification Number of particles, resolution?o Hole size Speed of collection?o Number of frames, Dose & Defocus Microscope stability and object size?o Data Data assessment and how do I get it back?
How many Grids Maximum of 12 grids can be loaded into the Cassette We recommend loading only 8 grids as this will already take around 1hour. The more grids that need to be screened the less time you will havefor collection! You can bring a backup sample and I would recommend loading 6grids for your primary sample and 2 for your backup sample. Make sure that all your samples are on the ERA. Otherwise they willnot be loaded! We also prefer to load only one cassette per 48hour session!
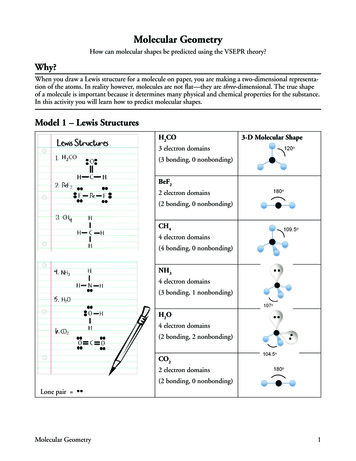
Detector Choice – Integrating vs CountingElectron enters detectorSignal scatteredEvents are reduced to highest charge pixelsCharge collects in each pixelsK2Counting?Falcon II integratingOptimal dose rate 55e/p/sshorter exposureEvents are localised with sub-pixel accuracyK2 Super resolutioncounting?Optimal dose rate 5e/p/s longer exposureCheng et al, 2013McMullan et al, 2014Gatan Website
Detector Choice – Integrating vsCountingMcMullan et al, 2014Advantages of Integration (Falcon II) Works at a range of electron doses, therefore short exposuretimes (1-2 seconds) can be used at most magnifications Potentially better DQE at high spatial frequencies than K2Advantages of counting/super-resolution counting (K2) Much higher DQE at lower spatial frequencies (removes therandom energy deposition of detected electrons and readnoise) – Improve particle alignment Super-resolution can recover information past the Nyquistfrequency of the original image (Removes aliasing)Gatan Website
Detector Choice - Recommendation For large viruses/protein complexes (above 1MDa) it may be advisable to use the Falcon II as youprobably don’t need the increased DQE of the K2 at lower spatial frequencies but do need theincreased DQE at higher spatial frequencies The Falcon II can collect more images per hour than the K2 e.g. with our fastest data collectionstrategies we can get 100 movies per hour on the Falcon II versus 75 on the K2 – Potentially 1000more movies in a 48 hour session For Heterogeneous samples it could be an advantage to use the Falcon II – More data. However for smaller complexes (less than 500kDa) it would be better to use the K2 For theincreased DQE at lower spatial frequencies. Super-resolution gives better DQE at higher spatial frequencies than normal counting mode but issignificantly slower
Magnification What resolution do you want to achieve? Both the falcon II and the K2 will provide information at theNyquist frequency of the image. The most common magnifications used on both the Falcon IIand K2 give approximately 1.4 or 1.1 Å/pix Using a lower magnification may not give you more particles asyou can not take as many movies per hole (next slide) Lower magnifications on the K2 require longer exposure times e.g 5e/p/s in counting will be equivalent to 4.2 e/Å2/s at1.1 Å/pix compared to 2.6 e/Å2/s at 1.4 Å/pix - translatesto an increase in exposure time by 40 % to achieve thesame total dose.McMullan et al, 2014
Hole SizeLacey0.6uM holes1.2uM holes2uM holes3.5uM holesFalcon II75 IM/hr1 IM/hole 45 IM/hr3 IM/hole 65 IM/hr5 IM/hole 75 IM/hr**K255 IM/hr1 IM/hole 30 IM/hr3 IM/hole 55 IM/hr5 IM/hole 65 IM/hr8 IM/hole 75 IM/hr*Averages and based on our standard imaging parameters of approximately 2 secondexposures with the Falcon II (35 frames) and 8 second exposures with the K2 (20 frames).*Increasing the number of frames or the exposure time can reduce the number of IM/hr.*Super-resolution gives approximately half the number of IM/hr as countingUltrafoil gold grids can be usedbut require a carbon grid loadedfor microscope alignment
Number of frames, Dose & Defocus range The krios is a very stable microscope! So you may not require as many frames as you would think. Routinely we use a 2 second exposure with 17 frames per second on the Falcon II and an 8 secondexposure with 20 frames on the K2 (1Gb per movie) How many electrons will you need? We tend to routinely use between 40-50 electrons, However forlarger complexes this may not be necessary and for smaller complexes this may not be enough! With our standard frame and dose rates you get 1.5 e/frame/s on Falcon II and 2e/frame/s on the K2 With the falcon II you can use shorter frame times initially – May help with beam induced movement! Defocus range is dependent on complex size e.g For large virus use a defocus range from -0.6 to -2 um(0.3 to 0.5 steps) compared to -1.8 to -3.8 for a 250 kDa protein complex – You need to be able to seeyour complex!
Automated Pipeline (Quality control) We are currently in the process of implementing an automated pipeline that will allow the user toalign their movies, estimate defocus values, pick particles (user provided templates), align and 2Dclassify However at the moment these operations have to be done manually - dedicated user office for this We would recommend that the users at least check that the defocus range they have asked for iscorrectGetting your data home Bring USB drives as we can copy as we can copy the data when it is acquired Alternatively you can FTP/Globus to send them back to your home institution!
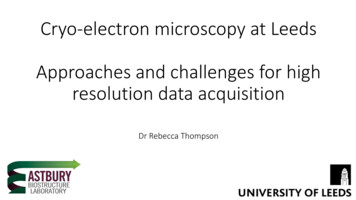
Commissioning tests using GroELFalcon IIQuantum-K2 – Krios 1Quantum-K2 – Krios 21.4 Å/pixel1.06 Å/pixel (0.503 SR)1.06 Å/pixel7 frames in 1.5 seconds (shortinitial frames and along finalframe)16 frames in 4 seconds using atcounting rate of 8e/Å2/s, superresolution mode20 frames in 10 seconds using atcounting rate of 4e/Å2/sTotal dose 40 electronsTotal dose 40 electronsTotal dose 40 electronsMovie alignment – IMODMovie alignment – IMODMovie alignment – Motioncorr33,000 particles in finalreconstruction (processed withRelion)17,400 particles in the finalreconstruction (Processed withRelion after image binning)38,000 particles in the finalreconstruction (Processed withRelion)FSC 4.1 ÅFSC 3.3 ÅFSC 4 Å *Old protein*
Falcon IIK2 (SR)K2 (C)
PeopleeBIC staff:Alistair Siebert and Corey Hecksel.Diamond light source staff:Jean Lane, Alun Ashton, Kevin Savage, Nick Rees, Michelle Bennett,Alison Roblin, the EHC’s and others.Alistair Siebert, Dan Clare, Alex Buzduga,Sonja Welsch, Alan BoswellFEI installation and application support team:Alan Boswell, Alex Buzduga, Alberto Gonzalez, Sonja Welsch, Felix de Haas, Sacha de Carlo and more.Gatan Installation:Liam Spillane.eBIC management:Dave Stuart, Kay Grünewald, Helen Saibil & Martin Walsh.
The NEWDirect Electron Detectors (DED)MAPS detectorsSilicon30μmSensor pixel size 5 or 6 μm- Electrons are directly detected by the pixel electronicsof the detector. The DED are also made of silicon whichreduces the spread of electrons to neighboring pixels.The substrate underneath is back thinned to stopelectrons being scattered back to the epilayer. Thecharge from the pixels are read individually so there iseffectively no dead time for the detector, thereforethe detector can run at very high speeds.Movie from Ben Bammes
The aliasing effect occurs when thereare not enough pixels to capture all ofthe detail in the picture: changes details - are occurring in the image forwhich there are simply not enoughavailable pixels to record faithfully.Normally, we would choose a highenough resolution device to ensure thatwe have enough pixels to capture thedetail in image to the required accuracy.If there should not be a sufficientnumber, we would simply expect to seeless detail. However, this is not thecase: sampling theory tells us that thesituation is actually much worse andstates that if we do not have a sufficientnumber of pixels, the image ispermanently degraded.Nikon WebsiteGatan Website
DED reconstructionsDE20RNA67-7239-5487-94108-133Gatan K2RNA67-7239-5487-94108-133Both reconstructions were nearly identical and It was possible to place 90 % of the sidechains from TMV in density at this resolution!
(Lu et al., 2014)
Data collection statisticsNumber of unique groupsAllocated time*14 groups from Cambridge, 10 groups from Oxford, 6 groups from Birkbeck, 5 groups from Imperial, 4 groups from Manchester and Bilbao, 3 groups from Leeds, 2groups from Edinburgh, the Crick and Dundee, 1 Group from Diamond, Warwick, Madrid, Bristol, Leicester, Helsinki, Sheffield, Stockholm, Virginia and SPring8
Microscopes at Diamond As of the 02/09/16 - 129 external visits, 62 unique, 354.9 TB of data generated . groups from Oxford, 6 groups from Birkbeck, 5 groups from Imperial, 4 groups from Manchester and Bilbao, 3 groups from Leeds, 2 groups from Edinburgh, the Crick and Dundee, 1 Group from Diamond, Warwick, Madrid, Bristol, Leicester .