Transcription
2018GLOBAL SUSTAINABLEINVESTMENT REVIEW
THANK YOU TO OUR SPONSORSWHO HELPED MAKE THIS REPORT POSSIBLE:
TABLE OF CONTENTSForeword. 2Executive Summary. 3Introduction. 6Sustainable Investing Defined. 7Global Sustainable Investments 2016–2018. 8Growth of Global Sustainable Investing Assets. 8Sustainable Investment Strategies. 9Global Market Characteristics. 10Regional Highlights. 13Europe. 13United States. 14Japan. 15Sustainable Investing in Latin America. 16Canada . 17Australia and New Zealand. 18Investing for Impact in Africa. 19Conclusion. 20Appendix 1—Methodology and Data. 21Appendix 2—Glossary. 24Appendix 3—Data Table. 25Acknowledgements. 262018 GLOBAL SUSTAINABLE INVESTMENT REVIEW1
FOREWORDThe Global Sustainable Investment Alliance (GSIA) is an international collaboration of membership-based sustainableinvestment organizations. Our mission is to deepen and expand the practice of sustainable investment throughintentional international collaboration. We are pleased to present the Global Sustainable Investment Review 2018,the fourth edition in the series since our inaugural review of sustainable investment worldwide in 2012.Since 2016, when we released our last biennial review, sustainable and responsible investing has continued togrow in each of the five main regions discussed in this report: Australia and New Zealand, Canada, Europe, Japanand the United States, with particularly robust growth in Japan. In each of these regions, sustainable investingcommands a sizable share of total professionally managed assets. We are also pleased to provide snapshots onsustainable investing in Latin America and in Africa.We want to thank the many sponsors—listed in the Acknowledgments page—of the regional research reportsused to prepare the Global Sustainable Investment Review 2018. We also thank Hermes Investment Management,RBC Global Asset Management and UBS for the financial support they provided for the global review. Without thegenerous support of these sponsors, this report and the research on which it is based would not have been possible.We are grateful to US SIF: The Forum for Sustainable and Responsible Investment, which led the production of thereport, and particularly to US SIF Research Director Meg Voorhes.Sincerely,Masaru Arai, ChairJapan Sustainable Investment ForumDustyn Lanz, CEOResponsible Investment Association CanadaSimon O’Connor, CEOResponsible Investment Association AustralasiaWill Oulton, ChairEurosif, the European SustainableInvestment ForumLisa Woll, CEOUS SIF: The Forum for Sustainable and ResponsibleInvestment and the US SIFFoundation22018 GLOBAL SUSTAINABLE INVESTMENT REVIEW
EXECUTIVE SUMMARYIn early 2017, the Global Sustainable Investment Alliance (GSIA) released the Global Sustainable Investment Review2016, which collated the results from the market studies of regional sustainable investment forums for Europe, theUnited States, Canada, Japan, and Australia and New Zealand. In the period since the last report was released, theglobal sustainable investment market has continued to grow, and in most of the regions covered by GSIA’s memberorganizations, its share of professionally managed assets has also grown. This report summarizes the status ofsustainable and responsible investing in these markets at the start of 2018.Generally in this report, when discussing the global tally of sustainable investing assets and how they break downby region or strategy, the assets are presented in US dollars. To show trends within each region over time, however,we present assets in the local currencies so as not to introduce exchange rate fluctuations.Sustainable investing is an investment approach that considers environmental, social and governance (ESG) factorsin portfolio selection and management. For the purpose of this global report and for articulating our shared work inthe broadest way, GSIA uses an inclusive definition of sustainable investing, without drawing distinctions betweenthis and related terms such as responsible investing and socially responsible investing. This report primarily uses theterm sustainable investing.Globally, sustainable investing assets in the five major markets stood at 30.7 trillion at the start of 2018, a 34percent increase in two years. In all the regions except Europe, sustainable investing’s market share has also grown.Responsible investment now commands a sizable share of professionally managed assets in each region, rangingfrom 18 percent in Japan to 63 percent in Australia and New Zealand. Clearly, sustainable investing constitutes amajor force across global financial markets.From 2016 to 2018, the fastest growing region has been Japan, followed by Australia/New Zealand and Canada.These were also the three fastest growing regions in the previous two-year period. The largest three regions—based on the value of their sustainable investing assets—were Europe, the United States and Japan.Sustainable investment encompasses the following activities and strategies:1. Negative/exclusionary screening,2. Positive/best-in-class screening,3. Norms-based screening,4. ESG integration,5. Sustainability themed investing,6. Impact/community investing, and7. Corporate engagement and shareholder action.As in 2016, the largest sustainable investment strategy globally is negative/exclusionary screening ( 19.8 trillion),followed by ESG integration ( 17.5 trillion) and corporate engagement/shareholder action ( 9.8 trillion). Negativescreening remains the largest strategy in Europe, while ESG integration continues to dominate in the United States,Canada, Australia and New Zealand in asset-weighted terms. Corporate engagement and shareholder action is thedominant strategy in Japan.2018 GLOBAL SUSTAINABLE INVESTMENT REVIEW3
Norms-based screening has lost ground in Europe, with substantially fewer assets managed under this strategythan in 2016. Despite modest growth in Canada, and more rapid growth in Japan in assets managed undernorms-based screening, the global total of these assets fell from 2016 to 2018.Impact investing is a small but vibrant segment of the broader sustainable and responsible investing universe in allthe markets studied. GSIA defines impact investing as targeted investments aimed at solving social or environmentalproblems. Community investing, whereby capital is specifically directed to traditionally underserved individuals orcommunities, is included in this category, as is finance that is provided to businesses with an explicit social orenvironmental purpose.In Europe, total assets committed to sustainable and responsible investment strategies grew by 11 percent from2016 to 2018 to reach 12.3 trillion ( 14.1 trillion), but their share of the overall market declined from 53 percent to49 percent of total professionally managed assets. The slight drop may be due to a move to stricter standards anddefinitions. Although exclusionary screens remain the dominant strategy at 9.5 trillion, this is down from the 10.2trillion reported under this strategy in 2016. Corporate engagement and shareholder action is now the second mostwidely practiced strategy, up from third place in 2016, with the assets involved in this strategy growing 14 percent.Norms-based screening, which was the second most widely practiced strategy in 2016, now ranks in fourth place.Meanwhile, ESG integration moved from fourth place to third place; the assets managed under this strategy grew60 percent from 2016 to reach 4.2 trillion in 2018; notably this growth occurred after Eurosif adopted a stricterdefinition of ESG integration for its 2016 study.Sustainable investing in the United States continues to expand. Total US-domiciled assets under management usingsustainable strategies grew from 8.7 trillion at the start of 2016 to 12.0 trillion at the start of 2018, an increaseof 38 percent. Of this, 11.6 trillion is held by asset management firms and community investment institutionsapplying ESG criteria in their investment analysis and portfolio selection, predominantly through ESG integrationand negative screening. ESG integration, the dominant strategy, is used across an estimated 9.5 trillion in assets.The US sustainable investing total also includes 1.8 trillion in US-domiciled assets at the beginning of 2018 heldby institutional investors or asset managers that filed or co-filed shareholder resolutions on ESG issues at publiclytraded companies from 2016 through 2018. Assets managed with sustainable investing strategies now represent26 percent of all investment assets under professional management in the United States.In Japan, sustainable investing assets quadrupled from 2016 to 2018, growing from just 3 percent of totalprofessionally managed assets in the country to 18 percent. The growth has made Japan the third largest centerfor sustainable investing after Europe and the United States. The leading sustainable investing strategy in thecountry is corporate engagement and shareholder action, deployed by assets totaling 141 trillion, followed by ESGintegration, which is practiced across 122 trillion. In the last few years, a number of developments have driven thesignificant expansion in the sustainable investment market in Japan. The first is the Abe administration’s continuingencouragement of private sector investment as part of its economic growth strategy, as well as initiatives by variousgovernment bureaus. Adding to the growing awareness of sustainable investing in Japan were the decisions bytwo major institutional asset owners to become signatories to the Principles for Responsible Investment: the giantGovernment Pension Investment Fund in 2015 and the Pension Fund Association in 2016.From 2016 to 2018, assets managed with responsible investment strategies in Canada grew by 42 percent. Thegrowth is even more impressive in terms of market share. Responsible investments now account for just over50 percent of professionally managed assets in the country, up from 38 percent in 2016. This marks a majormilestone in the history and development of responsible investing in Canada. The most prominent responsibleinvesting strategy practiced in Canada, in asset-weighted terms, continues to be ESG integration, with corporateengagement in second place. The most rapidly growing strategy was negative screening; assets managed with this42018 GLOBAL SUSTAINABLE INVESTMENT REVIEW
strategy grew 64 percent over the two-year period. Impact investing continues to be a small category, but one thatexperienced rapid growth—60 percent—since 2016.The 2018 surveys by the Responsible Investing Association of Australasia (RIAA) reveal that a responsible approach toinvesting—one that systematically considers environmental, social and corporate governance and/or ethical factorsacross the entire portfolio—now represents 63 percent of the assets managed professionally in the two-countryregion, up from 51 percent in 2016. In Australia, 78 percent of the responsible investing assets are managed throughwhat RIAA terms a “broad” strategy that emphasizes ESG integration and corporate engagement, while 22 percentare managed through the “core” responsible investment strategies of screening, sustainability themed investing orimpact investing. Broad responsible investing approaches account for 53 percent of responsible investing assets inNew Zealand.2018 GLOBAL SUSTAINABLE INVESTMENT REVIEW5
INTRODUCTIONThe Global Sustainable Investment Alliance (GSIA) is pleased to release the Global Sustainable Investment Review2018, the fourth edition of this biennial report. This review continues to be the only report collating results from themarket studies of regional sustainable investment forums from Europe, the United States, Japan, Canada, andAustralia and New Zealand. It provides a snapshot of sustainable investing in these markets at the start of 2018 bydrawing on the in-depth regional and national reports from GSIA members—Eurosif, Japan Sustainable InvestmentForum (JSIF), Responsible Investment Association Australasia, RIA Canada and US SIF.Since the launch of the inaugural study in 2012, the sustainable investment market has continued to grow andevolve globally. While each region’s approach to sustainable investment is slightly different, some trends have had aglobal reach. Every region again saw a rise in ESG integration and sustainability themed investing.This report also includes data on the African sustainable investing market for the third time since the 2012 edition ofthe Review, thanks to the cooperation of the African Investing for Impact Barometer based at the University of CapeTown’s Graduate School of Business. Additionally, the Principles for Responsible Investment shared highlights ondevelopments in several countries in North, Central and South America.Together, these resources provide data points, insights, analysis and examples of the shape of sustainable investingworldwide.Generally in this report, when discussing the global tally of sustainable investing assets and how they break downby region or strategy, the assets are presented in US dollars. Sustainable investing assets for 2018 are reportedas of December 31, 2017, except for Japan, which reports as of March 31, 2018, and currencies were convertedto US dollars at the exchange rate prevailing at the time of reporting, for comparability. To show trends withineach region over time, however, we present assets in the local currencies so as not to introduce exchange ratefluctuations. Refer to Appendix 1 for more information on methodology and data. Refer to Appendix 3 for a tableof the sustainable investing assets in each region in its local currency in 2016 and 2018, and the percentagegrowth for both the regional and global strategy totals over this period.62018 GLOBAL SUSTAINABLE INVESTMENT REVIEW
SUSTAINABLE INVESTING DEFINEDSustainable investing is an investment approach that considers environmental, social and governance (ESG) factorsin portfolio selection and management. For the purpose of this global report and for articulating our shared work inthe broadest way, GSIA uses an inclusive definition of sustainable investing, without drawing distinctions betweenthis and related terms such as responsible investing and socially responsible investing. This report primarily uses theterm sustainable investing.The GSIA definitions of sustainable investment, published in the Global Sustainable Investment Review 2012, haveemerged as a global standard of classification. These are:1. NEGATIVE/EXCLUSIONARY SCREENING: the exclusion from a fund or portfolio of certain sectors,companies or practices based on specific ESG criteria;2. P OSITIVE/BEST-IN-CLASS SCREENING: investment in sectors, companies or projects selected for positiveESG performance relative to industry peers;3. N ORMS-BASED SCREENING: screening of investments against minimum standards of business practicebased on international norms, such as those issued by the OECD, ILO, UN and UNICEF;4. E SG INTEGRATION: the systematic and explicit inclusion by investment managers of environmental, socialand governance factors into financial analysis;5. S USTAINABILITY THEMED INVESTING: investment in themes or assets specifically related to sustainability(for example clean energy, green technology or sustainable agriculture);6. IMPACT/COMMUNITY INVESTING: targeted investments aimed at solving social or environmental problems,and including community investing, where capital is specifically directed to traditionally underservedindividuals or communities, as well as financing that is provided to businesses with a clear social orenvironmental purpose; and7. C ORPORATE ENGAGEMENT AND SHAREHOLDER ACTION: the use of shareholder power to influencecorporate behavior, including through direct corporate engagement (i.e., communicating with seniormanagement and/or boards of companies), filing or co-filing shareholder proposals, and proxy voting that isguided by comprehensive ESG guidelines.The sum of these individual strategies, after adjusting for double counting since some assets are managed usingmore than one strategy, results in the sustainable assets under management included in this report. In the report, theaggregated figure is referred to as sustainable investment or investment taking into account ESG concerns, withoutmaking a judgment about the quality or depth of the process applied.2018 GLOBAL SUSTAINABLE INVESTMENT REVIEW7
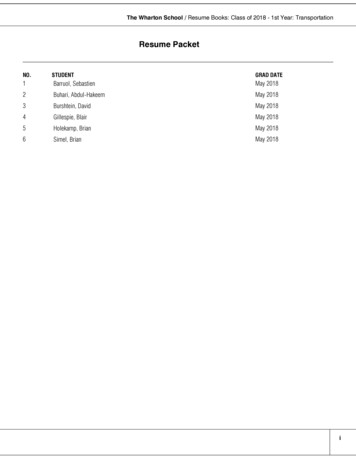
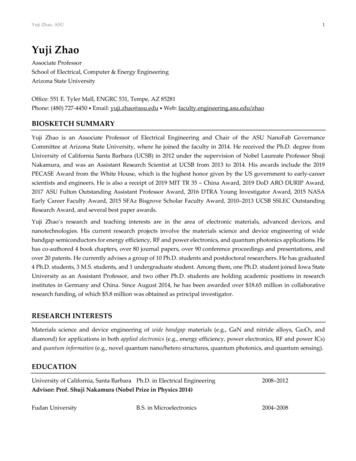
GLOBAL SUSTAINABLE INVESTMENT2016–2018GROWTH OF GLOBAL SUSTAINABLE INVESTING ASSETSAt the start of 2018, global sustainable investment reached 30.7 trillion in the five major markets shown in Figure1, a 34 percent increase in two years.FIGURE 1: SNAPSHOT OF GLOBAL SUSTAINABLEINVESTING ASSETS, 2016–2018Region20162018Europe 12,040 14,075United States 8,723 11,995Japan 474 2,180Canada 1,086 1,699Australia/New Zealand 516 734TOTAL 22,838 30,683Note: Asset values are expressed in billions of US dollars. All 2016 assets are converted toUS dollars at the exchange rates as of year-end 2015. All 2018 assets are converted toUS dollars at the exchange rates at the time of reporting.Sustainable investment assets are continuing to climb globally, with some regions demonstratingstronger growth than others within their local currencies. As shown in Figure 2, the largest increase over the pasttwo years was in Japan, where sustainably managed assets grew over 300 percent. In the United States, growthfrom 2016 to 2018 is slightly higher than over the previous two years (38 percent versus 33 percent). Elsewhere,sustainable assets continued to rise, but at a slower pace than between 2014 and 2016.FIGURE 2: GROWTH OF SUSTAINABLE INVESTING ASSETSBY REGION IN LOCAL CURRENCY 2014–2018Growth Per 18CompoundAnnualGrowthRate (CAGR)2014–2018Europe 9,885 11,045 12,30612%11%6%United States 6,572 8,723 11,99533%38%16%Canada (in CAD) 1,011 1,505 2,13249%42%21%Australia/New Zealand(in AUD) 203 1,033248%46%50%Japan 840 57,056 231,9526692%307%308%707Note: Asset values are expressed in billions. All 2018 assets in this report are as of 12/31/17, except for Japan, whose assets are as of 3/31/18.82018 GLOBAL SUSTAINABLE INVESTMENT REVIEW
As shown in Figure 3, the proportion of sustainable investing relative to total managed assets grew in almost everyregion, and in Canada and Australia/New Zealand responsible investing assets now make up the majority of totalassets under professional management. The exception to this trend is Europe, where sustainable investing assetshave declined relative to total managed assets since 2014. At least part of the market share decline in Europe stemsfrom a shift to stricter standards and definitions for sustainable investing.FIGURE 3: PROPORTION OF SUSTAINABLE INVESTING RELATIVE TOTOTAL MANAGED ASSETS 1420162018Europe58.8%52.6%48.8%United a/New Zealand16.6%50.6%63.2%Japan 3.4%18.3%Note: In 2014, data for Japan was combined with the rest of Asia, so this information is not available.In terms of where sustainable and responsible investing assets are domiciled globally, Europe continues to managethe highest proportion, with nearly half of global sustainable investing assets, as shown in Figure 4. However, thisis a decline from 2016 when Europe managed nearly 53 percent of sustainable investing assets. Meanwhile, Japanhas shown impressive growth, as its proportion of global sustainable investing assets has quadrupled since 2016.The proportions of global sustainable investing assets in the United States, Canada and Australia/New Zealand haveremained largely level over the past two years.FIGURE 4: PROPORTION OF GLOBAL SUSTAINABLE INVESTING ASSETSBY REGION 2018Australia/NZ2%Canada6%Japan7%Europe46%United States39%2018 GLOBAL SUSTAINABLE INVESTMENT REVIEW9
SUSTAINABLE INVESTMENT STRATEGIESThe largest sustainable investment strategy globally continues to be negative or exclusionary screening, as shown inFigure 5, with a combined 19.8 trillion in assets under management. This is followed by ESG integration, which hasgrown by 69 percent over the past two years, to 17.5 trillion in assets. Negative screening is the largest strategyin Europe, while ESG integration commands the majority of assets in the United States, Canada, Australia and NewZealand. Meanwhile, corporate engagement and shareholder action constitute the predominant strategy in Japan.FIGURE 5: SUSTAINABLE INVESTING ASSETS BY STRATEGY AND REGION 2018EuropeImpact/community investingUnited StatesSustainability themed investingCanadaPositive/best-in-class screeningAustralia/NZNorms-based screeningJapanCorporate engagement and shareholder actionESG integrationNegative/exclusionary screening 0 5,000 10,000 15,000 20,000Note: Asset values are expressed in billions of US dollars.Although total assets are much lower in the three strategies of sustainability-themed investing, positive orbest-in-class screening and impact or community investing, all have shown impressive growth over the past twoyears, as shown in Figure 6. At the start of 2018, positive screening was deployed across 1.8 trillion in assets,followed by sustainability-themed investing with 1.0 trillion in assets, and impact/community investing with 444billion in assets. Although norms-based screening remains more than double the size of these three strategies, it isthe only strategy to have declined since 2016—a decrease of 24 percent—to 4.7 trillion in assets.FIGURE 6: GLOBAL GROWTH OF SUSTAINABLE INVESTING STRATEGIES 2016–2018 20,000Billions 15,000 10,000 5,0000CorporateengagementNorms-based and ssscreening2018 444.26 1,017.66 1,841.87 4,679.44 9,834.59 17,543.81 19,770.962016 248.47 276.16 818.01 6,195.40 8,385.17 10,353.20 15,063.57Growth 6%Note: Asset values are expressed in billions.Some corrections to the 2016 strategies have been made. See the Methodology section for more information.10ESGintegration2018 GLOBAL SUSTAINABLE INVESTMENT REVIEW
Regional differences in the prevalence of sustainable and responsible investing strategies can be seen in Figure7. Some differences are definitional. For example, Australia and New Zealand combine positive, negative andnorms-based screening into one bucket and do not track corporate engagement as a stand-alone strategy, sotheir assets are restricted to four of the seven strategies shown in Figure 7. The United States does not tracknorms-based screening, and for the purposes of producing an overall tally of sustainable investing assets, countsonly the portion of corporate engagement assets that are deployed in filing shareholder resolutions. Still, we are ableto see some interesting regional variations. Although Japan holds 7 percent of global sustainable investing assets,it accounts for a much greater share of global assets dedicated to corporate engagement and shareholder action.Canada represents 6 percent of global sustainable investing assets, but 17 percent of assets within norms-basedscreening strategies. Over three-quarters of norms-based screening takes place in Europe, while the United Statesholds the majority of global assets in sustainability investing, impact/community investing, positive/best-in-classinvesting and ESG integration.FIGURE 7: REGIONAL SHARES, BY ASSET WEIGHT, IN GLOBAL USEOF SUSTAINABLE INVESTING STRATEGIES ityinvestingSustainabilitythemed dscreeningCorporateESG integrationengagementand ope28%17%36%77%56%28%55%United da3%3%1%17%12%9%4%Australia/NZ1%2%0%0%0%3%1%GLOBAL MARKET CHARACTERISTICSINSTITUTIONAL AND RETAIL INVESTORS: Investments managed by professional asset managers are often classifiedas either retail or institutional. Retail assets are personal investments by individuals in professionally managed fundspurchased in banks or through investment platforms with relatively low minimum investment levels, while assetsclassified as “institutional” are managed on behalf of institutional asset owners such as pension funds, universities,foundations and insurers through investment products with higher minimum investment levels. Although institutionalinvestors tend to dominate the financial market, interest by retail investors in sustainable and responsible investinghas been steadily growing since this report began differentiating between these two investment classifications in2018 GLOBAL SUSTAINABLE INVESTMENT REVIEW11
2012. At that time, institutional investors held 89 percent of assets compared with 11 percent held by retail investors.At the start of 2018, the retail portion had grown to one quarter (shown in Figure 8).FIGURE 8: GLOBAL SHARES OF INSTITUTIONAL ANDRETAIL SUSTAINABLE INVESTING ASSETS 40%30%20%10%0%2016 2018RetailInstitutionalNote: Institutional and retail investor data were not collected in Australia/New Zealand.ASSET ALLOCATION: Sustainable investments now extend across the range of asset classes commonly found indiversified investment portfolios, as shown in Figure 9, which shows the asset class allocation reported in Europe,the United States, Japan and Canada in 2018. Collectively in these regions, a majority of assets were allocated topublic equities: 51 percent at the start of 2018. The next largest asset allocation is in fixed income, with 36 percent.This is a reversal from 2016 when, with only Europe and Canada reporting on asset class allocation, 64 percentof sustainable investing assets were in fixed income and 33 percent were in public equities. In 2018, real estate/property and private equity/venture capital each held 3 percent of global sustainable investing assets. Sustainableinvestments can also be found in hedge funds, cash or depository vehicles, commodities and infrastructure; theseassets are reflected in the “other assets” category shown in Figure 9.FIGURE 9: GLOBAL SUSTAINABLE INVESTING ASSET ALLOCATION 2018Other7%PE/VC3%Real Estate/Property3%PublicEquity51%Fixed Income36%Note: Other includes hedge funds, cash/deposits, commodities, infrastructure, and nototherwise specified. Asset allocation data were not collected in Australia/New Zealand.122018 GLOBAL SUSTAINABLE INVESTMENT REVIEW
REGIONAL HIGHLIGHTSEUROPEIn Europe, where sustainable investing has long been broadly practiced and accepted, there are signs that themarket is maturing. From 2016 to 2018, sustainable investing assets grew at a modest pace, but not as quicklyas the overall universe of assets professionally managed in Europe, which reached a record high of 25.2 trillion,according to the European Fund and Asset Management Association’s 2018 report.Part of the reduction in the share of the European investment market may lie in the robust debate over definingsustainable investing. As Eurosif was writing its 2018 study, the European Commission was considering actionpoints to finalize its sustainable finance policy. The work around the development of a taxonomy for sustainableinvesting, the definition of a green bond standard and an eco-label are examples of the main elements that willinfluence and guide investors. In early March 2019, the European Parliament adopted rules
Corporate engagement and shareholder action. As in 2016, the largest sustainable investment strategy globally is negative/exclusionary screening ( 19.8 trillion), . RIA Canada and US SIF. Since the launch of the inaugural study in 2012, the sustainable investment market has continued to grow and evolve globally. While each region's approach .