Transcription
Small Business Lending in theUnited States, 2017Office of AdvocacyU.S. Small Business AdministrationJanuary 2020
Created by Congress in 1976, the Office of Advocacy of the U.S. Small Business Administration is anindependent voice for small business within the federal government. Appointed by the President andconfirmed by the U.S. Senate, the Chief Counsel for Advocacy directs the office. The Chief Counseladvances the views, concerns, and interests of small business before Congress, the White House, federalagencies, federal courts, and state policymakers. Economic research, policy analyses, and small businessoutreach help identify issues of concern. Regional Advocates and an office in Washington, D.C., supportthe Chief Counsel’s efforts.To learn more about the Office of Advocacy, visit https://advocacy.sba.gov or call 202-205-6533. Toreceive email notices of the office’s new research, visit https://advocacy.sba.gov/about/contact-us.Small Business Lending in the United States, 20172
AcknowledgmentsThis edition of Small Business Lending in the United States, which addresses changes in 2017, was writtenand compiled by Victoria Williams, Economist. George Haynes of Montana State University prepared thedata for the analysis under contract 73351018P0054 to the Office of Advocacy. The editor of the report isRebecca Krafft.Small Business Lending in the United States, 20173
Table of ContentsAcknowledgments. 3Definitions, Terms, and Abbreviations. 5Introduction. 7The Differences Between Call Report and CRA Data. 8Economic Credit Conditions in the Small Business Financial Credit Market. 10I. Findings from the June 2017 Call Reports . 10A. Small Business Loans Outstanding from all Reporting Lenders . 10B. Loan Sizes . 13C. Lending by Size of Lender . 13D. Small Business Lending Measures: The Total Asset Ratio and Total Small Business Loan Ratio 16E. All Small Loans Outstanding from Multi-billion Dollar Lenders. 19F. Small Business Loans and Minority Lenders . 19II. Findings from 2016 CRA Reporting Institutions. 21A. Small Business Lending by CRA Reporting Lenders. 21B. Loans 100,000 or Less and Loans 100,000– 1 Million by CRA Lenders. 23Conclusion . 24Data Sources, Limitations, and Methodology. 25References. 27Small Business Lending in the United States, 20174
Definitions, Terms, and AbbreviationsBank. Any national bank and state bank, and any federal branch and insured branch; includes any formersavings association.BHC. Bank holding company. A company that owns and/or controls one or more U.S. banks or one thatowns, or has controlling interest in, one or more banks. A bank holding company may also own anotherbank holding company, which in turn owns or controls a bank. The company at the top of the ownershipchain is called the top holder.Call Report. Short term for the Report of Condition and Income, a report which must be filed by allregulated financial institutions in the United States on a bi-annual basis.C&I loan. Commercial and industrial loan; one of the two categories of a business loan.CRA. The Community Reinvestment Act. The CRA requires lending institutions with total assets ofapproximately 1 billion or more to report their small business lending activities.CRE loan. Commercial real estate loan; one of the two categories of a business loan.Commercial bank. A financial institution that is owned by stockholders, operates for a profit, andengages in various lending activities.Community bank. A community bank is a depository institution that is typically locally owned andoperated. In general, community banks can be defined as those owned by organizations with less than 10billion in assets.Depository lending institution. A financial institution in the United States that is legally allowed toaccept monetary deposits from consumers into safekeeping and use them to make loans to othercustomers. Important categories are savings banks, commercial banks, savings and loan associations, andcredit unions. This report covers all of these categories except credit unions and refers to them collectivelyas “lenders.”FDIC. Federal Deposit Insurance Corporation.Large business loan. A loan greater than 1 million.Mega lender. Bank holding company with more than 50 billion in assets.MDI. Minority depository institution. A federally insured depository institution where 51 percent or moreof the voting stock is owned by minority individuals; insured depository institutions may choose MDIstatus if a majority of the Board of Directors is made up of minority individuals and the community thatthe institution serves is predominantly minority.Online lending. An internet platform that connects lenders and borrowers. This term is usedinterchangeably with “marketplace lending.”Small Business Lending in the United States, 20175
Other depository institution. Those financial institutions not specifically listed with authority to acceptdeposits of funds.Savings bank. Banking institution organized to encourage thrift by paying interest dividends on savings.Savings banks can have state and federal affiliations, for example, state savings banks and federal savingsbanks.Small business loan. A commercial loan of 1 million or less.Small business. A firm with fewer than 500 employees.State bank. The term “state bank” means any bank, banking association, trust company, savings bank,industrial bank or similar depository institution, or other banking institution which is engaged in thebusiness of receiving deposits, other than trust funds, and is incorporated under the laws of any state.Traditional lender. This term refers to a lender that is FDIC insured.Small Business Lending in the United States, 20176
IntroductionPurpose. U.S. banks play an integral role as credit suppliers to small businesses. Small businessescomprise of nearly all employer firms in the economy and employ 47.3 percent of the private sectorworkforce (SBA Advocacy, 2019). The existence and performance of these vibrant businesses depend onhow banks and other financial intermediaries are responding to their credit needs. This report usespublicly available data on U.S. banks to analyze the patterns in small business lending.Similar to last year’s report, this report incorporates a brief discussion on minority depository lendinginstitutions. Additionally, detailed small business lending information on all depository institutions foreach state is available on Advocacy’s webpage in a user-friendly format. Most importantly, an effort hasbeen made to present information in this report in a more digestible and visual manner in the form ofsummary tables and figures.Structure and Coverage. The lending patterns of banks and other depository institutions in the smallbusiness credit market are captured in this report. The Call Report and Community Reinvestment Act(CRA) databases show the changes for loans under 100,000, 100,000 to 1 million, and 1 million orless. Both these databases cover only a portion of the credit extended to small businesses annually.Nonbank institutions such as finance companies and alternative lenders also extend such loans and are notcovered in this report. The Call Report findings are presented first, which includes a summary of thelending activities by minority lenders. This is followed by findings from CRA data. Four performancemeasures in the report indicate how lenders are meeting the credit needs of small businesses, namely: Number of loans, Aggregate lending, Total asset ratio, and Total small business loan ratio.These measures are used to evaluate lending at the national level in the report, and identify individuallenders investing in small businesses in the detailed appendix tables. The information providesdevelopments in the small business loan market to small businesses and depository lenders. All federalinsured depository lenders filing Call Reports (savings banks, cooperative banks, savings and loanassociations, and commercial banks), except for credit unions and foreign banks, are covered in thispublication. The report analyzes all small business lenders, but the FDIC and CRA data available do notmake it possible to distinguish SBA-guaranteed lenders or SBA-guaranteed loans. Geographic coverageincludes the 50 states, the District of Columbia, and selected U.S. territories. 11The territories covered are the Federated States of Micronesia, Guam, Puerto Rico, and the U.S. Virgin Islands.Small Business Lending in the United States, 20177
Data. Data years presented range from 2013 to 2017, with analyses focusing on 2017 for the June CallReports and for calendar year 2016 for the CRA reports. 2 These reports are filed by depository lendinginstitutions with their respective regulatory agencies and cover two types of small business loans: Loans secured by nonfarm nonresidential properties, or commercial real estate (CRE) loans, and Commercial and industrial (C&I) loans.Data are available for the size of the loan — not for the size of the business, thus loan categories reportedby lenders are done in three loan sizes listed below: Loans of 250,000 through 1 million Loans of 100,000 through 250,000 Loans 100,000 or less 3Additional sizes are: 1 million and under small business loans 100,000 to 1 million4The Differences Between Call Report and CRA DataThe Call Report and CRA data complement each other, but they are not comparable since they providedifferent kinds of loan information. The Call Reports measure outstanding loan balances by location of thelender’s headquarters with a reporting year of June to June. The CRA data, on the other hand, show loansoriginated in the state in which they are made during the calendar year. Box 1 summarizes each source’scharacteristics.Box 1. Comparison of Call Report and CRA Data in the Small Business Lending StudyCall Report DataCRA DataData yearJune 2016 – June 2017January – December 2016Loan informationprovidedStock of outstanding business loanbalances, reported bi-annually 5Loans originated and purchased over thecalendar yearHow loan location isidentifiedState in which lender’s headquarters islocatedState in which the lender made the loan.Lenders reportingAll reporting lenders—depository lendinginstitutions and bank holding companiesDepository lending institutions and bankholding companies with approximately 1billion or more in assetsSee the Appendix for additional information on these data sources.In earlier reports this was referred to as “micro business loan” which differs from other SBA programs and other industry usesof the term.4Previously referred to as “macro business loan.”5In March 2017 Call Report data collection switched from quarterly to twice a year, in June and December.23Small Business Lending in the United States, 20178
These databases are the only publicly available sources of information on the small business lending ofindividual lenders. However, they reflect only the supply of loans provided by federally insured lenders.Small firms have access to other sources of credit, such as their suppliers, finance companies, marketplacelenders, family and friends, and others. To fully understand the small business loan market, reliable loandemand data from traditional lenders, nonbank lenders, and marketplace lenders are needed, which thisreport does not include. Thus, this report should be cautiously interpreted due to a tendency to attribute allchanges in small business lending solely to lenders’ willingness to extend credit.Accessing the DataReaders can learn about the banks in their own communities and states by visiting Advocacy’s webpage,where a list of all reporting banks in each state can be found. Appendix Tables 3 and 4 show staterankings of either the top 10 or the top 10 percent of lenders in each state. The expanded Tables 3a and 4ashow rankings for all of a state’s reporting banks. The tables are part of this report, located in the financesection of Advocacy’s website, https://advocacy.sba. gov/tag/banking-finance.Small Business Lending in the United States, 20179
Economic Credit Conditions in the Small Business Financial Credit MarketBorrowing from banks and other depository lending institutions remained positive for both large businessloans (loans exceeding 1 million), and for small business loans (loans 1 million or less) from June 2016June 2017. The pace of borrowing and lending was less brisk, but healthy for large business loanscompared to the prior year. Small business loans outstanding continued to lag in growth and followed atrend similar to large business loans.Financial conditions were supportive of economic growth even with increases in interest rates. Rates werestill low by historic standards, but credit availability remained difficult for some small businesses andriskier borrowers. Respondents to the Senior Loan Officer Opinion Survey reported easing lending termson commercial and industrial loans, but experienced a weak demand for small business loans. 6Meanwhile, real gross domestic product (GDP) grew at an annual rate of 2.2 percent in 2017 from 1.6percent in the year prior. Small business GDP has grown by 25 percent in real terms over the last 16 years(1998 to 2014), but their share of GDP over this period has declined from 48.0 percent to 43.5 percent(Kobe & Schwinn, 2018).Among external financing, the U.S. banking system is the major supplier of traditional credit to smallbusinesses. Analysis of the 2014 Annual Survey of Entrepreneurs shows that banks are the most importantinstitutional supplier of external credit to small businesses (Robb, 2018). 7 Recent banking analysis fromthe FDIC data shows that community banks continue to be active in the small business lending space(Tholmer, 2018). Federal Reserve’s 2016 Small Business Credit Survey found that both small employerand non-employer firms are more likely to apply to banks when seeking credit than non-traditional lenders(Federal Reserve Banks, 2017). 8 However, non-traditional lenders, such as online lenders, fill part of thegap by providing financial assistance to entrepreneurs and small business borrowers who have difficultyobtaining credit from traditional lenders. For example, Black- and Hispanic-owned are more likely toapply for credit from online lenders than nonminority-owned firms. 9 While comprehensive public data onnon-traditional lending is not available, the lending patterns of banks and other depository lenders usingthe Call Report and Community Reinvestment Act data are discussed below.I. Findings from the June 2017 Call ReportsA. Small Business Loans Outstanding from all Reporting LendersBank lending to small and large businesses remained positive over June 2016 to June 2017. The growthrate for the dollar amount of loans outstanding for all small business loans ( 1 million or less) increasedThe Senior Loan Office Opinion Survey on Bank Lending Practices is conducted quarterly by The Federal Reserve Board. Forinformation, visit https://www.federalreserve.gov/data/sloos.htm.7An earlier study by Mach & Wolken, (2006), using the 2003 Survey of Small Business Finances showed that banks were themost important to small businesses seeking external financing.8This publication was a joint effort by all the Federal District banks. A total of six different studies were conducted and theyare located at t-on-microbusinesses.9See t-on-minority-owned-firms.6Small Business Lending in the United States, 201710
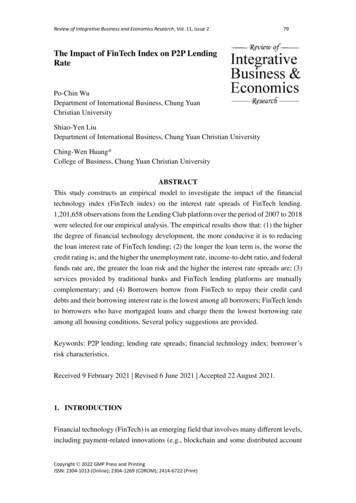
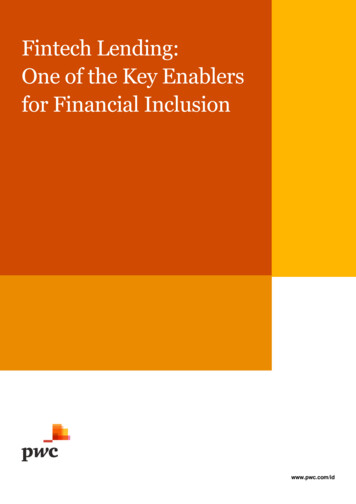
from 614 billion in June 2016 to 619 billion in June 2017. Compared with large business loans for thesame period, small business loans grew at roughly 1 percent while large business loans grew at a healthyannual rate of 5.7 percent (Tables A & B). The aggregate number of small business loans outstandinggrew at a slower pace than the prior year, from 7.6 during June 2015-June 2016 to 1.4 percent betweenJune 2016 and June 2017 (Table C).Small business loans consist of two categories—commercial industrial loans (C&I) and commercial realestate (CRE) loans ( 1 million or less). 10 Total small business C&I loans amounted to 337 billion in June2017, representing roughly 55 percent of total small business loans outstanding. Growth in the value ofboth loan categories was down compared to the previous year (Figure 1). The total number of small CREloans continue to be dwarfed by the number of C&I loans, which represent about 95 percent of the totalnumber (Table C).Figure 1. Percent Change in Small Business Loan Balances and Gross Domestic ProductNote: Real gross domestic product is seasonally adjusted.Source: Call Reports, FDIC, and Gross Domestic Product, BEA.10C&I and CRE loans of 1 million or less when combined make up small business loans.Small Business Lending in the United States, 201711
Table A: Value of Small Business Loans Outstanding for Depository Lenders by Loan Type and Size,2013 to 2017Billions of DollarsLoan Type and Size at OriginationCommercial Real EstateLess than 100,000 100,000 to 250,000 250,000 to 1 millionTotal Commercial Real .0613.8618.91,949.0 2,119.7 2,333.0 2,465.42,538.8 2,718.8 2,946.8 3,084.313,373.1 14,095.2 14,886.2 cial and IndustrialLess than 100,000124.1 100,000 to 250,00047.2 250,000 to 1 million116.7Total Commercial and Industrial288.1TotalSmall Business Loans ( 1 million or less)584.71,781.2Large Business Loans (more than 1 million)Business Loans2,365.9Domestic Assets of Depository Lenders12,618.4Number of BHC's and Independent Lenders6,402Note: Domestic assets of depository lenders total assets less foreign assets.Source: SBA Office of Advocacy, tabulations from the Federal Deposit Insurance Corporation, June Call Reports.Table B: Value of Small Business Loans Outstanding by Depository Lender Size, 2013-2017Billions of Dollars, NominalLenders by Total Asset SizeLess than 100 million 100 million to 499.9 million 500 million to 999.9 million 1 billion to 9.9 billion 10 billion to 49.9 billion 50 billion or .6243.7Percent Change2016-2017-9.6-5.75.2-4.616.41.3Total Small Business Loans584.7589.8599.0613.8618.90.8Source: SBA, Office of Advocacy, tabulations from the Federal Deposit Insurance Corporation, June Call Reports.Small Business Lending in the United States, 201712
Table C: Number of Small Business Loans Outstanding by Loan Type and Size, 2013-2017Millions20132014201520162017Percent 1.70.9-1.7Commercial and IndustrialLess than 100,000 100,000 to 250,000 250,000 to 1 millionTotal Commercial and 1.53.53.71.6Total Small Business Loans22.9723.4224.2226.0726.431.4Loan Type and Size at OriginationCommercial Real EstateLess than 100,000 100,000 to 250,000 250,000 to 1 millionTotal Commercial Real EstateSource: SBA, Office of Advocacy, tabulations from the Federal Deposit Insurance Corporation, June Call Reports.B. Loan SizesThe number and amount for C&I and CRE loans categories are provided under three loan size buckets: Under 100,000, 100,000- 250,000, and 250,001- 1 million).For both C&I and CRE loan categories, the smallest loan size, loans under 100,000, was the most activein terms of amount of loans during 2016-2017 period. C&I loans in this size bucket increased the most by5.0 percent, offsetting the 6.7 percent decline in CRE loans of this size. Combined, this loan size increasedby 4.0 percent; representing the only positive growth among the various C&I and CRE loan sizes whenaggregated. The statistic for the smallest loan size (less than 100,000) is difficult to interpret because ofcontinued efforts made by small business credit card issuers to consolidate their data reporting. 11 Thenumber of loans within C&I and CRE of the same loan sizes when combined were all positive with thehighest growth at about 2.0 percent (Tables A and C).C. Lending by Size of LenderThe size and number of lending institutions is affected by mergers and acquisitions, closures, failures, andnew charters. Thus, the significance of lenders in the small business loan markets continues to evolve. In11Small business credit cards continue to play an important role in this loan size category where they account for majority ofloans in this small business loan size category.Small Business Lending in the United States, 201713
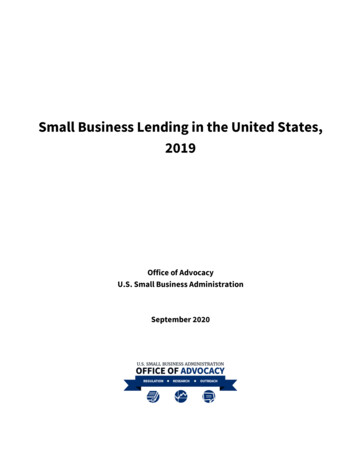
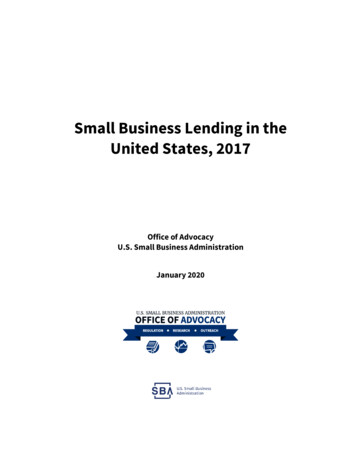
the second quarter of 2017, the number of bank holding companies and independent lenders filing CallReports totaled 5,416, which is 236 fewer than the previous year. 12 The change in the number of banksvaried across bank sizes, with institutions with assets of 1 billion or more increasing during this period.Bank lending activity to small businesses varied among the different bank sizes. Small business loans bylenders in two size categories--with under 500 million in assets and between 1 billion to 9.9 billion-contracted during the one-year period while other lenders’ small business lending grew (Table B).Declines by lender asset size ranged between -4.6 percent to -9.6 percent, while increases ranged from alow of 1.3 percent to a high of 16.4 percent. Though large lenders with assets from 10 billion to 49.9billion accounted for the largest increase in small business lending between June 2016 to June 2017, theirmarket share in the small business loan market is relatively small. They accounted for only 13.8 percent ofthe dollar amount of small business loans during this period.Growth in the number of small business loans increased by 1.4 percent. The number of loans declined fortwo bank asset size categories ( 100 million to 499.9 million and 500 million to under 1 billion), butthe number increased for all other bank sizes. Mega lenders with 50 billion or more accounted for mostof the number of small business loans (Table D).Using a different lens from the perspective of community banks provides some additional insight on smallbusiness lending. Community banks play a unique role to small businesses as their activities tend to belocalized, and the sizes of these lenders tend to be smaller when compared to non-locally based banks.Community banks in this report uses the Federal Deposit Insurance Corporation (FDIC) definition; onethat is not solely based on the asset size of the bank, but includes other non-asset based criteria (FDIC,2012). 13 Using this definition, community banks represented over 90 percent of all depository lendinginstitutions in June 2017 and held 43 percent of all small business loans based on the FDIC’s communitybank performance report. 14 These banks numbered 5,338 during this period, down 264 from the prioryear—a trend similar to all banks. 15 All the same, growth in small business loans at community bankswas 2.7 percent between June 2016 and June 2017, and totaled 296.9 billion (Figure 2). Interestingly,the increase was attributable to both C&I and CRE loans (up 3.4 and 3.8 percent respectively), but whenall banks (community and non-community banks) are examined the data shows that small business CREloans remain subdued.At the unconsolidated level, the total number of lenders with assets under 500 million was 318 fewer from June 2016 toJune 2017.13See FDIC Community Banking Study, Chapter 1 – Defining the Community Bank.14The FDIC publishes the Quarterly Banking Profile, which provides a comprehensive summary of activities of all FDICinsured institutions.15FDIC, Quarterly Banking Profile, 2nd quarter, 2017.12Small Business Lending in the United States, 201714
Figure 2. Percent Change in Year-To-Year Small Business Loans By All Banks and Community Banks,2014-2017Source: SBA, Office of Advocacy, tabulations from the FDIC Quarterly, June 2014-2017 Call Reports.Table D: Number of Small Business Loans Outstanding by Lender Size, 2013 to 2017MillionsLenders by Total Asset SizeLess than 100 million 100 million to 499.9 million 500 million to 999.9 million 1 billion to 9.9 billion 10 billion to 49.9 billion 50 billion or ercent Change2016-20174.2-6.2-0.73.011.21.2Total Small Business Loans22.9723.4224.2226.0726.431.4Source: SBA, Office of Advocacy, tabulations from the Federal Deposit Insurance Corporation, June Call Reports.Small Business Lending in the United States, 201715
D. Small Business Lending Measures: The Total Asset Ratio and Total Small BusinessLoan RatioThe performance of small business lenders is based on two measures: their small business loans as apercentage of their total assets and their total business loans. The total amount of small business loans tothe lender’s total assets is referred to as the “total asset ratio.” 16The Total Asset Ratio represents the percentage of a lender’s assets that is assigned to small businessborrowers. A positive change between periods indicates increased success of a borrower obtaining funds.Tables E and F show the total asset ratios by loan size, loan category, and asset size of lender. Table Eshows that small business borrowers seeking both commercial real estate loans (CRE) and commercialindustrial loans (C&I) were less successful as indicated in the negative change of 1.5 percent between2016 and 2017.Table E: Total Asset Ratios, 2013-2017Value of Small Business Loans Outstanding to the Value of Loan Type, PercentLoan Type and Size at OriginationCommercial Real EstateLess than 100,000 100,000 to 250,000 250,000 to 1 millionTotal Commercial Real EstateCommercial and IndustrialLess than 100,000 100,000 to 250,000 250,000 to 1 millionTotal Commercial and IndustrialTotal Small Business Loans ( 1 million or less)20132014201520162017Percent 0.9-1.013.7113.5013.2413.0412.85-1.5Source: SBA, Office of Advocacy, tabulations from the Federal Deposit Insurance Corporation, June Call Reports.The total asset ratio by the asset size of the lender is presented in Table F. The data shows that, in general,small business total asset ratio declined by lenders in all asset size categories with the exception of lendersin the 500 million to 999.9 million range where they remained relatively unchanged. The largest(mega) lenders devote a very small share of their assets to small business loans—roughly 3 percent. Eventhough these lenders invest much smaller shares of their assets in small business loans, they dominate theThe ratios used in Tables E-G are the mean ratios for all lenders. These ratios are derived by computing the ratio for eachlender, then computing the mean for all lenders in each category shown. See the Appendix for additional information.16Small Business Lending in the United States, 201716
small business loan market in the amount of loans they provide. The data shows that borrowers seekingloans from lenders with 10 billion or more in assets were more successful in obtaining funds compared toother size lenders as indicated in the positive change during the period.Table F: Total Asset Ratio by Lender Size, 2013-2017Value of Small Business Loans Outstanding to the Value of Lender Assets by Lender Size, PercentLenders by Total Asset SizeLess than 100 million 100 million to 499.9 million 500 million to 999.9 million 1 billion to 9.9 billion 10 billion to 49.9 billion 50 billion or 25.402.94Percent Change2016-2017-0.3-1.40.0-2.76.81.0Total Small Business Loans13.7113.5013.2413.0412.85-1.5Source: SBA, Office of Advocac
These reports are filed by depository lending institutions with their respective regulatory agencies and cover two types of small business loans: Loans secured by nonfarm nonresidential properties, or commercial real estate (CRE) loans, and Commercial and industrial (C&I) loans.