Transcription
Small Business Lending in the United States,2019Office of AdvocacyU.S. Small Business AdministrationSeptember 2020
The Office of Advocacy of the U.S. Small Business Administration was created by Congress in 1976 to be anindependent voice for small business within the federal government. The office is led by the Chief Counsel forAdvocacy who is appointed by the President and confirmed by the U.S. Senate. The Chief Counsel advances theviews, concerns, and interests of small business before the White House, Congress, federal agencies, federalcourts, and state policymakers. The office relies on economic research, policy analyses, and small businessoutreach to identify issues of small business concern. Regional and national advocates around the country andan office in Washington, D.C., support the chief counsel’s efforts.Information about Advocacy’s initiatives on behalf of small businesses is accessible via the website; threeListservs (regulatory communications, news, and research); and social media including LinkedIn, Twitter, andFacebook.Advocacy Website: https://advocacy.sba.gov/Subscribe for Alerts: https://advocacy.sba.gov/subscribe/Email Advocacy: advocacy@sba.govFacebook: https://www.facebook.com/AdvocacySBALinkedIn: s-administration-office-of-advocacy/Regulatory Reform Inbox: ory-reform-input/Twitter: https://www.twitter.com/AdvocacySBASmall Business Lending in the United States, 2019ii
AcknowledgmentsThis edition of Small Business Lending in the United States, 2019, which covers trends in small business lendingin 2019, was written and compiled by Economists Daniel Brown and Victoria Williams under the supervision ofthe Director of Economic Research, Patrick Delehanty. Economist Richard Schwinn assisted with the appendixtables. George Haynes of Montana State University prepared the data for the analysis under purchase order73351018P0054 to the Office of Advocacy. The editor of the report is David Tokarz.Small Business Lending in the United States, 2019iii
Table of ContentsIntroduction . 1Comparison of Call Report and CRA Data. 2Recent Developments in the Small Business Credit Market . 4I. Findings from the June 2019 Call Reports . 5A. Small Business Loans Outstanding from all Reporting Lending Institutions . 5B. Loan Size . 6C. Lending by Size of Lender and Number of Small Business Loans . 7D. Small Business Lending Measures . 8E. All Small Loans Outstanding from Multi-billion Dollar Lending Institutions . 11F. Small Business Loans and Minority Depository Lending Institutions . 12II. Findings from 2018 CRA Reporting Institutions . 14A. Small Business Lending by CRA Reporting Lending Institutions . 14B. Loans 100K or Less and Loans 100K– 1 Million by CRA Lending Institutions . 16Conclusion . 17Data Sources and Limitations . 18Data Sources . 18Data Limitations . 18Methodology. 19Definitions . 20References . 22Small Business Lending in the United States, 2019iv
IntroductionPurposeAccess to credit from lenders is vital for the survival and growth of small firms, an important source of economicgrowth to the U.S. economy. 99 percent of American firms are small businesses, which employ 47.1 percent ofthe private sector (SBA Advocacy, 2020a). Bank lenders continue to be important suppliers of credit to smallbusinesses, lending over 644 billion in small business loans in 2019. The growth of small businesses dependson how banks and other financial intermediaries respond to their credit needs. This report uses the latestpublicly available lending data from banks to examine changes in small business credit for June 2017 throughJune 2019 (see Box 1). The data used was collected prior to the 2020 COVID-19 pandemic and provides a precrisis benchmark on the state of small business lending.Structure and Coverage.This report captures the lending patterns of banks and other depository institutions in the small business creditmarket for loans 1 million or less. The Call Report and Community Reinvestment Act (CRA) databases show thechanges for small business loans, all commercial loans 1 million or less from banks, and the small businessloan size subcategories under 100,000 and 100,000 to 1 million. Both these databases cover only a portion ofthe credit extended to small businesses annually, excluding lending from nonbank institutions such as financecompanies and alternative lenders. This report presents findings from the Call Report data (lending data fromall FDIC reporting depository institutions) and the CRA data (lending data from banks above 1 billion in assetsby geographic area of the borrower) on small business lending by size and type of loan and size of lender.Additionally, the small business lending performance of banks is measured to indicate how lenders are meetingthe credit needs of small businesses. The four performance metrics of small business lending used are: Number of loansAggregate lendingTotal asset ratioTotal small business loan ratioThe report uses these measures to evaluate bank lending at the national level, and, in the state tables online, tohighlight individual bank’s lending activity to small businesses. This report covers all federal insured depositorylending institutions filing Call Reports (savings banks, cooperative banks, savings and loan associations, andcommercial banks) except for credit unions and foreign banks. While the report provides analyses for all smallbusiness lenders, the information available does not make it possible to distinguish SBA-guaranteed lenders orSBA-guaranteed loans. Geographic coverage includes the 50 states, the District of Columbia, and selected U.S.territories. 11The territories covered are the Federated States of Micronesia, Guam, Puerto Rico, and the U.S. Virgin Islands.Small Business Lending in the United States, 20191
DataData presented ranges from 2015-2019, with analyses focusing on changes for 2017-2019 for the June CallReports and for calendar year 2015-2018 for the CRA. 2 These reports are filed by depository lending institutionswith their respective regulatory agencies and cover two types of small business loans: Loans secured by nonfarm nonresidential properties, or commercial real estate (CRE) loans Commercial and industrial (C&I) loans.Data are available for the size of the loan, not for the size of the business borrower. Loan categories reported bylenders are done in three loan sizes: Loans of 250,000 through 1 million Loans of 100,000 through 250,000 Loans 100,000 or lessAdditional sizes are: 1 million and under, classified as small business loans 100,000 to 1 million3This report provides summary tables and figures to present national statistics on small business loans. Detailedinformation on U.S. banks and other depository institutions for each state are provided in table format on theU.S. Small Business Administration Office of Advocacy’s webpage at https://advocacy.sba.gov/.Comparison of Call Report and CRA DataWhile the Call Report and CRA data complement each other, the datasets measure different aspects of bankperformance and are not directly comparable. The Call Reports measure outstanding loan balances by locationof the lender’s headquarters for the reporting year ending in June. The CRA data, on the other hand, show loansoriginated in the state in which they are made during the calendar year. Box 1 summarizes each source’scharacteristics.23See the Appendix for additional information on these data sources.Previously referred to as “macro business loans.”Small Business Lending in the United States, 20192
Box 1. Comparison of Call Report and CRA Data in the Small Business Lending StudyData yearCall Report DataCRA Data2017-20192016-2018Loan informationprovidedStock of outstanding business loanbalances, bi-annually. 4Loans originated and purchased over thecalendar year.How loan location isidentifiedState in which lender’s headquarters islocated.State in which the lender made the loan.Lenders reportingAll reporting lenders—depositorylending institutions and bank holdingcompanies.Depository lending institutions and bankholding companies with approximately 1billion or more in assets.These databases are the only publicly available comprehensive sources of small business bank lendingstatistics. However, they reflect only loans provided by federally insured lenders. There is a tendency toattribute all changes in small business lending solely to bankers’ willingness to extend credit. However, smallfirms have access to other sources of credit, such as their suppliers, finance companies, marketplace lenders,family and friends, and others. To fully understand the small business loan market, reliable loan demand datafrom traditional lenders (such as banks), nonbank lenders, and marketplace lenders are needed, which is notincluded in this report. Thus, this report should be cautiously interpreted since demand data is lacking.Accessing the DataReaders can learn about the banks in their own communities and states by visiting Advocacy’s webpage, wherea list of all reporting banks in each state can be found. Detailed tables show state rankings of either the top 10or the top 10 percent of lenders in each state. Visit Advocacy’s webpage ss-lending-in-the-united-states-2019/ for the full listing rting in March 2017, data for small business loans for the Call Report is collected twice a year, June and December, instead ofquarterly.4Small Business Lending in the United States, 20193
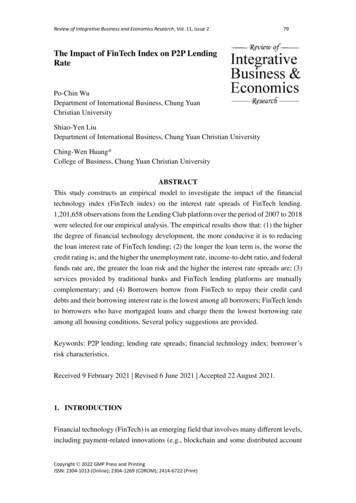
Recent Developments in the Small Business Credit MarketAmerica’s small businesses have struggled to navigate the current economic environment resulting from theCOVID-19 pandemic. As small businesses experienced disruption from social distancing orders, the economiceffects of the pandemic were deep and immediate. Consequently, policymakers took action to assist small firmsthrough the economic challenges and help stabilize the economy by creating programs such as the PaycheckProtection Program (PPP), established by the CARES Act. Between April to August 2020, banks of all sizes playeda key role in distributing vital PPP loans to provide relief to small businesses for retaining workers and coveringexpenses so they could stay afloat. 5 While the current impacts of the pandemic on small businesses are evolvingand real-time data is limited, the data herein provides a benchmark of small business lending activities bybanks prior to the pandemic.Prior to the pandemic, financial market conditions were conducive to economic growth as the U.S. economycontinued to improve. Small business lending remained stable as it had been over nearly a decade. However,the annual growth rate for real gross domestic product (GDP) was uneven over the last few years and grew at aslower pace in 2019 when compared with 2017 (Figure 1). While estimates of small business contributions toGDP are not available yet for recent years, the latest study on the topic found that small business GDP hasgrown by 25 percent in real terms from 1998 to 2014 (Kobe & Schwinn, 2018). Loan terms remained favorable forbusinesses. Bankers reported easing several terms on commercial and industrial (C&I) loans, but demand forthese loans to small firms continued to weaken (FRB, 2019).6 According to the Senior Loan Officer OpinionSurvey (SLOOS), the decline in demand was partly due to firms making use of internally generated funding orthe use of alternative financing sources. While loan approval rates at banks remained strong at the end of 2019,alternative lenders had even higher approval rates (SBA Advocacy, 2020).Figure 1. Percent Change in Small Business Loan Balances and Gross Domestic ProductNote: Real Gross Domestic Product is seasonally adjusted.Source: Call Reports FDIC, and Gross Domestic Product, BEA.As of June 9, 2020, lenders with less than 10 billion in assets accounted for 44 percent of all PPP loans.The Senior Loan Office Opinion Survey on Bank Lending Practices is conducted quarterly by The Federal Reserve Board. Visit SeniorLoan Officer Opinion Survey on Bank Lending Practices or all Business Lending in the United States, 20194
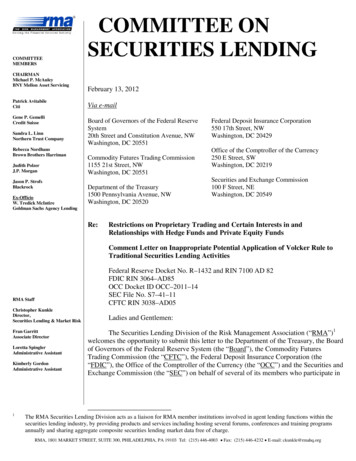
Research has shown that banking institutions have been major suppliers of small business credit. Nonetheless,alternative lenders such as online lenders have been slowly gaining market share by providing financialassistance to small business borrowers who have difficulty securing traditional credit. Small banks haveencountered an increasingly dynamic competitive landscape, with greater competition from both large banksand nonbank institutions as lending technology has improved (Jagtiani & Lemieux, 2016). Based on the FederalReserve Small Business Credit Survey on Employer Firms, banks remain small firms’ top choice when applyingfor credit, while online lenders have become small firms’ second choice. The speed of credit decisions and thechance of being funded are listed as top reasons why firms seek an online lender (Federal Reserve Banks, 2020).I. Findings from the June 2019 Call ReportsThe June 2019 Call Reports show that small business lending increased, driven by growth in smaller C&I loans,but at a slower pace than lending to large businesses. The vast majority of small business loans were from largerlenders, an expanding source of small business loans recently as they represent a growing share of theindustry’s assets. The number of small business loans from medium-sized lenders increased, particularly loansof 100k - 1 million, while the number of small business loans from large lenders fell.A. Small Business Loans Outstanding from all Reporting Lending InstitutionsBetween June 2017 and June 2019, the pace of lending from depository lenders was brisker for large businesslending compared to small business lending. Even though the Federal Open Market Committee (FOMC)continued to increase rates, they remained low relative to the mid-2000s (Figure 2). The rate of growth for smallbusiness loans ( 1 million or less) outstanding by depository lenders from June 2017 to June 2019 was 4.1percent, an increase from 619 billion to 645 billion (Tables A & B). During this period, large business loansexceeding 1 million grew by roughly 12 percent. The one-year increase for small business loans outstandingbetween June 2018 to June 2019 was roughly half that of the two-year growth rate at 1.9 percent, while for largebusiness loans the one-year growth rate was 6.7 percent. The number of small business loans declined duringthe two-year period by 11.3 percent (Table C).Figure 2. Relatively Low Interest Rates Over the Decade.Source: FREDSmall Business Lending in the United States, 20195
Small business loans consist of two categories: commercial industrial loans (C&I) and commercial real estate(CRE) loans ( 1 million or less). 7 Outstanding small business C&I loans totaled 368 billion in 2019, up from 337billion in 2017, a healthy growth rate of 9.2 percent. The corresponding growth rate for CRE was down 1.9percent. The share of small C&I loans of all small business loans has consistently increased over the last 8 yearsand was 57 percent in 2019, up from 54 percent over the two years.B. Loan SizeThe value and number of C&I and CRE loan categories are provided under three loan size buckets (under 100,000, 100,000- 250,000, and 250,001- 1 million). The smallest loan size (under 100,000) was the mostactive in terms of percentage changes for June 2017 to June 2019. The largest dollar volume decline for CRE wasin loans of 100,000 to 250,000, which were down by 2.4 billion, representing 45 percent of the overall declinein CRE loans over the two-year period. C&I loans under 100,000 had the largest dollar increase of 18.6 billionand accounted for 60 percent of the total increase in C&I loans. The percentage change in the number of loansfor both the total number of C&I and CRE was negative at double digits for the smallest loan size categories,along with the total number of small business loans (Table C). The statistic for the smallest loan size is difficultto interpret because of the inclusion of short-term credit from credit cards and continued efforts made by smallbusiness card issuers to consolidate their data reporting. 8Table A: Value of small business loans outstanding for depository lenders by loan type and size, 2015-2019.Billions of DollarsLoan Type and Size at OriginationCommercial Real EstateLess than 100,000 100,000 to 250,000 250,000 to 1 millionTotal Commercial Real 4-0.7-1.9Commercial and IndustrialLess than 100,000135.8145.2152.5162.2171.2 100,000 to 250,00050.353.854.657.260.4 250,000 to 1 million125.6129.3129.9133.5136.6Total Commercial and Industrial311.8328.3337352.8368.1TotalSmall Business Loans ( 1 million or less)599.0613.8618.9632.5644.5Large Business Loans (more than 1 s Loans2,718.82,946.83,084.33,217.83,402.8Assets of Depository Lenders14,095.214,886.2 15,414.1 15,762.4 16,357.1Number of BHC's and Independent Lenders5,9175,6525,4165,1924,958Note: Total domestics assets assets less foreign assets.Source: SBA, Office of Advocacy, tabulations from the Federal Deposit Insurance Corporation, June Call Reports.12.210.65.29.24.111.910.36.1-8.5Commercial industrial loans and commercial real estate loans when combined make up small business loans.Small business credit cards continue to play an important role in this loan size category where they account for majority of loans in thissmall business loan size category.78Small Business Lending in the United States, 20196
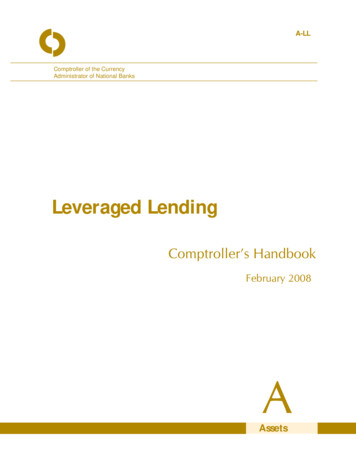
C. Lending by Size of Lender and Number of Small Business LoansBank lending activity to small businesses varied by bank size. Six bank sizes are presented in Table B. The sizesof these banks range from lenders with less than 100 million in assets to lenders with 50 billion or more inassets. Lenders with assets under 10 billion as a group had declines in outstanding small business loans fromJune 2017 to June 2019. Within this group, lenders with assets between 100 million to 499 million had thelargest dollar decline in outstanding small business loans, more than 8 billion. The largest percentage declinewas by lenders with less than 100 million. Conversely, lenders with 10 billion or more in assets experiencedincreases which helped offset the declines of other lenders. Lenders with 10 billion to 49 billion had thelargest dollar and percentage increase of 29 billion, or roughly 34 percent. The number of small business loansis dominated by lenders with assets of 50 billion or more. These lenders hold more than 76 percent of in thenumber of small business loans (Table D). The change in the number of small business loans varied across banksizes. The number of loans declined in all lender sizes except for those in the 10 billion to 49 billion range. Thegap in the number of small business loans has widened among banks with assets under 10 billion and thosewith 10 billion or more in assets. The gap narrowed in 2019 as the number of loans made by lenders with 10billion or more declined (Figure 3).Table B: Value of Small Business Loans Outstanding by Depository Lender Size, 2015-2019Billions of Dollars, NominalLenders by Total Asset SizeLess than 100 million 100 million to 499.9 million 500 million to 999.9 million 1 billion to 9.9 billion 10 billion to 49.9 billion 50 billion or moreTotal Small Business 98.582.251.9129.9114.5257.4644.5Percent Change2017-2019-18.1-9.2-6.6-2.433.85.64.1Source: SBA, Office of Advocacy, tabulations from the Federal Deposit Insurance Corporation, June Call Reports.Table C: Number of Small Business Loans Outstanding by Loan Type and Size, 2015-201920152016201720182019Percent -5.7-1.9-5.0Commercial and IndustrialLess than 100,000 100,000 to 250,000 250,000 to 1 millionTotal Commercial and -12.512.16.2-11.6Total Small Business Loans24.2226.0726.4325.9923.44-11.3Loan Type and Size at OriginationCommercial Real EstateLess than 100,000 100,000 to 250,000 250,000 to 1 millionTotal Commercial Real EstateSource: SBA, Office of Advocacy, tabulations from the Federal Deposit Insurance Corporation, June Call Reports.Small Business Lending in the United States, 20197
Table D: Number of Small Business Loans Outstanding by Lender Size, 2015 to 2019Lenders by Total Asset SizeLess than 100 million 100 million to 499.9 million 500 million to 999.9 million 1 billion to 9.9 billion 10 billion to 49.9 billion 50 billion or ercent Change2017-2019-21.9-14.8-8.0-2.315.9-13.9Total Small Business Loans24.2226.0726.4325.9923.44-11.3Source: SBA, Office of Advocacy, tabulations from the Federal Deposit Insurance Corporation, June Call Reports.Figure 3. The Gap in the Number of Small Business Loans by Bank Size Has Widened Since 2009Source: Call Reports FDIC.D. Small Business Lending Measures: The Total Asset Ratio and Total Small Business LoanRatioSmall business lending performance is measured in this report as: small business loans as a percentage of afirm’s total assets and a firm’s total business loans. The ratio between total amount of small business loans tothe lender’s total assets is called the “total asset ratio.” 9The Total Asset Ratio represents the percentage of a lender’s assets that is allocated to small businessborrowers. Tables E and F show the total asset ratios by loan size, loan category, and asset size of lender. TableE shows that small business borrowers seeking CRE loans were less successful, indicated in a drop of 4.2percent, while C&I loans were relatively unchanged between 2017 and 2019. Overall, the total asset ratio forsmall business loans has consistently declined over the decade, with the largest declines occurring in thesmallest loan sizes.The ratios used in Tables E-G are the mean ratios for all lenders. These ratios are derived by computing the ratio for each lender, thencomputing the mean for all lenders in each category shown. See the Appendix for additional information.9Small Business Lending in the United States, 20198
The total asset ratio in Table F declines as the lender asset size increases, a trend that has continued over thedecade. For example, in 2019, the smallest lenders held about 13 percent of their total assets in small businessloans. The largest lenders had a small business loan share of less than 3 percent. The largest lenders also hadthe largest percentage declines. While the total asset ratio has declined for small business loans from alllenders, lenders with asset sizes between 1 billion to 49 billion increased their small business shares betweenJune 2017 – June 2019.Table E. Total Asset Ratios, 2015-2019(value of small business loans outstanding to the value of loan type, percent)Loan Type and Size at OriginationCommercial Real EstateLess than 100,000 100,000 to 250,000 250,000 to 1 millionTotal Commercial Real EstateCommercial and IndustrialLess than 100,000 100,000 to 250,000 250,000 to 1 millionTotal Commercial and IndustrialTotal Small Business Loans ( 1 million orless)20152016201720182019Percent .30.413.2413.0412.8512.7512.54-2.4Source: SBA, Office of Advocacy, tabulations from the Federal Deposit Insurance Corporation, June Call Reports.Table F. Total Asset Ratio by Lender Size, 2015-2019(value of small business loans outstanding to the value of lender assets by lender size, percent)Lenders by Total Asset SizeLess than 100 million 100 million to 499.9 million 500 million to 999.9 million 1 billion to 9.9 billion 10 billion to 49.9 billion 50 billion or 75.992.61Percent Change2017-2019-1.8-1.8-2.61.711.0-11.2Total Small Business Loans13.2413.0412.8512.7512.54-2.4Source: SBA, Office of Advocacy, tabulations from the Federal Deposit Insurance Corporation, June Call Reports.The Total Small Business Loan Ratio is used to evaluate the performance of small business loans by showing thetotal small business share of total business loans. Tables G and H present small business loan ratios by loan andlender size. Like the total asset ratio, the small business loan ratio has steadily declined over the last few years,dropping from 64.9 percent in 2015 to 59.6 percent in 2019. The total small business loan ratio declined by 3.8percent between 2017-2019 and declined the most for the smallest loans (Table G). C&I loans between 100k toSmall Business Lending in the United States, 20199
1 million had better outcomes that helped counterbalance the total decline in the small business loan ratio.The total ratios for both CRE and C&I continued to fall, suggesting that small business borrowers seeking loanshave been less successful than large businesses in obtaining business loans.Table H shows the ratio for small business loans by lender size and indicates that the business loan portfolio ofsmaller lenders is dominated by small business loans (Figure 4). Between 2017 and 2019, all lender categories(except those with 10 billion to 49 billion) had declines. The largest lenders had the largest decline at 7percent.Table G. Total Small Business Loan Ratio by Loan Type and Size, 2015-2019Ratio (percent of total business loans outstanding)Loan Type and Size at OriginationCommercial Real EstateLess than 100,000 100,000 to 250,000 250,000 to 1 millionTotal Commercial Real 2-6.1Commercial and IndustrialLess than 100,000 100,000 to 250,000 250,000 to 1 millionTotal Commercial and -3.41.51.8-0.5Total Small Business Loans ( 1 million or64.8763.5161.9360.6259.60-3.8less)Source: SBA, Office of Advocacy, tabulations from the Federal Deposit Insurance Corporation, June Call Reports.Table H. Total Small Business Loan Ratio by Lender Size, 2015-2019Ratio (percent of total business loans outstanding)Lenders by Total Asset SizeLess than 100 million 100 million to 499.9 million 500 million to 999.9 million 1 billion to 9.9 billion 10 billion to 49.9 billion 50 billion or 1.3541.4830.1621.2918.71Percent Change2017-2019-0.2-2.4-3.0-1.52.4-7.0Total Small Business Loans64.8763.5161.9360.6259.60-3.8Source: SBA, Office of Advocacy, tabulations from the Federal Deposit Insurance Corporation, June Call Reports.Small Business Lending in the United State
businesses, lending over 6 44 billion in small business loans in 2019. The growth of small businesses depend s on how banks and other financial intermediaries respond to their credit needs . This report uses the latest publicly available lending data from banks to examine changes in small business credit for June 2017 through June 2019 (see .