Transcription
Small Business Lending Underthe Community Reinvestment ActRaphael W. BosticUniversity of Southern CaliforniaHyojung LeeJoint Center for Housing Studies of Harvard UniversityAbstractThis article reviews small business lending patterns from 1996 to 2015 and examinesthe role of the Community Reinvestment Act (CRA) in shaping small business lendingpatterns. Using the data that have been reported pursuant to the CRA, we observe thatthe number of small business loans dramatically increased from 1996 to 2015, while theloan volumes remained essentially unchanged, which translates into a significant declinein the size of the average small business loan. Next, using a regression discontinuity design,we seek linkages between changes in small business lending in a census tract during threedistinct periods—1996 to 2002, 2003 to 2011, and 2012 to 2015—and that tract’s statusas being covered by the CRA. We observe a positive association between small businesslending and the CRA from 1996 to 2002 and from 2012 to 2015 and observe a negativeassociation from 2003 to 2011. The findings are consistent with a view that bankinginstitutions strategically respond to the CRA, but that the incentives presented bymacroeconomic market conditions can overwhelm any incentives the CRA provides.IntroductionCapital is the lifeblood of every community. For a community’s residents, capital is critical for purchasing durable goods, such as appliances and a car, that are essential for a family’s day-to-day life.In addition, families generally need capital in order to achieve homeownership, which is a primaryvehicle for building wealth and avoiding the costs associated with housing instability (Green andWhite, 1997; Gyourko, Linneman, and Wachter, 1999; Linneman and Wachter, 1989; Sinai andSouleles, 2005; Turner and Luea, 2009). Capital is also essential for a community’s businesses,Cityscape: A Journal of Policy Development and Research Volume 19 Number 2 2017U.S. Department of Housing and Urban Development Office of Policy Development and ResearchCityscape 63
Bostic and Leewhich use capital to acquire land and equipment that are needed to stand up and operate theirenterprises. Business success is essential for communities, as businesses are an important source ofjobs and provide the basic services that enable communities to function and thrive.Given this essential role of capital for community health, access to capital and credit has been aconcern of policymakers for decades. A large volume of evidence has made clear that capital markets have fallen short where equal access is concerned, which has triggered legislative action to tryto improve the state of capital access (Blanchflower, Levine, and Zimmerman, 2003; Munnell etal., 1996). The Community Reinvestment Act1 of 1977 (CRA) is one such piece of legislation. TheCRA seeks to ensure that banking institutions reinvest a significant portion of the deposits theytake from local communities back into those communities (Garwood and Smith, 1993). The CRAalso establishes that a banking institution’s record of reinvestment will be considered as a factorwhen that institution seeks to acquire other institutions or complete another activity that requiresregulatory approval.A revision to the CRA in 1995 gave the act an additional role—to monitor the performance ofbanking institutions in providing small business credit. The CRA revision established that bankinginstitutions must report on their lending to small businesses and their provision of small loans tobusinesses (Canner, 1999). The article uses the data that have been compiled under the CRA todescribe changes in small business lending from 1996 to 2015 and examine the role of the CRA inshaping small business lending patterns.We begin by reviewing the literature examining how the CRA has influenced banking activity, particularly mortgage and small business lending. We then introduce our methodology and data setthat are used in this article. The subsequent section describes the patterns in small business lending from 1996 to 2015 at a national level. The next-to-last examines the effectiveness of the CRAon small business lending, using a regression discontinuity design (RDD). The final section concludes by summarizing the findings and considering some potential implications of the findings.Literature Review—The Effect of the CRAThe literature on the effects of the CRA has focused on how banks engage with local communityorganizations, the volume and distribution of mortgage loans, and the volume and distribution ofsmall business loans. One response of banking institutions to the introduction of CRA has beento enter into agreements with local organizations, whereby banking institutions pledge to devotesignificant resources to support CRA objectives. Several studies have sought evidence of whetherthese agreements are associated with increases in lending activities. Bostic and Robinson (2003)found a positive association between the number of new CRA agreements in a county and lendingin that county during a 3-year period. Bostic and Robinson (2005) similarly found that bankinginstitutions that enter into CRA agreements increase their lending activity when the agreement is inforce and maintain higher levels of lending even after the agreement has expired.1Pub. L. 95–128, 91 Stat. 1147, Title VIII.64 The CRA Turns 40
Small Business Lending Under the Community Reinvestment ActRegarding mortgage lending, a number of studies have sought to quantify the impact of the CRAon the volume and distribution of loans. We highlight only a few here. Based on a survey of banking institutions, Avery, Bostic, and Canner (2005) found that the CRA induced institutions toengage in lending that they would not have and that most of these new activities were profitable.Bhutta (2011) found that the CRA was associated with increases in mortgage lending in large metropolitan areas in the late 1990s and early 2000s, although effects were not significant on averagefor the entire nation. Bhutta concluded that government interventions to offset information externalities that suppress credit supply may be justified. Gabriel and Rosenthal (2008) compared theeffects of the CRA, which targets banking institutions, with similar regulations that target activitiesof Fannie Mae and Freddie Mac. Their results are mixed, although they found weak evidence thatthe CRA increases homeownership in CRA-eligible tracts. More recently, some have argued that theCRA was the main catalyst of the financial crisis of the mid-2000s (Agarwal et al., 2012), althoughthe evidence strongly suggests otherwise (Avery and Brevoort, 2015; Reid et al., 2013).The literature on the CRA’s impact on small business lending is much smaller than the literatureon the law’s impacts on mortgage lending. Zinman (2002) was the first paper, to our knowledge,that examined the (causal) effects of the CRA on small business lending. Using a framework thatis analogous to a triple difference approach, the author compared the dollar amount of small business loans outstanding of banks and commercial borrowers by their bank asset size and regulatortoughness in the wake of the 1995 CRA reforms. Also, Zinman restricted the bank sample to thosearound the CRA asset size cutoff (between 150 million and 350 million) to control for any unobserved bank characteristics (regression discontinuity sample). The estimates found in the papersuggest that the CRA (specifically, the 1995 CRA reforms) increased small business lending by 15percent of base period lending, which ultimately led the CRA-affected areas to increase payroll andreduce bankruptcies.A more recent attempt to assess the effectiveness of the CRA on small business lending is foundin Bates and Robb (2015). From an analysis based on the Kauffman Firm Survey, the paper foundpositive associations between minority residential areas and loan availability between 2004 and2011. Although the authors interpreted the regression results as impacts of CRA, the methodologydoes not allow for a causal interpretation of the findings because the paper (1) equates minoritycommunities with the CRA eligible low- and moderate-income (LMI) neighborhoods and (2) usesZIP Codes rather census tracts as the geographic unit of analysis.In sum, relatively little documentation exists of how small business lending has evolved since theintroduction of the small business lending data reporting mandate, as part of the major reformsto the CRA in 1995. Relatively little work comprehensively describes patterns in small businesslending and empirically examines the effects of the CRA on small business lending. Using the mostcomprehensive and current data available, we will attempt to fill the gap in the existing literature.Method and DataTo examine the role of the CRA on small business lending, we use RDD. One of the key characteristics of the law is that the threshold for eligibility is clear: to be a “CRA-eligible” neighborhood, theMedian Family Income (hereafter, median income) in a tract should be less than 80 percent of theCityscape 65
Bostic and Leemedian income for the surrounding area. Given this regulatory framework, neighborhoods slightlybelow and above the CRA threshold are theoretically quite similar, save for their CRA designation.This close similarity enables us to view any discontinuities in outcomes at the threshold as effectsof the CRA. The RDD approach has been often used to evaluate the effectiveness of the CRA onhome mortgage lending (Avery and Brevoort, 2015; Berry and Lee, 2007; Bhutta, 2011; Gabrieland Rosenthal, 2008), but this article is the first to apply this approach to examine the CRA effectson small business lending.In a standard RDD, we estimate the impact of the CRA on small business lending as—,(1)whereis small business loan originations in census tract i in county j in year k.is anindicator that is equal to 1 if a census tract is a CRA-eligible LMI neighborhood, and the indicatoris equal to 0 otherwise.is a vector of neighborhood characteristics that are associated withsmall business lending, including the median income ratio between tract and corresponding metropolitan area. The model also includes county and year-fixed effects to control for any year- andlocation-specific heterogeneities.For the model, we use four samples: (1) all census tracts, (2) census tracts with a median incomeratio within 10 percentage points of the CRA cutoff, (3) tracts within 5 percentage points of thecutoff, and (4) tracts within 3 percentage points of the cutoff. The results based on all census tractsprovide a reference, but we focus on the narrower samples to estimate the effects of the CRA onsmall business lending. The narrower sample will enable a more accurate comparison, but at thecost of statistical power due to smaller sample size.The primary data used for the analysis are the 1996–2014 CRA aggregate flat files provided by theFederal Financial Institutions Examination Council (FFIEC).2 The CRA aggregate flat files includeinformation on the number and dollar amount of small business loans originated, aggregated atcensus tract level, by banks and thrifts. In the CRA report, small business loans are defined asbusiness loans of 1 million or less. The data also provide the number and dollar amount of thoseloans to businesses with gross annual revenues of 1 million or less. Although they provide relatively limited information as compared with the Home Mortgage Disclosure Act3 data, the CRAdata are the most comprehensive publicly available data on small business lending. Greenstone,Mas, and Nguyen (2015) reported that the CRA data cover approximately 86 percent of all loansamounting 1 million or less.Using the data set, we test the role of the CRA on four outcome variables: (1) number of smallbusiness loans ( 1 million or less), (2) dollar amount of small business loans, (3) number of smallbusiness loans to small firms (with gross annual revenues of 1 million or less), and (4) dollarThe 1995 CRA reform made depository institutions with assets above a certain asset-size threshold report small business,small farm, and community development lending activity that they originate. Since 2005, the CRA asset-size threshold isadjusted on an annual basis. It was 1 billion in 2005 and is 1.226 billion in 2017.3Pub. L. 94–200, 89 Stat. 1124.266 The CRA Turns 40
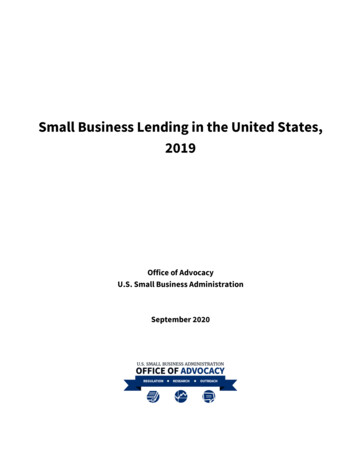
Small Business Lending Under the Community Reinvestment Actamount of small business loans to small firms. In this article, we focus on small business loan originations, rather than loan purchases, and restrict our sample to census tracts within metropolitanstatistical areas or metropolitan divisions.We supplement the CRA data with data from various other sources. First, we use data on everytract’s median income as a percentage of the median income for its surrounding metropolitanarea, included in the 1996-to-2014 census and demographics files provided by FFIEC. These dataenable us to identify those tracts that receive attention under the CRA based on the 80-percentthreshold. In addition, we use decennial censuses and the American Community Survey (ACS) tolink various neighborhood characteristics of the census tracts in which the small business loanswere originated to the CRA data. These characteristics include population, number of housingunits, vacancy rate, homeownership rate, minority population share, share of the population age25 and over, share of the population that has a bachelor’s degree, share of the population withincome less than the poverty rate, the ratio of the tract median income to the metropolitan areamedian income, median house value, and median gross rent. We link data from (1) the 1990 census to the CRA data from 1996 to 2002, (2) the 2000 census to the CRA data from 2003 to 2011,and (3) the 2010 census and the 2006–2010 ACS to the CRA data from 2012 to 2014. Lastly, weobtain the number of establishments from the ZIP Code Business Patterns database from 1996 to2014. As the data set is reported at ZIP Code level, we converted the data into census tracts usingpopulation as weights.Trends in Small Business LendingWe begin our analysis by presenting trends in the small business lending from 1996 to 2015, focusing on the small business loans originated in LMI neighborhoods. Panel A of Exhibit 1 showsthe number and dollar volume of small business loans by income category of census tracts. In2015, the depository institutions subject to the CRA originated 5.7 million small business loanstotaling 219.2 billion.4 The number and dollar amounts have changed dramatically during theperiod from 1996 to 2015, corresponding to some extent to the business cycle fluctuations duringthe period. The number of small business loans exploded from 2.3 million in 1996 to 13.1 millionin 2007 before plummeting to 4.0 million in 2010. The average loan size shrank dramatically between 1996 and 2015; the total dollar volume of lending is effectively the same in 2015 as it was in1996, despite the fact that the number of loans in 2015 is more than double the number in 1996.As a consequence, the average loan size in 2015 ( 38,200) is only about 40 percent of the averageloan size in 1996 ( 93,650).The data for small business loans to small businesses show the same pattern (Panel B). Currentloan volumes are much higher in 2015 than in 1996, whereas real loan dollars are smaller in 2015than in 1996. Thus, the average small loan to businesses in 2015 ( 26,600) was only 37 percent ofthe average small loan in 1996 ( 70,900).Exhibit 2 shows how small business loans and loans to small businesses are distributed acrosscensus tracts grouped by relative median income. Although the number of loan originations has4All monetary amounts throughout this article are in 2016 dollars.Cityscape 67
Bostic and LeeExhibit 1Number and Dollar Amount of Small Business Loans by Income, 1996 to 2015Panel A. All Small Business 00720082009201020112012201320142015Number of Small Business Loans(in thousands)AllBelow50 to80 to120 219.2Dollar Amount of Loans(in billions)Below50 to80 14.240.685.4120 129.6109.171.363.669.571.872.773.678.9Panel B. Small Business Loans to Businesses WithGross Annual Revenues of 1 Million or 0720082009201020112012201320142015Number of Small Business Loans(in thousands)AllBelow50 to80 to120 68.976.175.275.272.780.1Dollar Amount of Loans(in billions)Below50 to80 .912.930.33.912.429.14.213.531.9120 0.627.424.527.428.128.127.230.5Notes: Based on the Federal Financial Institutions Examination Council’s tract classification rules, neighborhoods arecategorized by Median Family Income (MFI) into low- (less than 50% of MFI), moderate- (50 to 79% of MFI), middle- (80 to119% of MFI), and upper- (equal to or more than 120% of MFI) income. The sample is restricted to small business loans inmetropolitan statistical areas or metropolitan divisions, reported by the lending institutions that are subject to the CommunityReinvestment Act (CRA) of 1977. Dollar figures are adjusted to 2016 dollars.Source: 1996–2015 CRA aggregate flat files68 The CRA Turns 40
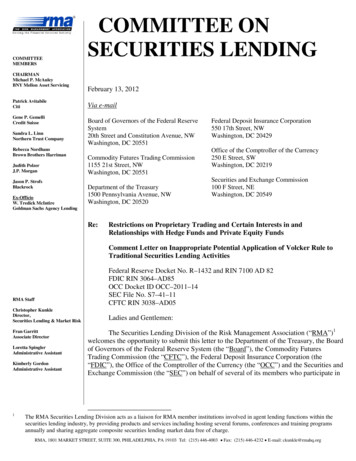
Small Business Lending Under the Community Reinvestment ActExhibit 2Distribution of Small Business Loan Dollars Across Tracts Grouped by RelativeMedian Income, 1996 to 2015Panel A. All Small Loans50.040.0Upper-income tracts(120 %)30.0Middle-income tracts(80 to 119%)20.0Moderate-income tracts(50 to 79%)10.0Low-income tracts(below 6200720082009201020112012201320142015Share of loan dollars (%)60.0Panel B. Small Loans to Small Businesses50.040.0Upper-income tracts(120 %)30.0Middle-income tracts(80 to 119%)20.0Moderate-income tracts(50 to 79%)10.0Low-income tracts(below 6200720082009201020112012201320142015Share of loan dollars (%)60.0Notes: Based on the Federal Financial Institutions Examination Council’s tract classification rules, neighborhoods arecategorized by Median Family Income (MFI) into low- (less than 50% of MFI), moderate- (50 to 79% of MFI), middle- (80 to119% of MFI), and upper- (equal to or more than 120% of MFI) income. The sample is restricted to small business loans inmetropolitan statistical areas or metropolitan divisions, reported by the lending institutions that are subject to the CommunityReinvestment Act (CRA) of 1977.Source: 1996–2015 CRA aggregate flat filesCityscape 69
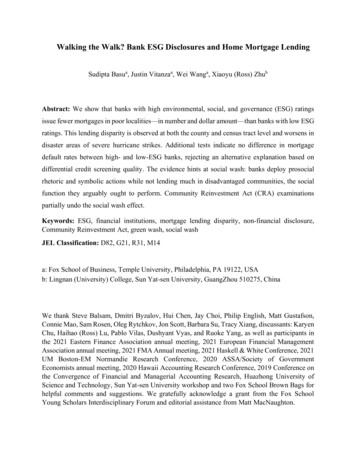
Bostic and Leefluctuated during the period, the dollar-calculated share of loans has been relatively stable, evenduring the financial crisis of 2007 through 2008. Upper- and middle-income tracts have receivedbetween 75 and 80 percent of small business loan dollars, while LMI tracts have received from 20to 25 percent of small business loan dollars. The skew of loan dollars to more affluent neighborhoods may not come as a surprise, but the lack of variation through the difference stages of thebusiness cycle does.5 One might have expected increasing concentrations in higher-income tractsas the economy weakened. One sees similar trends when shares are calculated based on the number of loans.6Regression Discontinuity AnalysisTo examine whether the evidence is consistent with the view that the CRA influences small business lending, we pooled the CRA aggregate flat files from 1996 to 2014 and conducted regressionsusing samples that vary in terms of the bandwidths around the 80-percent CRA eligibility threshold (regression discontinuity samples). Exhibit 3 presents the results for regressions including fourdistinct dependent variables: (1) number of small business loans (panel A), (2) dollar amount ofsmall business loans (panel B), (3) number of small business loans to firms with gross annual revenues of 1 million or less (panel C), and (4) dollar amount of small business loans to firms withgross annual revenues of 1 million or less (panel D).Before turning to the main relationships of interest, we discuss the relationships between the dependent variables and the covariates. The relationships are largely consistent across the four regressions and conform to expectations. Small business lending activity, whether measured in terms ofthe number of loans or the loan dollar volume, is greater in census tracts with more business establishments and more residents with college degrees and less in tracts with higher homeownershiprates, minority population shares, unemployment rates, median rents, and median house value.We also generally observe less small business lending activity in tracts with larger populations andin tracts with higher vacancy rates. The one exception is that the results show that small businesslending activity is higher in tracts that have higher poverty rates. This finding is somewhat surprising but could be explained by the fact that small businesses often lack the capital and cash flowsrequired to locate in more affluent communities. It could also be the result of general land use patterns, as higher-income neighborhoods tend to be more residential and not have large commercialcorridors. These relationships, which almost uniformly conform to what is seen in other researchon small business lending, suggest that the regression results represent legitimate relationships(Bates, 1997, 1991; Bates and Robb, 2015; Bostic and Lampani, 1999; Cavalluzzo and Cavalluzzo,1998; Immergluck, 1999, 2004).Turning to the variable of interest—being in a CRA-covered LMI tract—we see that the full sampleshows small significant positive relationships, which would generally be consistent with the ideathat the CRA had significant positive effects on small business lending activity. However, furtherexamination calls this interpretation into question. Coefficient estimates on LMI status becomeWe observe two discontinuities in the data, in 2002–2003 and in 2011–2012. We believe these discontinuities are a resultof updates to the census tract boundaries that occur with each decennial census.6The calculation, not shown in this article, is available on request from the authors.570 The CRA Turns 40
Small Business Lending Under the Community Reinvestment ActExhibit 3Results of Regression Discontinuity Analysis, 1996–2014 (1 of 4)Panel A. Number of Small Business LoansAll Tracts[70%, 90%)[75%, 85%)[77%, 83%)Sig.***Coef.0.559Sig.Coef.– 0.076Sig.Coef.0.142Neighborhood characteristicsPopulation0.001Housing units0.007Establishments0.512% vacancy0.224% homeownership– 0.181% minority– 0.347% bachelor’s or higher0.399% unemployed– 0.136% poverty0.354Median income ratio0.372Median gross rent– 0.008Median value– 0.000************************************– 0.0030.0100.504– 0.257– 0.285– 0.2910.2970.0150.2960.395– 0.022– 0.000************************************– 0.0010.0020.577– 0.076– 0.285– 0.3200.1530.0620.3640.217– 0.021– 0.000*****– 0.001– 0.0000.5930.021– 0.264– 0.3210.155– 0.3850.1160.468– 0.029– 0.000Year FEs (Ref. ****************************– 0.198– �� 0.538– � 1.219– 13106.78168.4973.437– 1.3948.74415.51613.19819.144LMI tractCounty FEsWithin R-squaredNumber of observationsCoef.1.3680.237– pe 71
Bostic and LeeExhibit 3Results of Regression Discontinuity Analysis, 1996–2014 (2 of 4)Panel B. Dollar Amount (in Thousands) of Small Business LoansAll TractsLMI tractCoef.157.284Neighborhood characteristicPopulation– 0.179Housing units– 0.094Establishments32.654% vacancy18.537% homeownership– 36.723% minority– 8.516% bachelor’s or– 11.465higher% unemployed– 13.881% poverty3.193Median income ratio24.015Median gross rent– 0.119Median value– 0.001Year FEs (Ref. 008200920102011201220132014County FEsWithin R-squaredNumber ofobservations72 The CRA Turns 4095.139– 3921,105.5991,492.4911,722.410876.474– 619.574– 929.205– 675.790– 634.690– 623.969– 658.897Yes0.2701,213,980[70%, 90%)[75%, 85%)[77%, 83%)Sig.***Coef.– 13.621Sig.Coef.– 43.193Sig.Coef.10.004Sig.*********************– 0.3690.20231.599– 4.303– 34.483– 7.396– 20.361********– 0.244– 0.38135.0719.988– 35.554– 11.817– 24.934********************– 0.179– 0.50734.64813.483– 34.592– 14.364– 26.071***********************************– 4.93717.70221.545– 0.001– 0.001**– 38.5809.12452.839– 0.528– 0.003***62.077– 795996.1821,231.2921,382.915728.665– 416.929– 664.522– 464.771– 375.300– 339.416– 825– 79.750120.315– 291,021.885353.352– 787.210– 1,040.692– 825.632– 533.726– 506.278– *****************************– 13.46922.18314.2000.159– 0.00167.704– 7391,094.2111,354.0651,480.346832.337– 308.445– 563.048– 345.630– 364.694– 327.930– ************************************
Small Business Lending Under the Community Reinvestment ActExhibit 3Results of Regression Discontinuity Analysis, 1996–2014 (3 of 4)Panel C. Number of Small Business Loans to Small FirmsAll TractsLMI tractCoef.– 0.163Neighborhood characteristicsPopulation0.001Housing units0.004Establishments0.179% vacancy0.004% homeownership– 0.062% minority– 0.132% bachelor’s or0.216higher% unemployed– 0.013% poverty0.113Median income ratio0.121Median gross rent– 0.004Median value– 0.000Year FEs (Ref. 008200920102011201220132014County FEsWithin R-squaredNumber ofobservations– 42.02349.47221.202– 3.132– 4.6857.3315.5087.1069.295Yes0.4011,213,980[70%, 90%)[75%, – 0.0010.0050.171– 0.190– 0.095– 0.1180.207*********************– 0.0000.0020.198– 0.115– 0.089– 0.1280.163************– 0.0230.1320.161– 0.010– 0.000*********– 0.0240.1540.186– **************– 2.276– 37.47214.502– 5.197– *****************************************– 2.340– 38.30115.531– 4.132– **********************[77%, 83%)Coef.0.358– 0.0000.0020.201– 0.088– 0.086– 0.1340.162Sig.*****************– 0.1150.0990.185– 0.012– 0.000*****– 2.542– 36.24513.625– 6.097– e 73
Bostic and LeeExhibit 3Results of Regression Discontinuity Analysis, 1996–2014 (4 of 4)Panel D. Dollar Amount (in Thousands) of Business Loans to Small FirmsAll TractsLMI tractCoef.85.835Neighborhood characteristicsPopulation– 0.038Housing units0.195Establishments10.252% vacancy2.184% homeownership– 13.259% minority– 3.264% bachelor’s or3.387higher% unemployed– 5.173% poverty3.021Median income ratio10.950Median gross rent– 0.180Median value– 0.000Year FEs (Ref. 008200920102011201220132014County FEsWithin R-squaredNumber 1.259798.475752.324528.510635.176609.20727.721– 529.544– 659.078– 540.328– 599.313– 610.139– 661.552Yes0.2851,213,980[70%, 90%)[75%, 85%)[77%, 83%)Sig.***Coef.– *********– 0.1300.2919.407– 8.414– 13.062– 2.8090.199******************– 0.0780.09010.3
describe changes in small business lending from 1996 to 2015 and examine the role of the CRA in shaping small business lending patterns. We begin by reviewing the literature examining how the CRA has influenced banking activity, par-ticularly mortgage and small business lending. We then introduce our methodology and data set