Transcription
A tutorial introduction to Bayesian models ofcognitive developmentAmy PerforsSchool of Psychology, University of AdelaideJoshua B. TenenbaumBrain and Cognitive Sciences, Massachusetts Institute of TechnologyThomas L. GriffithsFei XuDepartment of Psychology, University of California, Berkeley1
AbstractWe present an introduction to Bayesian inference as it is used in probabilisticmodels of cognitive development. Our goal is to provide an intuitive and accessibleguide to the what, the how, and the why of the Bayesian approach: what sortsof problems and data the framework is most relevant for, and how and why itmay be useful for developmentalists. We emphasize a qualitative understandingof Bayesian inference, but also include information about additional resources forthose interested in the cognitive science applications, mathematical foundations,or machine learning details in more depth. In addition, we discuss some importantinterpretation issues that often arise when evaluating Bayesian models in cognitivescience.Keywords: Bayesian models; cognitive development2
1IntroductionOne of the central questions of cognitive development is how we learn so much from suchapparently limited evidence. In learning about causal relations, reasoning about objectcategories or their properties, acquiring language, or constructing intuitive theories,children routinely draw inferences that go beyond the data they observe. Probabilisticmodels provide a general-purpose computational framework for exploring how a learnermight make these inductive leaps, explaining them as forms of Bayesian inference.This paper presents a tutorial overview of the Bayesian framework for studyingcognitive development. Our goal is to provide an intuitive and accessible guide tothe what, the how, and the why of the Bayesian approach: what sorts of problemsand data the framework is most relevant for, and how and why it may be useful fordevelopmentalists. We consider three general inductive problems that learners face,each grounded in specific developmental challenges:1. Inductive generalization from examples, with a focus on learning the referents ofwords for object categories.2. Acquiring inductive constraints, tuning and shaping prior knowledge from experience, with a focus on learning to learn categories.3. Learning inductive frameworks, constructing or selecting appropriate hypothesisspaces for inductive generalization, with applications to acquiring intuitive theories of mind and inferring hierarchical phrase structure in language.We also discuss several general issues as they bear on the use of Bayesian models:assumptions about optimality, biological plausibility, and what idealized models can tellus about actual human minds. The paper ends with an appendix containing a glossaryand a collection of useful resources for those interested in learning more.3
2Bayesian Basics: Inductive generalization fromexamplesThe most basic question the Bayesian framework addresses is how to update beliefs andmake inferences in light of observed data. In the spirit of Marr’s (1982) computationallevel of analysis, it begins with understanding the logic of the inference made whengeneralizing from examples, rather than the algorithmic steps or specific cognitive processes involved. A central assumption is that degrees of belief can be represented asprobabilities: that our conviction in some hypothesis h can be expressed as a real number ranging from 0 to 1, where 0 means something like “h is completely false” and 1that “h is completely true.” The framework also assumes that learners represent probability distributions and that they use these probabilities to represent uncertainty ininference. These assumptions turn the mathematics of probability theory into an engineof inference, a means of weighing each of a set of mutually exclusive and exhaustivehypotheses H to determine which best explain the observed data. Probability theorytells us how to compute the degree of belief in some hypothesis hi , given some data d.Computing degrees of belief as probabilities depends on two components. One,called the prior probability and denoted P (hi ), captures how much we believe in hiprior to observing the data d. The other, called the likelihood and denoted P (d hi ),captures the probability with which we would expect to observe the data d if hi weretrue. These combine to yield the posterior probability of hi , given via Bayes’ Rule:P (hi d) PP (d hi )P (hi ).hj H P (d hj )P (hj )(1)As we will see, the product of priors and likelihoods often has an intuitive interpretation.It balances between a sense of plausibility based on background knowledge on one handand the data-driven sense of a “suspicious coincidence” on the other. In the spiritof Ockham’s Razor, it expresses the tradeoff between the intrinsic complexity of anexplanation and how well it fits the observed data.4
The denominator in Equation 1 provides a normalizing term which is the sum ofthe probability of each of the possible hypotheses under consideration; this ensures thatBayes’ Rule will reflect the proportion of all of the probability that is assigned to anysingle hypothesis hi , and (relatedly) that the posterior probabilities of all hypothesessum to one. This captures what we might call the “law of conservation of belief”: arational learner has a fixed “mass” of belief to allocate over different hypotheses, and theact of observing data just pushes this mass around to different regions of the hypothesisspace. If the data lead us to strongly believe one hypothesis, we must decrease ourdegree of belief in all other hypotheses. By contrast, if the data strongly disfavor allbut one hypothesis, then (to paraphrase Sherlock Holmes) whichever remains, howeverimplausible a priori, is very likely to be the truth.To illustrate how Bayes’ Rule works in practice, let us consider a simple applicationwith three hypotheses. Imagine you see your friend Sally coughing. What could explainthis? One possibility (call it hcold ) is that Sally has a cold; another (call it hcancer isthat she has lung cancer; and yet another (call it hheartburn ) is that she has heartburn.Intuitively, in most contexts, hcold seems by far the most probable, and may even be theonly one that comes to mind consciously. Why? The likelihood favors hcold and hcancerover hheartburn , since colds and lung cancer cause coughing, while heartburn does not.The prior, however, favors hcold and hheartburn over hcancer : lung cancer is thankfully rare,while colds and heartburn are common. Thus the posterior probability – the productof these two terms – is high only for hcold .The intuitions here should be fairly clear, but to illustrate precisely how Bayes’Rule can be used to back them up, it can be helpful to assign numbers.1 Let us setthe priors as follows: P (hcold ) 0.5, P (hheartburn ) 0.4, and P (hcancer ) 0.1. Thiscaptures the intuition that colds are slightly more common than heartburn, but both are1Note that we have assumed that these are the only possible hypotheses, and that exactly oneapplies. That is why the priors are much higher than the base rates of these diseases. In a realsetting, there would be many more diseases under consideration, and each would have much lowerprior probability. They would also not be mutually exclusive. Adding such details would make themath more complex but not change anything else, so for clarity of exposition we consider only thesimplified version.5
significantly more common than cancer. We can set our likelihoods to be the following:P (d hcold ) 0.8, P (d hcancer ) 0.9, and P (d hheartburn ) 0.1. This captures theintuition that both colds and cancer tend to lead to coughing, and heartburn generallydoes not. Plugging this into Bayes’ Rule gives:P (d hcold )P (hcold )P (d hcold )P (hcold ) P (d hcancer )P (hcancer ) P (d hheartburn )P (hheartburn )(0.8)(0.5) (0.8)(0.5) (0.9)(0.1) (0.1)(0.4)0.4 0.7547.0.4 0.09 0.04P (hcold d) Thus, the probability that Sally is coughing because she has a cold is much higher thanthe probability of either of the other two hypotheses we considered. Of course, theseinferences could change with different data or in a different context. For instance, if thedata also included coughing up blood, chest pain, and shortness of breath, you mightstart to consider lung cancer as a real possibility: the likelihood now explains that databetter than a cold would, which begins to balance the low prior probability of cancerin the first place. On the other hand, if you had other information about Sally – e.g.,that she had been smoking two packs of cigarettes per day for 40 years – then it mightraise the prior probability of lung cancer in her case. Bayes’ Rule will respond to thesechanges in the likelihood or the prior in a way that accords with our intuitive reasoning.The Bayesian framework is generative, meaning that observed data are assumedto be generated by some underlying process or mechanism responsible for creating thedata. In the example above, data (symptoms) are generated by an underlying illness.More cognitively, words in a language may be generated by a grammar of some sort, incombination with social and pragmatic factors. In a physical system, observed eventsmay be generated by some underlying network of causal relations. The job of the learneris to evaluate different hypotheses about the underlying nature of the generative process,and to make predictions based on the most likely ones. A probabilistic model is simplya specification of the generative processes at work, identifying the steps (and associated6
probabilities) involved in generating data. Both priors and likelihoods are typicallydescribable in generative terms.To illustrate how the nature of the generative process can affect a learner’s inference,consider another example, also involving illness. Suppose you observe that 80% of thepeople around you are coughing. Is this a sign that a new virus is going around? Yourinference will depend on how those data were generated – in this case, whether it is arandom sample (composed, say, of people that you saw on public transport) or a nonrandom one (composed of people you see sitting in the waiting room at the doctor’soffice). The data are the same – 80% of people are coughing – regardless of how it wasgenerated, but the inferences are very different: you are more likely to conclude thata new virus is going around if you see 80% of people on the bus coughing. A doctor’soffice full of coughing people means little about whether a new virus is going around,since doctor’s offices are never full of healthy people.How can the logic of Bayesian inference, illustrated here with these medical examples, apply to problems like word and concept learning, the acquisition of language,or learning about causality or intuitive theories? In these cases, there is often a hugespace of hypotheses (possibly an infinite one). It may not be clear how the models inquestion should be interpreted generatively, since they seem to delineate sets (e.g., theset of instances in a concept, the set of grammatical sentences, or the set of phenomenaexplained by a theory). Here we illustrate how Bayesian inference works more generallyin the context of a simple schematic example. We will build on this example throughoutthe paper, and see how it applies and reflects problems of cognitive interest.Our simple example, shown graphically in Figure 1, uses dots to represent individualdata points (e.g., words or events) generated independently from some unknown process(e.g., a language or a causal network) that we depict in terms of a region or subset ofspace: the process generates data points randomly within its region, never outside.Just as each of the hypotheses in the medical example above (i.e., cold, heartburn,or cancer) are associated with different data (i.e., symptoms), each hypothesis here7
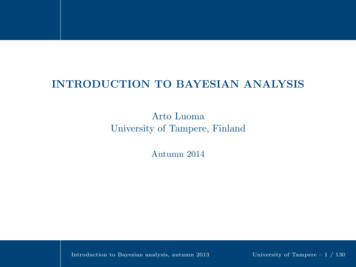
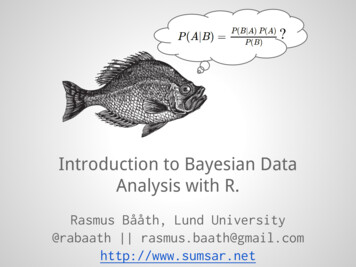
(i)(ii)Figure 1: (i) Example data and hypothesis. Graphical representation of data and onepossible hypothesis about how those data were generated. There are three hypotheseshere, each corresponding to a single rectangle. The black data points can only begenerated by the solid or the dashed rectangle. A new data point in position a mightbe generated if the dashed rectangle is correct, but not the solid or dotted one. (ii) Somehypotheses in the hypothesis space for this example. Hypotheses consist of rectangles;some are well-supported by the data and some are not.encodes a different idea about which subset of space the data are drawn from. Figure1(i) depicts three possible hypotheses, each consisting of a single rectangle in the space:hsolid corresponds to the solid line, hdashed to the dashed line, and hdotted to the dottedline. Before seeing data, a learner might have certain beliefs about which hypothesis ismost likely; perhaps they believe that all are equally likely, or they have a bias to prefersmaller or larger rectangles. These prior beliefs, whatever they are, would be capturedin the prior probability of each hypothesis: P (hsolid ), P (hdashed ), and P (hdotted ). Thedifferent hypotheses also yield different predictions about what data one would expectto see; in Figure 1(i), the data are consistent with hsolid and hdashed , but not hdotted ,since some of the points are not within the dotted rectangle. This would be reflected intheir likelihoods; P (d hsolid ) and P (d hdashed ) would both be non-zero, but P (d hdotted )would be zero. Bayesian inference can also yield predictions about about unobserveddata. For instance, one would only observe new data at position a if hdashed is correct,since P (a hsolid ) 0, but P (a hdashed ) 0. In this sense, inferring the hypotheses mostlikely to have generated the observed data guides the learner in generalizing beyondthe data to new situations.The hypothesis space H can be thought of as the set of all possible hypotheses,8
defined by the structure of the problem that the learner can entertain. Figure 1(ii)shows a possible hypothesis space for our example, consisting of all possible rectanglesin this space. Note that this hypothesis space is infinite in size, although just a fewrepresentative hypotheses are shown.The hypothesis space is defined by the nature of the learning problem, and thusprovided to the learner a priori. For instance, in our example, the hypothesis spacewould be constrained by the range of possible values for the lower corner (x and y),length (l), and width (w) of rectangular regions. Such constraints need not be verystrong or very limiting: for instance, one might simply specify that the range of possiblevalues for x, y, l, and w lies between 0 and some extremely large number like 109 , orbe drawn from a probability distribution with a very long tail. In this sense, the priorprobability of a hypothesis P (hi ) is also given by a probabilistic generative process –a process operating “one level up” from the process indexed by each hypothesis thatgenerates the observed data points. We will see below how these hypothesis spaces andpriors need not be built in, but can be constructed or modified from experience.In our example the hypothesis space has a very simple structure, but because aBayesian model can be defined for any well-specified generative framework, inferencecan operate over any representation that can be specified by a generative process. Thisincludes, among other possibilities, probability distributions in a space (appropriatefor phonemes as clusters in phonetic space); directed graphical models (appropriatefor causal reasoning); abstract structures including taxonomies (appropriate for someaspects of conceptual structure); objects as sets of features (appropriate for categorization and object understanding); word frequency counts (convenient for some typesof semantic representation); grammars (appropriate for syntax); argument structureframes (appropriate for verb knowledge); Markov models (appropriate for action planning or part-of-speech tagging); and even logical rules (appropriate for some aspects ofconceptual knowledge). The appendix contains a detailed list of papers that use theseand other representations.9
The representational flexibility of Bayesian models allows us to move beyond someof the traditional dichotomies that have shaped decades of research in cognitive development: structured knowledge vs. probabilistic learning (but not both), or innatestructured knowledge vs. learned unstructured knowledge (but not the possibility ofknowledge that is both learned and structured). As a result of this flexibility, traditional critiques of connectionism that focus on their inability to adequately capturecompositionality and systematicity (e.g., Fodor & Pylyshyn, 1988) do not apply toBayesian models. In fact, there are several recent examples of Bayesian models thatembrace language-like or compositional representations in domains ranging from causalinduction (Griffiths & Tenenbaum, 2009) to grammar learning (Perfors, Tenenbaum,& Regier, submitted) to theory acquisition (Kemp, Tenenbaum, Niyogi, & Griffiths,2010).2.1A case study: learning names for object categoriesTo illustrate more concretely how this basic Bayesian analysis of inductive generalizationapplies in cognitive development, consider the task a child faces in learning names forobject categories. This is a classic instance of the problem of induction in cognitivedevelopment, as many authors have observed. Even an apparently simple word like“dog” can refer to a potentially infinite number of hypotheses, including all dogs, allLabradors, all mammals, all animals, all pets, all four-legged creatures, all dogs exceptChihuahuas, all things with fur, all running things, etc. Despite the sheer number ofpossible extensions of the word, young children are surprisingly adept at acquiring themeanings of words – even when there are only a few examples, and even when there isno systematic negative evidence (Markman, 1989; Bloom, 2000).How do children learn word meanings so well, so quickly? One suggestion is that infants are born equipped with strong prior knowledge about what sort of word meaningsare natural (Carey, 1978; Markman, 1989), which constrains the possible hypothesesconsidered. For instance, even if a child is able to rule out part-objects as possible10
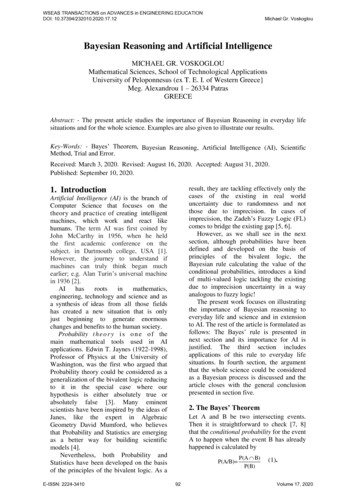
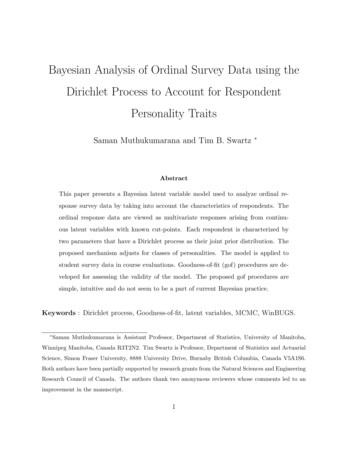
Figure 2: Schematic view of hypotheses about possible extensions considered by thelearner in Xu & Tenenbaum (2007); because the taxonomy is hierarchical, the hypotheses are nested within each other. Figure reproduced from Xu & Tenenbaum (2007).extensions, she cannot know what level of a taxonomy the word applies: whether “dog”actually refers to dogs, mammals, Labradors, canines, or living beings. One solutionwould be to add another constraint – the presumption that count nouns map preferentially to the basic level in a taxonomy (Rosch, Mervis, Gray, Johnson, & Boyes-Braem,1976). This preference would allow children to learn names for basic-level categories,but would be counterproductive for every other kind of word.Xu and Tenenbaum (2007b) present a Bayesian model of word learning that offersa precise account of how learners could make meaningful generalizations from one or afew examples of a novel word. This problem can be schematically depicted as in Figure2: for concepts that are organized in a hierarchical taxonomy, labelled examples areconsistent with multiple different extensions. For instance, a single label “Labrador”could pick out only Labradors, but it could also pick out dogs, animals, or living things.This problem is faced by a child who, shown one or many objects with a given label,must decide which hypothesis about possible extensions of the label is best. Intuitively,11
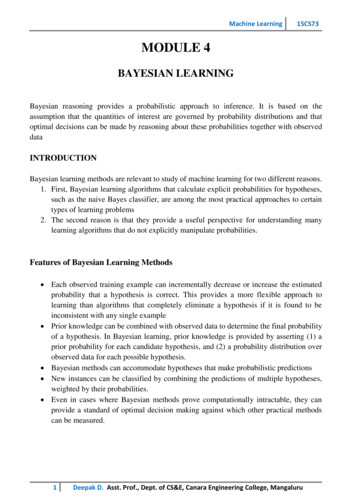
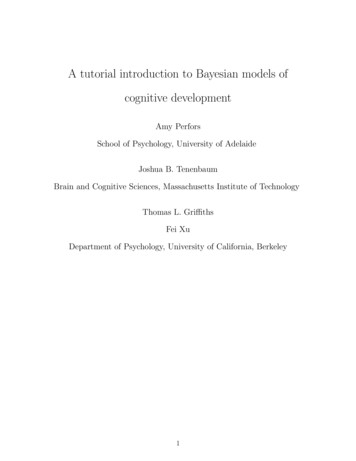
(i)(ii)Figure 3: Learning object words. (i) Hypothesis space that is conceptually similarto that in Figure 2, now depicted as a two-dimensional dot diagram; hypotheses withhigher probability are darker rectangles. With one data point, many hypotheses havesome support. (ii) With three examples, the most restrictive hypothesis is much morestrongly favored.we would expect that when given one object, a reasonable learner should not stronglyprefer any of the hypotheses that include it, though the more restricted ones might beslightly favored. If the learner were shown three examples, we would expect the mostclosely-fitting hypothesis to be much more strongly preferred. For instance, given oneLabrador as an example of a “fep”, it is unclear whether “fep” refers to Labradors,dogs, mammals, or animals. But if given three Labradors as the first three examples of“fep”, it would be quite surprising – a highly suspicious coincidence – if “fep” in factreferred to a much more general class such as all dogs.The same problem is depicted more abstractly in the dot diagram in Figure 3. Superordinate hypotheses (e.g., “animal”) are represented as larger rectangles. Sometimesthey fully enclose smaller rectangles (corresponding to more subordinate hypotheses),just as the extension of “animals” includes all Labradors. Sometimes they can also crosscut each other, just as the extension of “pets” includes many (but not all) Labradors.The smaller rectangles represent hypotheses with smaller extensions, and we can usethis to understand how Bayesian reasoning captures the notion of a suspicious coincidence, explaining the tendency to increasingly favor the smallest hypothesis that isconsistent with the data as the number of data points increases.This ability emerges due to the likelihood p(d h), the probability of observing the12
data d assuming hypothesis h is true. In general, more restrictive hypotheses, corresponding to smaller regions in the data space, receive more likelihood for a given pieceof data. If a small hypothesis is the correct extension of a word, then it is not toosurprising that the examples occur where they do; a larger hypothesis could be consistent with the same data points, but explains less well exactly why the data fall wherethey do. The more data points we observe falling in the same small region, the moreof a suspicious coincidence it would be if in fact the word’s extension corresponded toa much larger region.More formally, if we assume that data are sampled uniformly at random from allcases consistent with the concept, then the probability of any single data point d consistent with h is inversely proportional to the size of the region h picks out – call thisthe “size of h.” This is why when there is one data point, as in Figure 3(i), there is aslight preference for the most restrictive (smallest) hypothesis; however, the preferenceis only slight, because it could still easily have been generated by any of the hypotheses that include it. But if multiple data points are generated independently from theconcept, as in Figure 3(ii), the likelihood of h with n consistent examples is inverselyproportional to the size of h, raised to the nth power. Thus the preference for smallerconsistent hypotheses over larger hypotheses increases exponentially with the numberof examples, and the most restrictive consistent hypothesis is strongly favored. Thisassumption is often referred to as the size principle (Tenenbaum & Griffiths, 2001).The math behind the size principle is best understood concretely if we think aboutthe hypotheses as discrete subsets of possible objects we might observe, such as bagsof colored marbles, rather than as continuous regions such as rectangular regions in atwo-dimensional space. Suppose bag A contains two marbles (a red and a green) andbag B contains three (a red, a green, and a yellow). The probability of pulling the redmarble out of bag A is12 0.5, since there are two possible marbles to choose from.The probability of pulling the red marble out of bag B is13 0.33 for similar reasons.Thus, if you know only that a red marble has been pulled out of a bag (but not which13
bag it is), you might have a weak bias to think that it was pulled out of bag A, whichis0.50.33 1.67 times as likely as bag B.Now suppose that someone draws out the following series of marbles, shaking thebag fully between each draw: red, green, red, green. At this point most people wouldbe more certain that the bag is A. The size principle explains why. If the probabilityof pulling one red (or green) marble from bag A is 12 , the probability of pulling thatspecific series of marbles is12 12 12 12 124 116 0.0625, since each draw isindependent. By contrast, the probability of drawing those marbles from bag B is13 13 13 13 134 191 0.0109. This means that bag A is now0.06250.0109 5.73 timesas likely as B. In essence, the slight preference for the smaller bag is magnified overmany draws, since it becomes an increasingly unlikely coincidence for only red or greenmarbles to be drawn if there is also a yellow one in there. This can be magnified ifthe number of observations increases still further (e.g., consider observing a sequenceof red, green, red, green, green, green, red, green, red, red, green) or the relative sizeof the bags changes (e.g., suppose the observations are still red, green, red, green, butthat the larger bag contains six marbles, each of a different color, rather than three).In either case bag A is now preferred to bag B by over a factor of 80, and there is littledoubt that the marbles were drawn from bag A. In a similar way, a small hypothesismakes more precise predictions; thus, if the data are consistent with those predictions,then the smaller hypothesis is favored.The size principle explains how it is possible to make strong inferences based on veryfew examples. It also captures the notion of a suspicious coincidence: as the numberof examples increases, hypotheses that make specific predictions – those with moreexplanatory power – tend to be favored over those that are more vague. This providesa natural solution to the “no negative evidence” problem: deciding among hypothesesgiven positive-only examples. As the size of the data set approaches infinity, a Bayesianlearner rejects larger or more overgeneral hypotheses in favor of more precise ones. Withlimited amounts of data, the Bayesian approach can make more subtle predictions, as14
the graded size-based likelihood trades off against the preference for simplicity in theprior. The likelihood in Bayesian learning can thus be seen as a principled quantitativemeasure of the weight of implicit negative evidence – one that explains both how andwhen overgeneralization should occur.The results of Xu and Tenenbaum (2007b) reflect this idea. Adults and 3- and4-year-old children were presented with 45 objects distributed across three differentsuperordinate categories (animals, vegetables, and vehicles), including many basic-leveland subordinate-level categories within those. Subjects were then shown either one orthree labelled examples of a novel word such as “fep”, and were asked to pick out theother “feps” from the set of objects. Both children and adults responded differentlydepending on how many examples they were given. Just as in Figure 3, with oneexample, people and the model both showed graded generalization from subordinateto superordinate matches. By contrast, when given three examples, generalizationsbecame much sharper and were usually limited to the most restrictive level.This also illustrates how assumptions about the nature of the generative processaffect the types of inferences that can be made. We have seen that people tend showrestricted generalizations on the basis of three examples; however, this only if theythink the experimenter was choosing those examples sensibly (i.e., as examples of theconcept). If people think the data were generated in some other way – for instance, another learner was asking about those particular pictures – then their inferences change(Xu & Tenenbaum, 2007a). In this case, the lack of non-Labradors no longer reflectssomething the experimenter can control; though it is a coincidence, it is not a suspicious one. The data are the same, but the inference changes as the generative processunderlying the data changes. In other words, the size principle applies in just thosecases where the generative process is such that data are generated from the concept(or, more generally, hypothesis) itself.So far we have illustrated how Bayesian inference can capture generalization fromjust a few examples, the simultaneous learning of overlapping extensions, and the use15
of implicit negative evidence. All of these are important, but it is also true that wehave built in a great deal, including a restricted and well-specified hypothesis space.Very often, human learners must not make reasonable specific generalizations within aset hypothesis space, they also much be able to make generalizations about what sortof generalizations are reasonable. We see an example of this in the next section.3Acquiring inductive constraintsOne of the implications of classic problems of induction is the need for generalizationsabout generalizations, or inductive constraints, of some sort. The core problem is howinduction is justified based on a finite sample of any kind of data, and the inevitableconclusion is that there must be some kind of constraint that enables learning to occur.Nearly every domain studied by cognitive science yields evidence that children relyon higher-level inductive constraints. Children learning words prefer to apply themto whole objects rather than parts (Markman, 1990). Babies believe that agents aredistinct from objects in that they can move without contact (Spelke, Phillips, & Woodward, 1995) and act in certain ways in response to goals (Woodward, 1998; Gergely &Csibra, 2003). Confronted with evidence that children’s behavior is restricted in predictable ways, the natural response is to hypothesize the existence of innate constraints,including the whole object constraint (Markman, 1990) core systems of object repre
of Bayesian inference, but also include information about additional resources for those interested in the cognitive science applications, mathematical foundations, or machine learning details in more depth. In addition, we discuss some important interpretation issues that often arise when evaluating Bayesian models in cognitive science.