Transcription
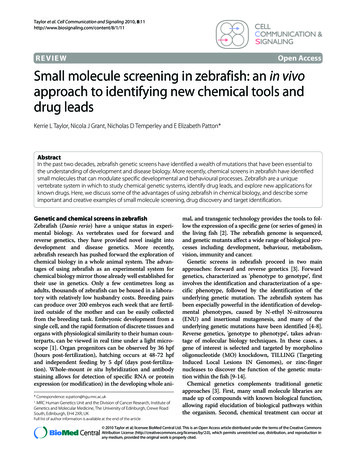
Electronic Supplementary Material (ESI) for Chemical Science.This journal is The Royal Society of Chemistry 2020Bioorthogonal mRNA labeling at the poly(A) tail for imaging localizationand dynamics in live zebrafish embryosKim J. Westerich,‡,[b] Karthik S. Chandrasekaran,‡,[c] Theresa Gross-Thebing,[b] Nadine Kück,[c] Erez Raz*[a,b] andAndrea Rentmeister*[a,c]1
Table of ContentsTable of Contents.2Experimental Procedures.2Enzymatic synthesis of mRNAs modified at the 5’ cap and the 3’ poly(A) tail.2Assessment of efficiency of SPAAC reaction.2Cell culture and confocal imaging.2Cell culture and western blot analysis .3Zebrafish work .3Construction of plasmids, mRNA synthesis and labeling .3Microinjection into zebrafish embryos.3RNAscope assay .4Microscopy and image analysis in zebrafish embryos.4Supplementary figures.5Supplementary tables .12References .12Author Contributions .12Experimental ProceduresEnzymatic synthesis of mRNAs modified at the 5’ cap and the 3’ poly(A) tailThe egfp and mcherry mRNAs were synthesized using the eGFP pMRNAxp mRNAExpress and mCherry pMRNAxp mRNAExpress vectors astemplates.[1] First, the DNA template was amplified in 1 HF puffer using plasmid (70 ng), dNTP mix (0.5 mM), forward primer (5’-TAA TAC GACTCA CTA TAG GGA AAT AAG-3’, 0.5 µM), reverse primer (5’-GTC GAC ACT AGT TCT AGA GCG-3’, 0.5 µM) and Phusion High-Fidelity DNAPolymerase (1 U). The resulting DNA was used as template (100 ng) for in vitro T7 transcription performed in 1 transcription buffer by addingA/C/UTP mix (0.5 mM), GTP (0.1 mM), ApppG or ARCA cap analog (1 mM), RiboLock RNase Inhibitor (30 U), T7 RNA polymerase (50 U) andpyrophosphatase (0.1 U) for 3 h at 37 C. Remaining DNA template was digested by incubation with 2 U of DNase I for 1 h at 37 C and then,mRNAs were purified using the RNA Clean & Concentrator -5 Kit (Zymo Research). The ARCA-capped egfp or mcherry mRNA (4000 ng) alone wassubjected to enzymatic addition of 2’-N3-2’-dATP (1 mM; TriLink Biotechnologies) to the poly(A) tail in the presence of yeast poly(A) polymerase(600 U) in 1 PAP reaction buffer for 1 h at 37 C followed by isopropanol precipitation overnight and washing with 70% ethanol. The clickreactions were performed with azido-modified mRNA (1000 ng) and DBCO-conjugated AF555 or AF647 or SRB or TAMRA or TexasRed or AF488or Sulfo-Cy5 or CR110 or alkyne-MegaStokes (75 µM; Jena Biosciences) for 1 h at 37 C followed by isopropanol precipitation overnight andwashing with 70% ethanol. Then, the modified and labeled mRNAs were analyzed by 7.5% denaturing PAGE and imaged using the Typhoon FLA9500 scanner and settings tabulated in Table S1. The Phusion PCR primers were from Biolegio. Phusion High-Fidelity DNA Polymerase, RiboLockRNA Inhibitor, T7 RNA polymerase, pyrophosphatase, DNase I and Yeast Poly(A) Polymerase (PAP) were purchased from Thermo Fisher Scientific.The m27,3′-OGP3G (ARCA) and the G(5′)ppp(5′)A (ApppG) cap analogs were purchased from Jena Bioscience. RiboRuler Low Range RNA Ladder fordenaturing PAGE was from Thermo Fischer Scientific. RNA estimations were performed using a TECAN Infinite M1000 PRO .Assessment of efficiency of SPAAC reactionFor the enzymatic addition of azido-modified ATPs to the 3'-end of RNA, 160 ng/µL RNA was incubated with 1 mM 2'-N3-2',3'-ddATP 24 U/µLyeast poly(A) polymerase for 1 h at 37 C. Following precipitation, 50 ng/µL azido-modified RNA and 50 µM DBCO-(PEG4)-biotin (Sigma-Aldrich)were incubated for 1 h at 37 C, and again precipitated. To digest the RNA to single nucleotides, 25 ng/µL RNA was incubated with 5 mU/µLnuclease P1 for 1 h at 50 C in 1x P1 digestion buffer. Subsequently, the nucleotides were dephosphorylated by adding FastAP with a finalconcentration of 50 mU/µL and incubating for 1 h at 37 C. The reaction was stopped by adding 10% v/v HClO4 (1 M). The nucleosides wereanalyzed by LC-QQQ (Agilent Ultivo).Cell culture and confocal imaging2
HeLa cells (Sigma Aldrich) were cultured in growth media comprising MEM Earle’s media (Merck) supplemented with L-glutamine (2 mM), nonessential amino acids (1%), penicillin and streptomycin (1%), and fetal calf serum (FCS, 10%) and under standard conditions (5% CO2, 37 C). Oneday before transfection, 2 105 cells were seeded in media (1 mL) on 15 mm cover slips in a 12-well cell culture plate. Cells were transfectedusing Metafectene Pro (3 µL) in MEM Earle’s media (47 µL) and egfp/mcherry mRNAs (1 µg) in MEM Earl’s media (50 µL) for 6 h at 37 C in atotal volume of 1 mL per chamber. Then, media with transfection reagent was replaced with fresh growth media. After 24 h, cells were washedtwice in 1 x PBS, fixed in 4% paraformaldehyde, washed again twice in 1 x PBS, stained with DAPI (10 µg/µL) for 30 s, washed twice with 1 x PBSand once quickly with water before the coverslips were quickly inverted and mounted on Aqua-Poly/Mount-coated microscope glass slides.Images were taken in using a Leica A TCS SP8 confocal laser scanning microscope with a 63x water-immersion objective and the settingstabulated in Table S2.Cell culture and western blot analysisFor western blot analysis, HeLa cells were cultured and transfected as described in the imaging experiments. Twenty-four hours aftertransfection, cells were lyzed using the protocol of the manufacturer for CelLytic M (Sigma Aldrich). To determine the protein concentration ofcell lysate, the Bradford assay was applied by diluting cell lysate (1:50) along with BSA calibration standards (0–10 µg/µL). Samples (50 µL) werethen incubated (15 min, rt, exclusion of light) with 1 Roti -Quant (Roth) staining solution (200 µL) and then, the extinction at 595 nm wasdetermined. Proteins were separated via tris-glycine-PAGE (10% PA, 120 V, 1.5 h, rt, 50 µg of protein) and then the proteins were transferredonto a nitrocellulose membrane Roti -NC (Roth) in semi-dry transfer buffer with 80 mA for 75 min at rt. After ascertaining transfer efficiencyusing Ponceaus S-staining, the membrane was cut into suitable pieces for subsequent antibody treatment and washed with 1 PBS 0.01%Tween (PBST). The membrane was blocked in blocking buffer (3% BSA) for 1 h at rt, followed by incubation with the anti-GFP or anti-α-tubulin(loading control) primary antibodies overnight at 4 C. Then the membrane was washed three times with PBST each for 5 min at rt. Themembrane pieces were then incubated with HRP-conjugated secondary antibodies for 1 h at rt and washed three times with PBST afterwards.For chemiluminescence detection the EZ-ECL Chemiluminescence detection kit (Biological Industries) was used and results were analysed with aChemo Star Advanced Fluorescence & ECL Imager (Intas). Primary antibodies for GFP (B-2) and α-tubulin were purchased from Santa CruzBiotechnology and Sigma Aldrich. Secondary antibody polyclonal rabbit anti-Mouse/HRP was from Dako Diagnostics.Zebrafish workWildtype zebrafish (Danio rerio) of the AB genetic background were used in all experiments. For the experiment presented in Figure 2B, the fishcarried a transgene that directs the expression of GFP on the membrane of PGCs (tg(kop:egfp-f’-nos3’UTR-cry:dsRed)).[2] The fish were handledaccording to the regulations of the state of North Rhine-Westphalia, supervised by the veterinarian office of the city of Muenster.Construction of plasmids, mRNA synthesis and labelingFor PGC-specific expression of cytoplasmic GFP (gfp-nos, internal database no. 355) and for marking germ granules with GFP-tagged Vasa protein(vasa-gfp, internal database no. 291), previously published constructs were used.70, 27 To distinguish between labelled injected mRNA andendogenous mRNA, a nos 3’UTR-containing construct was designed (STOP mcherry-nos, internal database no. D396). This construct contains anmcherry coding sequence, which can be detected in the RNAscope procedure using the mcherry probe. In this construct a single base pairinsertion was introduced following the start codon, leading to a stop codon after 24 nucleotides and no mCherry protein translation. Thisallowed detection of the red SRB signal of the click-labelled mRNA, with no spectral overlap with mCherry protein. For visualising mRNA via thePP7 detection system, a nos 3’UTR-containing construct was designed. In this construct 24 PP7-recognition loop sequences were inserted in the3’UTR (STOP nanos-nos 24xpPP7, internal database no. D016). The PP7 coat protein (PCP) was fused to a nuclear localization sequence (NLS) todirect unbound coat protein to the nucleus, and was tagged with a YFP for visualization of the protein (nls-ha-tdpcp-yfp-glob, internal databaseno. C987). BFP-tagged lifeact expressed in the germ cells using the nos 3’UTR (lifeact-tagbfp-nos, internal database no. E058) labelled actin richstructures in the PGCs with this fluorescent protein.Capped sense mRNAs were synthesized using the mMessage mMachine kit (Ambion) according to the protocol of the manufacturer. Then 4000ng of each mRNA was subjected to enzymatic addition of 2’-N3-2’-dATP as described above. The click reactions were performed with azidomodified mRNA (1000 ng) and DBCO-conjugated SRB (7.5 µM) for 60 min at 37 C followed by isopropanol precipitation overnight and washingwith 70% ethanol. Then, the labeled mRNAs were analyzed on a 7.5% denaturing PA gel.Microinjection into zebrafish embryosTo visualize the distribution of injected mRNAs in figures 3 and 4, 1 nL containing 80 pg or 200 pg of gfp-nos (internal database no. 355) or ofSTOP mcherry-nos (internal database no. D396) mRNAs either non-labeled or labelled with SRB were used. To visualize germ granules with GFPtagged Vasa protein, 1 nL containing 80 pg of vasa-gfp (internal database no. 291) mRNA was injected. For detection of nos 3’ UTR-containingmRNA using the click-labelling approach and the PP7 detection system in figure 5, 1 nl containing 80 pg of STOP mcherry-nos mRNA labeled withSRB were co-injected with an equimolar amount of STOP nanos-nos 24xPP7 mRNA (internal database no. D016). In addition, 8 pg of nls-ha-tdpcpyfp-glob (internal database no. C987) mRNA were co-injected to express the YFP-tagged PCP protein. To visualize PGCs in figure 5, 80 pg of3
lifeact-tagBFP-nos (internal database no. E058) were co-injected. mRNAs were injected into the yolk of 1 cell-stage zebrafish embryos using glasscapillaries and the PV830 Pneumatic PicoPump microinjector (WPI).RNAscope assayThe RNAscope in situ hybridization experiments were performed using the RNAscope Multiplex Fluorescent Reagent Kit (ACD Bio) as previouslydescribed.[3] RNAscope probes Probe Diluent (ACD Bio 300041), Dr-nanos3-CDS-C3 (ACD Bio 431191-C3) and mCherry-C2 (ACD Bio 431201-C2)were hybridized overnight at 40 C at a 50:1:1 ratio. Amp4 AltB was used as a label probe combination. DAPI solution was used to label all nuclei.Microscopy and image analysis in zebrafish embryosConfocal images were acquired on an LSM 710 microscope (Zeiss) equipped with 405, 488, 561 and 633 nm lasers and a 63x water-immersionobjective (Zeiss) controlled by the ZEN software (Zeiss, version 2010B SP1, 6.0). Time-lapses were acquired on a Yokogawa CSU-X1 Spinning Diskmicroscope equipped with a 63x water-immersion objective (Zeiss) and connected to a Piezo stage and a Hamamatsu Orca Flash 4.0 V3 camera.The microscopy setup was controlled by the VisiView software (Visitron, version 4.0.0.14). For the time-lapse movies, images were acquired at3.5 seconds intervals over a period of 206.5 seconds using an exposure of 200 ms. For each time point 18 different focal planes with a z-distanceof 0.5 µm were acquired. Images were processed using the Fiji software (National Institutes of Health, version 2.0.0-rc-43/1.51a). The 509 nmemission channels showing GFP-positive PGCs in figure 2 were processed with a background subtraction and gaussian filter to reduce signalnoise. Images were deconvolved with Huygens Professional version 19.04 (Scientific Volume Imaging, The Netherlands, http://svi.nl), using theCMLE algorithm, with a maximum of 40 iterations.4
Supplementary figuresH 3CH 3CSRBCH3NONOHNNOOOHNOSO CH3O-HNNONOOH ONSOO3OSOH 3CCH3NO-HNOOOOONH2 OOOOO3SO3HNSO3HOHOSulfo-Cy5HNNOOHNNH2 OHNNCR110NOO S OOOH 2NSO3HOH 2NCH3N CH3O-HN3N OHO S OONSO3HHNNOOO 3S -AF647AF488TAMRASO3HNOTexasRedOSO3HO O3HNN OSN NO 3S -AF555O 3S -N OO-HNONSO3HSO3HFigure S1. Representative molecular structures of the DBCO-fluorophores used for labeling egfp or mcherry mRNAs in the study. DBCO-PEG45/6-Sulforhodamine B (SRB), DBCO-AF555, DBCO-PEG4-5/6-Texas Red, DBCO-AF647, DBCO-PEG4-5/6-TAMRA, DBCO-AF488, DBCO-PEG4-5/6Carboxyrhodamine 110 (CR110), DBCO-Sulfo-Cy5 (Jena Biosciences)5
Figure S2. Bioorthogonal labeling of egfp mRNAs at the poly(A) tail with different fluorophores enables their visualization in HeLa cells.Confocal microscopy of HeLa cells transfected with egfp mRNA unlabeled (ApppG, ARCA, N3pA) or labeled with the DBCO-containingfluorophores AF555, AF647 or Sulfo-Cy5 (Cy5). Fluorescent signals from the fluorophores (red dots), EGFP and DAPI enabled visualization ofmRNA, translated GFP and nuclei, respectively. Scale bar 20 µm.6
Figure S3. Bioorthogonal labeling of mcherry mRNAs at the poly(A) tail with different fluorophores enables their visualization in HeLa cells.Confocal microscopy of HeLa cells transfected with mcherry mRNA either unlabeled (ApppG, ARCA, N3pA) or labeled with the DBCO-containingfluorophores AF488 or carboxyrhodamine 110 (CR110). Fluorescent signals from the fluorophores (green dots), mCherry and DAPI enabledvisualization of mRNA, translated mCherry and nuclei, respectively. Scale bar 20 µm.7
Figure S4. Bioorthogonal labeling of egfp mRNAs at the poly(A) tail with different fluorophores does not interfere with their translation.Western blotting showing levels of EGFP in whole-cell lysate of HeLa cells transfected with indicated unlabeled and labeled egfp mRNAs. αtubulin expression was used as loading control.Figure S5. Bioorthogonal labeling of egfp mRNAs at the poly(A) tail with different fluorophores does not interfere with their translation. In-gelfluorescence from SDS-PA gels showing levels of EGFP (A) or mCherry (B) (upper panels) and subsequently stained in CBB (lower panels) inwhole-cell lysate of HeLa cells transfected with indicated unlabeled and labeled egfp or mcherry mRNAs.8
Figure S6. Bioorthogonal labeling of STOP mcherry nos UTR and gfp nos UTR is efficient with DBCO-sulforhodamine B. The egfp-nos UTR andSTOP mcherry-nos UTR mRNAs clicked with DBCO-SRB. PAGE analysis of egfp-nos UTR and STOP mcherry-nos UTR mRNAs (7.5% PA gel, 20 W, 1.5h, rt) labeled with DBCO-SRB. Fluorescent signals from SRB observed using filter 1 ( 575 nm) and SYBRTM Gold staining are shown.9
Figure S7. Scheme of RNA constructs used for labeling and injection. The STOP mcherry nanos 3’UTR (STOP mCherry nos) construct is nottranslatable due to a frame shift in the coding sequence shortly after the initiation codon. Likewise, the STOP Nanos 24xPP7 construct is nottranslatable due to a mutation in the ATG start codon. GFP 714 bp, STOP mCherry 709 bp, nanos 3’UTR 631 bp, Vasa 1660 bp, vasa 3’UTR 498 bp, STOP Nanos 479 bp, PP7 loop sequence 1450 bp, NLS HA tdPCP 1602 bp, globin 3’UTR 191 bp.10
Figure S8 HPLC and LC-QQQ analysis of SPAAC reaction of RNAs modified at the 3′ end with 2′-azido-ddATP. RNAs were modified as indicated,then digested and dephosphorylated to single nucleosides for analysis. A) HPLC analysis at 260 nm shows the four nucleosides and azido-A(arrow) in the case of enzymatic modifications (red trace). After the click reaction, no azido-A is detectable, indicating complete conversion (bluetrace), similar to unmodified RNA (black trace). B) EIC for azido-A (M H 293.10), confirming the mass of the peak. C) EIC of the mass expectedfor the click product of azido-A with biotin (M H 1042.45), showing that the expected product is formed. D) EIC for azido-A after the clickreaction showing that no azido-A can be detected after the click reaction and also confirming complete conversion during the SPAAC reaction.11
Supplementary tablesTable S1. Settings for measurement of fluorescent signals on the Typhoon FLA 9500 scannerFluorophoreλmax [nm]λem [nm]excitation laser [nm]scanning filterSYBR PGLPRLPRLPBLPBTable S2. Settings for detection of fluorescent signals on the Leica A TCS SP8 confocal laser scanning microscopeFluorescent rySulfo-Cy5AF647λmax [nm]λem 72565585601610661671excitation laser [nm]405488488488552552552552552638638emission filterLP 425BP 527/30BP 527/30BP 527/30LP 590LP 590LP 590LP 590BP 700/75BP 700/75BP 700/75References[1][2][3]J. M. Holstein, L. Anhäuser, A. Rentmeister, Angewandte Chemie - International Edition 2016, 55, 10899-10903.H. Blaser, S. Eisenbeiss, M. Neumann, M. Reichman-Fried, B. Thisse, C. Thisse, E. Raz, Journal of Cell Science 2005, 118, 4027-4038.T. Gross-Thebing, A. Paksa, E. Raz, BMC Biology 2014.Author ContributionsK.W. and E.R. designed and K.W. performed the zebrafish-related experiments (Figures 3, 4, 5, Supplementary Figure 7 and supplemental movie1) and synthesized capped sense mRNAs used for bioorthogonal labeling in these figures. K.W. and E.R. wrote the parts of the manuscriptrelevant for Figures 3, 4, 5, supplementary figure 7 and supplemental movie 1). T.G-T. established and tested the PP7 RNA detection system andcontributed plasmids used in Figures 3, 4 and 5. K.S.C. and A.R. designed the experiments pertaining to mRNA labeling and cell cultureexperiments. K.S.C. performed the experiments presented in Figure 2, Supplemental figures 2-6, and labeled the mRNAs used in experimentspresented in Figures 3 and 4, and supplemental movie S1. N.K. labeled the mRNAs used in Figure 5 and performed experiments presented inFigure S8. K.S.C. and A.R. wrote the parts of the manuscript relevant to these figures and the introduction. E.R. and A.R. supervised thebiology/zebrafish and chemistry/cell culture parts of the project, respectively. All authors read and approved the final manuscript.12
The m 7,3′-OGP 3G (ARCA) and the G(5′)ppp(5′)A (ApppG) cap analogs were purchased from Jena Bioscience. RiboRuler Low Range RNA Ladder for denaturing PAGE was from Thermo Fischer Scientific. RNA estimations were performed using a TECAN Infinite M1000 PRO . Assessment of efficiency of SPAAC reaction