Transcription
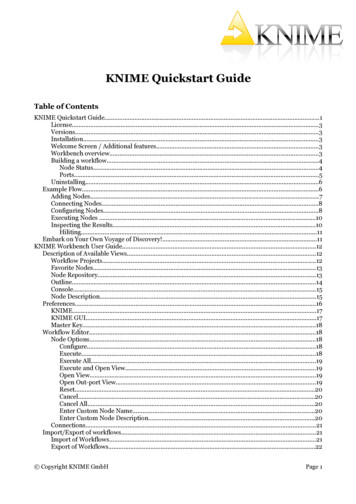
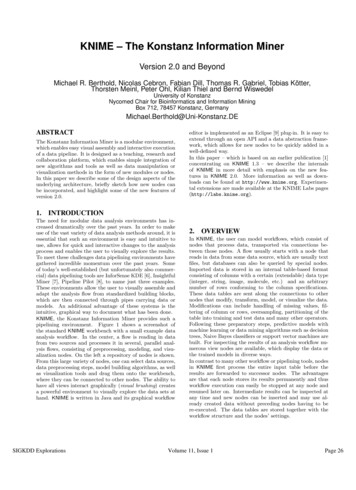
KNIME – The Konstanz Information MinerVersion 2.0 and BeyondMichael R. Berthold, Nicolas Cebron, Fabian Dill, Thomas R. Gabriel, Tobias Kötter,Thorsten Meinl, Peter Ohl, Kilian Thiel and Bernd WiswedelUniversity of KonstanzNycomed Chair for Bioinformatics and Information MiningBox 712, 78457 Konstanz, GermanyMichael.Berthold@Uni-Konstanz.DEABSTRACTThe Konstanz Information Miner is a modular environment,which enables easy visual assembly and interactive executionof a data pipeline. It is designed as a teaching, research andcollaboration platform, which enables simple integration ofnew algorithms and tools as well as data manipulation orvisualization methods in the form of new modules or nodes.In this paper we describe some of the design aspects of theunderlying architecture, briefly sketch how new nodes canbe incorporated, and highlight some of the new features ofversion 2.0.1.editor is implemented as an Eclipse [9] plug-in. It is easy toextend through an open API and a data abstraction framework, which allows for new nodes to be quickly added in awell-defined way.In this paper – which is based on an earlier publication [1]concentrating on KNIME 1.3 – we describe the internalsof KNIME in more detail with emphasis on the new features in KNIME 2.0. More information as well as downloads can be found at http://www.knime.org. Experimental extensions are made available at the KNIME Labs pages(http://labs.knime.org).INTRODUCTIONThe need for modular data analysis environments has increased dramatically over the past years. In order to makeuse of the vast variety of data analysis methods around, it isessential that such an environment is easy and intuitive touse, allows for quick and interactive changes to the analysisprocess and enables the user to visually explore the results.To meet these challenges data pipelining environments havegathered incredible momentum over the past years. Someof today’s well-established (but unfortunately also commercial) data pipelining tools are InforSense KDE [6], InsightfulMiner [7], Pipeline Pilot [8], to name just three examples.These environments allow the user to visually assemble andadapt the analysis flow from standardized building blocks,which are then connected through pipes carrying data ormodels. An additional advantage of these systems is theintuitive, graphical way to document what has been done.KNIME, the Konstanz Information Miner provides such apipelining environment. Figure 1 shows a screenshot ofthe standard KNIME workbench with a small example dataanalysis workflow. In the center, a flow is reading in datafrom two sources and processes it in several, parallel analysis flows, consisting of preprocessing, modeling, and visualization nodes. On the left a repository of nodes is shown.From this large variety of nodes, one can select data sources,data preprocessing steps, model building algorithms, as wellas visualization tools and drag them onto the workbench,where they can be connected to other nodes. The ability tohave all views interact graphically (visual brushing) createsa powerful environment to visually explore the data sets athand. KNIME is written in Java and its graphical workflowSIGKDD Explorations2.OVERVIEWIn KNIME, the user can model workflows, which consist ofnodes that process data, transported via connections between those nodes. A flow usually starts with a node thatreads in data from some data source, which are usually textfiles, but databases can also be queried by special nodes.Imported data is stored in an internal table-based formatconsisting of columns with a certain (extendable) data type(integer, string, image, molecule, etc.) and an arbitrarynumber of rows conforming to the column specifications.These data tables are sent along the connections to othernodes that modify, transform, model, or visualize the data.Modifications can include handling of missing values, filtering of column or rows, oversampling, partitioning of thetable into training and test data and many other operators.Following these preparatory steps, predictive models withmachine learning or data mining algorithms such as decisiontrees, Naive Bayes classifiers or support vector machines arebuilt. For inspecting the results of an analysis workflow numerous view nodes are available, which display the data orthe trained models in diverse ways.In contrast to many other workflow or pipelining tools, nodesin KNIME first process the entire input table before theresults are forwarded to successor nodes. The advantagesare that each node stores its results permanently and thusworkflow execution can easily be stopped at any node andresumed later on. Intermediate results can be inspected atany time and new nodes can be inserted and may use already created data without preceding nodes having to bere-executed. The data tables are stored together with theworkflow structure and the nodes’ settings.Volume 11, Issue 1Page 26
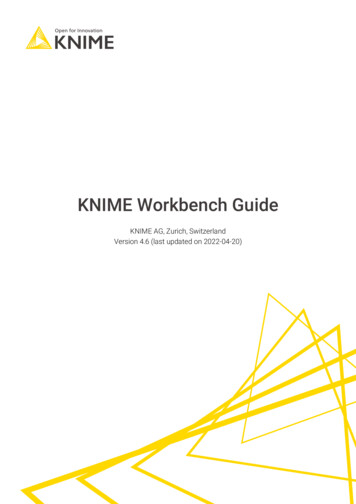
Figure 1: The KNIME workbench with a small example workflow.One of KNIME’s key features is hiliting. In its simplest form,it allows the user to select and highlight several rows in adata table and the same rows are also highlighted in all otherviews that show the same data table (or at least the highlited rows). This type of hiliting is simply accomplished byusing the 1:1 correspondence between the tables’ unique rowkeys. However, there are several nodes that change the inputtable’s structure and yet there is still some relation betweeninput and output rows. A good example for such a 1-to-n relation are clustering algorithms. One of the node’s input arethe training (or test) patterns, the output are cluster prototypes. Each of the clusters covers several input patterns.By hiliting one or more clusters in the output table all inputpatterns which are part of those cluster(s) are hilited in theinput table. Similar translations are, of course, also possiblefor other summarizing models: branches/leaves of a decisiontree, frequent patterns, discriminative molecular fragments,to name just three examples.One of the important design decisions was to ensure easy extensibility, so that other users can add functionality, usuallyin the form of new nodes (and sometimes also data types).This has already been done by several commercial vendorsbut also by other university groups or open source programmers. The usage of Eclipse as the core platform means thatcontributing nodes in the form of plugins is a very simpleprocedure. The official KNIME website offers several extension plugins for business intelligence and reporting viaBIRT [2], statistical analysis with R[4] or extended machinelearning capabilities from Weka [5], among many others.SIGKDD Explorations3.ARCHITECTUREThe architecture of KNIME was designed with three mainprinciples in mind. Visual, interactive framework: Data flows should becombined by simple drag&drop from a variety of processing units. Customized applications can be modeledthrough individual data pipelines. Modularity: Processing units and data containers shouldnot depend on each other in order to enable easy distribution of computation and allow for independent development of different algorithms. Data types are encapsulated, that is, no types are predefined, new typescan easily be added bringing along type specific renderers and comparators. New types can be declaredcompatible to existing types. Easy extensibility: It should be easy to add new processing nodes or views and distribute them through asimple plugin mechanism without the need for complicated install/deinstall procedures.In order to achieve this, a data analysis process consists ofa pipeline of nodes, connected by edges that transport either data or models. Each node processes the arriving dataand/or model(s) and produces results on its outputs whenrequested. Figure 2 schematically illustrates this process.The type of processing ranges from basic data operationssuch as filtering or merging to simple statistical functions,such as computations of mean, standard deviation or linearVolume 11, Issue 1Page 27
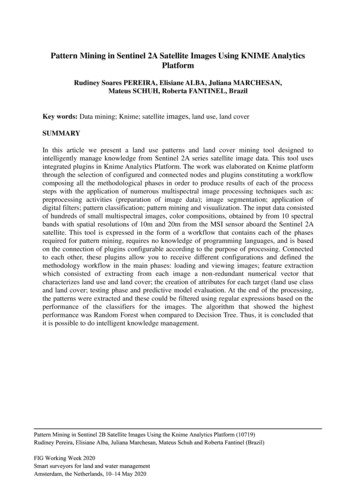
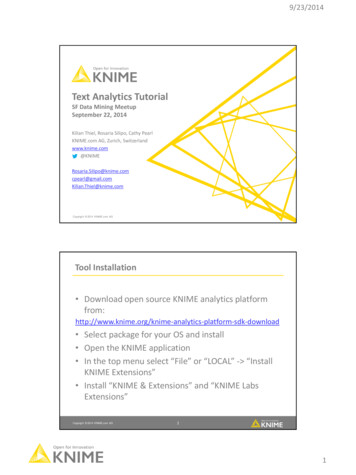
Figure 2: A schematic for the flow of data and models in aKNIME workflow.regression coefficients to computation intensive data modeling operators (clustering, decision trees, neural networks,to name just a few). In addition, most of the modelingnodes allow for an interactive exploration of their resultsthrough accompanying views. In the following we will brieflydescribe the underlying schemata of data, node, workflowmanagement and how the interactive views communicate.3.1Data StructuresAll data flowing between nodes is wrapped within a classcalled DataTable, which holds meta-information concerningthe type of its columns in addition to the actual data. Thedata can be accessed by iterating over instances of DataRow.Each row contains a unique identifier (or primary key) and aspecific number of DataCell objects, which hold the actualdata. The reason to avoid access by Row ID or index isscalability, that is, the desire to be able to process largeamounts of data and therefore not be forced to keep all of therows in memory for fast random access. KNIME employs apowerful caching strategy which moves parts of a data tableto the hard drive if it becomes too large. Figure 3 shows adiagram of the main underlying data structure.3.2NodesNodes in KNIME are the most general processing units andusually resemble one node in the visual workflow representation. The class Node wraps all functionality and makesuse of user defined implementations of a NodeModel, possibly a NodeDialog, and one or more NodeView instances ifappropriate. Neither dialog nor view must be implementedif no user settings or views are needed. This schema followsthe well-known Model-View-Controller design pattern. Inaddition, for the input and output connections, each nodehas a number of Inport and Outport instances, which caneither transport data or models. Figure 4 shows a diagramof this structure.3.3Figure 3: A diagram of the data structure and the mainclasses it relies on.manager is able to determine all nodes required to be executed along the paths leading to the node the user actuallywants to execute.3.4Developing Own NodesKNIME already includes plug-ins to incorporate existing dataanalysis tools. It is usually straightforward to create wrappers for external tools without having to modify these executables themselves. Adding new nodes to KNIME, also fornative new operations, is easy. For this, one needs to extendthree abstract classes: NodeModel: this class is responsible for the main computations. It requires to overwrite three main methods: configure(), execute(), and reset(). The firsttakes the meta information of the input tables andcreates the definition of the output specification. Theexecute function performs the actual creation of theoutput data or models, and reset discards all intermediate results.WorkflowsWorkflows in KNIME are essentially graphs connecting nodes,or more formally, a direct acyclic graph (DAG). The workflow manager allows the insertion of new nodes and additionof directed edges (connections) between two nodes. It alsokeeps track of the status of nodes (configured, executed,.) and returns, on demand, a pool of executable nodes.This way the surrounding framework can freely distributethe workload among a couple of parallel threads or – as partof the KNIME Grid Support and Server (currently under development) – even a distributed cluster of compute servers.Thanks to the underlying graph structure, the workflowSIGKDD ExplorationsFigure 4: A diagram depicting the main classes of a KNIMEnode.Volume 11, Issue 1Page 28
NodeDialog: this class is used to specify the dialogthat enables the user to adjust individual settings thataffect the node’s execution. A standardized set ofDefaultDialogComponent objects allows the node developer to quickly create dialogs when only a few standard settings are needed. NodeView: this class can be extended multiple timesto allow for different views onto the underlying model.Each view is registered with a HiLiteHandler whichsends events when other views have hilited points andallows launching events in case points have been hilitinside this view.In addition to the three model, dialog, and view classes theprogrammer also needs to provide a NodeFactory, whichserves to create new instances of the above classes. Thefactory also provides names and other details such as thenumber of available views or a flag indicating absence orpresence of a dialog.A wizard integrated in the Eclipse-based development environment enables convenient generation of all required classbodies for a new node.3.5Views and Interactive BrushingEach Node can have an arbitrary number of views associated with it. Through receiving events from a so-calledHiLiteHandler (and sending events to it) it is possible tomark selected points in such a view to enable visual brushing. Views can range from simple table views to more complex views on the underlying data (e. g. scatterplots, parallel coordinates) or the generated model (e. g. decision trees,rules).3.6Meta NodesSo-called Meta Nodes wrap a sub workflow into an encapsulating special node. This provides a series of advantagessuch as enabling the user to design much larger, more complex workflows and the encapsulation of specific actions.Whereas previous KNIME versions had only a fixed set ofmeta nodes (1 or 2 data input/output ports), it is now possible to create meta nodes with an arbitrary number andeven type of ports (see section 5.2) by using a simple wizard. These meta nodes can even be nested and copied. Inearlier versions of KNIME also customized meta nodes wereavailable, which allowed for a repeated execution of the enclosed sub workflow, offering the ability to model more complex scenarios such as cross-validation, bagging and boosting, ensemble learning etc. This concept has been replacedby the more powerful loop concept described below (see section 5.1).3.7Distributed ProcessingDue to the modular architecture it is easy to designate specific nodes to be run on separate machines. But to accommodate the increasing availability of multi-core machines, thesupport for shared memory parallelism also becomes increasingly important. KNIME offers a unified framework to parallelize data-parallel operations. Sieb et al. (2007) describedearlier experiments along those lines, which investigated thedistribution of complex tasks such as cross validation on acluster or a GRID.In the near future, high performance usage of KNIME willbe be supported through a KNIME Grid Engine, which al-SIGKDD Explorationslows distribution of nodes, metanodes, but also chunks ofindividual node executions on a grid.4.EXTENSIONSKNIME already offers a large variety of nodes, among themare nodes for various types of data I/O, manipulation, andtransformation, as well as the most commonly used datamining and machine learning algorithms and a number of visualization components. These nodes have been specificallydeveloped for KNIME to enable tight integration with theframework concerning memory policies, progress report andinteractive views. A number of other nodes are wrappers,which integrate functionality from third party libraries. Inparticular, KNIME integrates functionality of several opensource projects that essentially cover all major areas of dataanalysis such as Weka [5] for machine learning and datamining, the R environment [11] for statistical computationsand graphics, and JFreeChart [10] for visualization. Moreapplication specific integrations allow to make use of theChemistry Development Kit (CDK [13]) and add moleculardata types as well as functionality to compute propertiesof molecular structures. In the chemoinformatics domaina number of commercial vendors have also integrated theirtools into KNIME.The R integration in KNIME probably offers the most powerful extension, allowing for the execution of R commandsin a local R installation or on an R server to build models which can be later used by a R Predictor node. The Rview node enables the usage of R views and the R To PMMLnode allows conversion of a given R object into a corresponding PMML object. In effect, through KNIME it is possibleto use essentially all R functionality within an easy to use,intuitive environment for data loading, preprocessing andtransformation (ETL).KNIME 2.0 supports the new Weka version 3.5.6 [5]. Apartfrom the roughly 50 classifiers that were already part ofthe Weka-Integration in version 1.3, meta-classifiers, clusterand association rule algorithms have also been integratedadding up to a total of approximately 100 Weka nodes inKNIME. The new Weka port objects (see Section 5.2) areanother important new feature in KNIME 2.0. They enablea trained classifier or cluster model to be stored along withthe used attributes and the target column. A view on thisport lets the user explore the model or clustering that hasbeen built with the training data. This model can be usedto predict unseen data with the new Weka predictor nodeor to assign new data instances to clusters with the Wekacluster assigner node.The integration of these and other tools not only enrichesthe functionality available in KNIME but has also proven tobe helpful to overcome compatibility limitations when theaim is on using these different libraries in a shared setup.5.NEW FEATURES IN VERSION 2.0Besides a number of new nodes and a lot of work under thehood (see the KNIME website at http://www.knime.org/for more details), we will discuss the following new featuresin more detail: support for loops in the workflow, a newconcept of user-defined port objects in addition to data tables, improved database connectivity by using the new portobjects, and the support of PMML in common data miningalgorithms.Volume 11, Issue 1Page 29
Figure 5: A feature elimination loop inside a meta nodethat iteratively removes one attribute after another, startingwith the worst (i.e. whose removal degrade model quality theleast).5.1 Loop supportThe workflows’ conceptual structure is a directed acyclicgraph, i.e. there are no loops from the output of one nodeto the input of one of its predecessors. Data flows strictlyin one direction. However, there are cases in which the repeated execution of parts of the workflow with changed parameters is desirable. This can range from simple iterationsover several input files, to cross validation where a modelis repeatedly trained and evaluated with different distinctparts of data, to even more complex tasks such as featureelimination. In order to be able to model such scenarios inKNIME, two special node types have been introduced: loopstart- and loop end-nodes. In contrast to normal nodes (inside the loop) they are not reset while the loop executes,each of both nodes has access to its counterpart, and theycan directly exchange information. For example, the loopend node can tell the start node which column it shouldremove at the next iteration or the start node can tell theend node if the current iteration is the last or not. Figure 5shows a feature elimination loop in which the start and endnodes are visually distinguishable from normal nodes. Thefeature elimination model can then be used by the featureelimination filter to remove attributes from the data table.KNIME 2.0 contains several pre-defined loops encapsulatedin meta nodes in addition to the individual loop nodes themselves:– Simple “for” loop, executing a given number of times– Cross validation– Iterative feature elimination– Looping over a list of files– Looping over a list of parameter settingsProgrammers can easily write their own loop nodes by simply implementing an additional interface. Of course, in order to fully make use of the loop-concept it is also necessaryto pass variable information to nodes. This allows for e.g.writing out intermediate results to a series of files with aparametrized file name or running a series of experimentswith different parameter settings. Flow Variables whereadded in KNIME 2.0 to allow for these types of control parameters. The current implementation is still experimentaland will likely be adapted in future versions so we refer tothe online documentation for further details concerning thisconcept.5.2Port objectsIn previous KNIME versions there were two types of ports,data ports and model ports. The latter did not distinguishSIGKDD ExplorationsFigure 6: Workflow with nodes that use the new databaseconnections.between the actual type of models be it a decision tree,a neural net or even color information for data rows usedin views. Therefore it was possible to connect a decisiontree learner with a neural network predictor and an errorwas only reported upon execution of the flow. From theprogrammer’s point of view, in certain cases it was quitecomplicated to translate a model into the used data structure (nested key-value pairs) and back. KNIME 2.0 addsarbitrary port types that can easily be defined by the programmer. This has two main advantages: for the user itis now impossible to connect incompatible ports and theprogrammer is responsible for (de)serializing the transferred“port object” herself. This is usually much easier than usingthe old-style method and requires considerably less memory(and space on disk) for big models because the nested hashmaps are omitted.5.3Improved database supportThe new database ports are a prime example of the newport object implementation, Figure 6 shows a small example. These database ports (dark red squares) pass on a connection that encapsulates the parameters used to establisha database connection via a JDBC-compliant bridge.In the example above, the database nodes work directly inthe database by modifying and wrapping SQL statements.The SQL statement itself is only executed when the data isimported into KNIME with the Database Connection Readernode (transition from database to data port). All othernodes, such as Database Connector, Database Column Filter, Database Row Filter and Database Query node performwell-defined operations on the SQL statement. In this example the database connection settings are adjusted withinthe Connector node and passed to the Database ColumnFilter and the Row Filter node. The filter nodes offer auser-friendly way to filter out columns and rows withoutmodifying any SQL statement by hand. For advanced users,the SQL query node can be used to manually edit the SQLstatement. The outport view for each of those nodes supports a quick look into the database settings, the databasemeta data and – upon user request – the preview of thecurrent data inside the database.5.4PMMLThe Predictive Model Markup Language (PMML [3]) is anopen standard for storing and exchanging predictive modelssuch as cluster models, regression models, trees or supportvector machines in XML format. Ideally, a model trained byKNIME (or any other tool supporting PMML) and stored asPMML can be used in R, SAS Enterprise Miner or, since ver-Volume 11, Issue 1Page 30
sion 2.0, also in KNIME. Almost all basic KNIME nodes thatcreate a model represent it in PMML (if the standard supports it). The corresponding predictor nodes take PMML asinput. For PMML exchange between tools, PMML readerand writer nodes have been added as well. However, oneshould keep in mind that the underlying PMML standardoften offers a number of optional attributes in the model,which are usually only understood by the same applicationthat created the model, meaning that in some cases interoperability is limited. One big drawback is currently thatthe preprocessing is not exported as part of the PMML file,which is a feature that will be addressed in a future versionof KNIME.6. CONCLUSIONSKNIME, the Konstanz Information Miner offers a modularframework, which provides a graphical workbench for visualassembly and interactive execution of data pipelines. It features a powerful and intuitive user interface, enables easyintegration of new modules or nodes, and allows for interactive exploration of analysis results or trained models. Inconjunction with the integration of powerful libraries such asthe Weka machine learning and the R statistics software, itconstitutes a feature rich platform for various data analysistasks.New features in KNIME 2.0, especially support for loops,database connection manipulations and PMML further enhance KNIME’s capabilities to make it a powerful data exploration and analysis environment with a strong integrationbackbone that allows for easy access to a number of otherdata processing and analysis packages.[9] Eclipse Foundation (2008): Eclipse 3.3 Documentation.http://www.eclipse.org.[10] Gilbert, D. (2005): JFreeChart Developer Guide.Object Refinery freechart.[11] R Development Core Team (2007): R: A language andenvironment for statistical computing. R Foundation forStatistical Computing, Vienna, Austria. ISBN 3-90005107-0. http://www.R-project.org.[12] Sieb C., Meinl T., and Berthold, M. R. (2007): Paralleland distributed data pipelining with KNIME. Mediterranean Journal of Computers and Networks, Special Issue on Data Mining Applications on Supercomputing andGrid Environments. vol. 3, no. 2, pp. 43-51.[13] Steinbeck, C., Han, Y. Q., Kuhn, S., Horlacher, O.,Luttmann, E., and Willighagen, E.L. (2005): The Chemistry Development Kit (CDK): An open-source Java library for chemo- and bioinformatics. Journal of Chemical Information and Computer Sciences. vol. 43, pp. 493500.7. REFERENCES[1] Michael R. Berthold, Nicolas Cebron, Fabian Dill,Thomas R. Gabriel, Tobias Kötter, Thorsten Meinl,Peter Ohl, Christoph Sieb, Kilian Thiel, and BerndWiswedel (2007). KNIME: The Konstanz InformationMiner. In Data Analysis, Machine Learning and Applications - Proceedings of the 31st Annual Conference ofthe Gesellschaft für Klassifikation e.V., Studies in Classification, Data Analysis, and Knowledge Organization,pp. 319–326. Springer, Berlin, Germany.[2] BIRT. Business Intelligence and Reporting Tools.http://www.eclipse.org/birt/.[3] Data Mining Group. Predictive Model Markup Language(PMML). http://www.dmg.org/.[4] R Project. The R Project for Statistical Computing.http://www.r-project.org/.[5] Ian H. Witten and Eibe Frank (2005). Data Mining:Practical machine learning tools and techniques. MorganKaufmann, San Francisco, 2nd edition.[6] Inforsense Ltd.: InforSense KDE.http://www.inforsense.com/kde.html.[7] Insightful Corporation: Insightful fault.asp.[8] SciTegic: Pipeline IGKDD ExplorationsVolume 11, Issue 1Page 31
KNIME, the Konstanz Information Miner provides such a pipelining environment. Figure 1 shows a screenshot of the standard KNIME workbench with a small example data analysis work ow. In the center, a ow is reading in data from two sources and processes it in several, parallel anal-ysis ows, consisting of preprocessing, modeling, and visu .