Transcription
Pattern Mining in Sentinel 2A Satellite Images Using KNIME AnalyticsPlatformRudiney Soares PEREIRA, Elisiane ALBA, Juliana MARCHESAN,Mateus SCHUH, Roberta FANTINEL, BrazilKey words: Data mining; Knime; satellite images, land use, land coverSUMMARYIn this article we present a land use patterns and land cover mining tool designed tointelligently manage knowledge from Sentinel 2A series satellite image data. This tool usesintegrated plugins in Knime Analytics Platform. The work was elaborated on Knime platformthrough the selection of configured and connected nodes and plugins constituting a workflowcomposing all the methodological phases in order to produce results of each of the processsteps with the application of numerous multispectral image processing techniques such as:preprocessing activities (preparation of image data); image segmentation; application ofdigital filters; pattern classification; pattern mining and visualization. The input data consistedof hundreds of small multispectral images, color compositions, obtained by from 10 spectralbands with spatial resolutions of 10m and 20m from the MSI sensor aboard the Sentinel 2Asatellite. This tool is expressed in the form of a workflow that contains each of the phasesrequired for pattern mining, requires no knowledge of programming languages, and is basedon the connection of plugins configurable according to the purpose of processing. Connectedto each other, these plugins allow you to receive different configurations and defined themethodology workflow in the main phases: loading and viewing images; feature extractionwhich consisted of extracting from each image a non-redundant numerical vector thatcharacterizes land use and land cover; the creation of attributes for each target (land use classand land cover; testing phase and predictive model evaluation. At the end of the processing,the patterns were extracted and these could be filtered using regular expressions based on theperformance of the classifiers for the images. The algorithm that showed the highestperformance was Random Forest when compared to Decision Tree. Thus, it is concluded thatit is possible to do intelligent knowledge management.Pattern Mining in Sentinel 2B Satellite Images Using the Knime Analytics Platform (10719)Rudiney Pereira, Elisiane Alba, Juliana Marchesan, Mateus Schuh and Roberta Fantinel (Brazil)FIG Working Week 2020Smart surveyors for land and water managementAmsterdam, the Netherlands, 10–14 May 2020
Pattern Mining in Sentinel 2A Satellite Images Using the KNIME AnalyticsPlatformRudiney Soares PEREIRA, Elisiane ALBA, Juliana MARCHESAN,Mateus SCHUH, Roberta FANTINEL, Brazil1. INTRODUCTIONIn a few decades, we have seen a significant increase in data collected by sensor instruments,opening enormous perspectives for treatment and analysis. For example in the context ofclimate change, monitoring of land use and land cover changes, studies of environmentalimpacts and disasters, agricultural activities, among others. Geographic information systems(GIS) are generally used for this. However, time-space data analysis, especially for largeareas, is difficult for users to visually interpret. The number of possible interactions,particularly in data analysis, grows exponentially due to the complexity and size of the datacollected (massive data, heterogeneity, inaccuracy, noise and multi-scalability).In order tocontribute to the landscape studies for example, different software provide methods to analyzethe landscape structure based on satellite images and remote sensing techniques [11]. If westill consider the possibility of working with time series data, we would need a very large setof data. Data mining offers solutions especially when it comes to finding patterns ofphenomena and their evolution. Standard mining in TSSI (Temporal Series Satellite Images)was studied in [1] and [2]. The authors considered the images as a sequence of labeled pixels,and patterns extracted to find frequency of evolution. In [3], the authors developed theresearch considering a set of multispectral images. According to this author [3], a limitation ofthis method is due to not considering independence of the spatial dimension and the sequenceof pixels in the processes. KNIME (Konstanz Information Miner) is a platform that allowsintegration, processing of data arranged in files arranged in the form of tables or images ofdifferent origins and formats, performing exploration, comprehensive and easy-to-useanalysis. KNIME was developed using rigorous software engineering practices and has thedevelopment and support of more than 6,000 professionals worldwide, both in industry andacademia. Because it is a modular data exploration platform that allows the user to create dataflows visually (usually called pipelines), selectively perform some or all of the analysis stepsand then investigate the results through interactive visualizations of data and models [6]. Thepurpose of mining image patterns is to extract valuable knowledge from image data. If weconsider the supervised image classification process, what we want is to assign a label toimages considering their visual content. This entire process is identical to the standard datamining process. We train a classifier from a set of previously classified images. Then, we canapply a new image to the classifier to process the categorization into classes. The peculiarityin this case is that we must extract a vector of numerical resources from the image beforestarting the machine learning of the classifier algorithm in the implementation phase. Thetheme is not new, however, easy access is recent. Two reasons are justified: first, the volumeof images available on the web means that we have skilled statisticians and data scientists. Inthis case, the challenge is increasingly present, it is necessary to extract information fromPattern Mining in Sentinel 2B Satellite Images Using the Knime Analytics Platform (10719)Rudiney Pereira, Elisiane Alba, Juliana Marchesan, Mateus Schuh and Roberta Fantinel (Brazil)FIG Working Week 2020Smart surveyors for land and water managementAmsterdam, the Netherlands, 10–14 May 2020
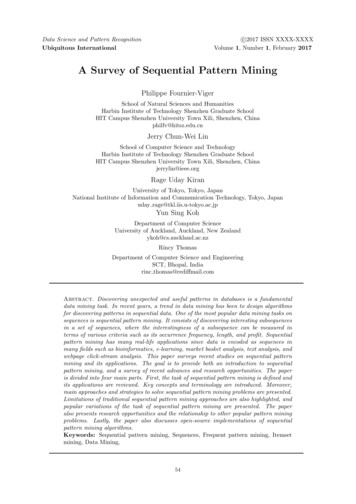
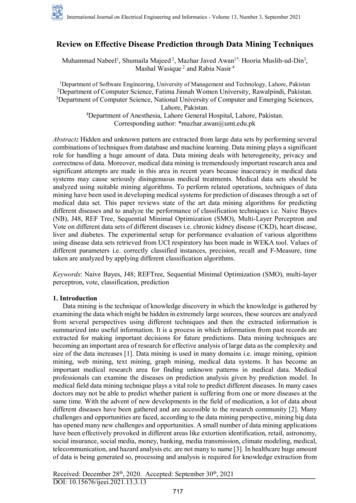
images; the second reason is a variety of tools that are easy to use for data mining. A whileago, we needed a lot of computer programming. Today, there are efficient tools that allowcomplex data analysis without being an image processing expert. These tools include scikitimage, developed for high-level programming languages such as Python. The power of thedata processing, analysis and exploration tools allows to achieve what is essential to extractfrom the data, optimizing the time necessary to explain in detail, the low-level structures ofimages. Although this knowledge becomes important, it is necessary to make parameteradjustments in our analyzes.2. MATERIAL AND METHODS2.1 Images datasetThe data set comprised a total of 1,370 files with 30 files per spectral band, sample fractions,in TIFF file format, with size 10 X 10 pixels of 10 spectral bands of images from the Sentinel2A satellite (Figure 1). These fractions received labels differentiating samples that containedexclusively the forest category (label FN ) and fractions with other category, receiving thelabel NF . All files were arranged in a folder so that they could be processed by the KnimeAnalytics platform with the "Knime Image Processing" module installed.Figure1Figure 1 – Image files, the three first letters specify the class membership2.2 Building the Workflow in KnimePattern Mining in Sentinel 2B Satellite Images Using the Knime Analytics Platform (10719)Rudiney Pereira, Elisiane Alba, Juliana Marchesan, Mateus Schuh and Roberta Fantinel (Brazil)FIG Working Week 2020Smart surveyors for land and water managementAmsterdam, the Netherlands, 10–14 May 2020
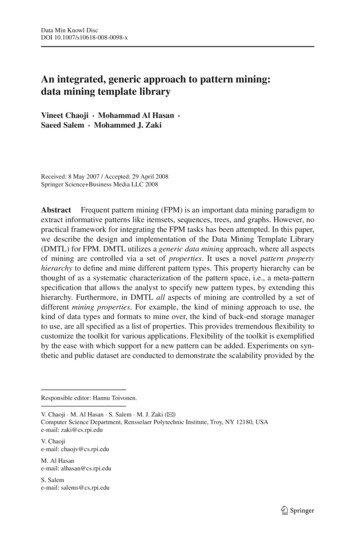
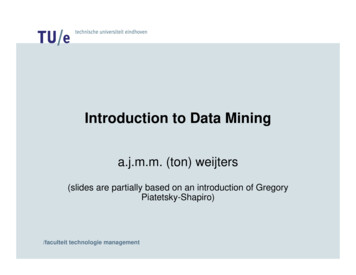
The workflow is elaborated in Knime by placing nodes with their different functions andinterconnected with each other to flow data processing. The construction of the flow consistedof grouping in three main steps to be mentioned: a) preparation of data such as reading,extracting characteristics and filtering data; b) data partitioning, machine learning in thedecision tree and random forest algorithms and classification prediction; and c) performanceanalysis of the classification algorithms. In the Knime workflow editing panel, each of thenodes, interconnected, has at least and in general, two phases necessary to be fulfilled, thefirst deals with the configuration of the node and the second with the actual executionprocessing phase that allows you to advance in the different stages. Figure 2 presents a partialview of the workflow comprising the stages of preparation (reading, character extraction andfiltering) and data partitioning.Figure 2 – Partial view of the workflow (data preparation and partitioning).2.3 Feature extractionThe extraction of characteristics from the images was performed by the node called "ImageFeatures" and consisted of configuring two extraction options. The first option used theparameters of the first order statistic: values of minimum, maximum, average, geometricmean, standard deviation, variance among others and, option two, comprised parametersproposed by Haralick [6] such as: contrast, correlation, variance, entropy among others, andthe diagonal, antidiagonal, horizontal and vertical matrices. Figure 3 presents in table form aPattern Mining in Sentinel 2B Satellite Images Using the Knime Analytics Platform (10719)Rudiney Pereira, Elisiane Alba, Juliana Marchesan, Mateus Schuh and Roberta Fantinel (Brazil)FIG Working Week 2020Smart surveyors for land and water managementAmsterdam, the Netherlands, 10–14 May 2020
partial view of the results of the processing of the extraction of the characteristics of theimages according to the options chosen in the configuration of the "Image Features" node.2.4 Creating the target attribute and learning and evaluating the predictive modelIn the data grid showing the characteristics extracted from the images (Figure 3), the "RowID" column represents the name of the data files. These are the sample images used in theextraction of the characteristics and these are categorized using the first three characters of thename of these files. The nodes of these procedures are called RowID and Cell Splitter ByPosition, respectively. In the procedure of learning and predictive evaluation of the model,unnecessary columns such as ID and Other were removed. The node used for this procedure iscalled Column Filter and precedes the Partitioning node. Figure 4 shows a partial view of theconnections between these nodes.Figure 3–Partialviewoftheextractionofthecharacteristics of the images.Pattern Mining in Sentinel 2B Satellite Images Using the Knime Analytics Platform (10719)Rudiney Pereira, Elisiane Alba, Juliana Marchesan, Mateus Schuh and Roberta Fantinel (Brazil)FIG Working Week 2020Smart surveyors for land and water managementAmsterdam, the Netherlands, 10–14 May 2020
Figure 4 – Partial view of the connections between Column Filter and Partitioning node.The image data set was partitioned into two other sets, training and testing. In this step, thePartitioning node was configured with 70% of training data with stratified sampling. Theadjustment of the model in the algorithm, in the Decision Tree Learner node, followed thedefinition of the Forest Class and the quality of the measurement, used the Gini Index with amean cutoff point. In the Random Forest algorithm, the Random Forest Learner node wasconfigured for the cutoff point using the Information Gain Ratio parameter.3. RESULTS AND DISCUSSIONThe Figure 5 presents a partial view of the connections of the two classification algorithms(Decision Tree and Random Forest) both, connected to the antecedent Partitioning node andin sequence, respectively to the Decision Tree Predictor and Random Forest Predictor nodes.Pattern Mining in Sentinel 2B Satellite Images Using the Knime Analytics Platform (10719)Rudiney Pereira, Elisiane Alba, Juliana Marchesan, Mateus Schuh and Roberta Fantinel (Brazil)FIG Working Week 2020Smart surveyors for land and water managementAmsterdam, the Netherlands, 10–14 May 2020
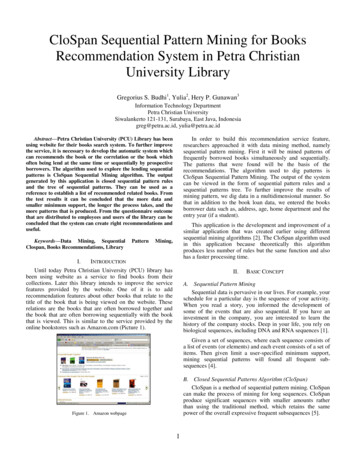
Figure 5 – Partial view of the connections Decision Tree and Random ForestThe workflow area for comprising nodes 34, 36, 12, 41, 37, 44, 13, 42, 38 and 43 makes upthe production area of the final classification results by the Decision Tree and Random Forestalgorithms with the production of performance analysis of these classifiers. In the DecisionTree algorithm, the node produces two information to analyze the classifier's performance, thefirst consists of a graphical information in the form of a tree in which it presents the weightsand percentages of each of the parameters, used in the characterization process of data image.The Figure 6 shows this condition mentioned. The second possible information is representedby Figure 7 which shows the performance values of the classifier such as: samples classifiedcorrectly, classification errors and accuracy. The Decision Tree classification algorithm had anaccuracy of 87.778% accuracy, an error (incorrectly classified samples) of 12.22%, with theCohen's Kappa k 0.756 index, considered satisfactory.Pattern Mining in Sentinel 2B Satellite Images Using the Knime Analytics Platform (10719)Rudiney Pereira, Elisiane Alba, Juliana Marchesan, Mateus Schuh and Roberta Fantinel (Brazil)FIG Working Week 2020Smart surveyors for land and water managementAmsterdam, the Netherlands, 10–14 May 2020
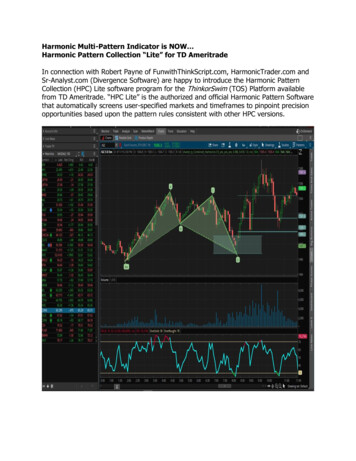
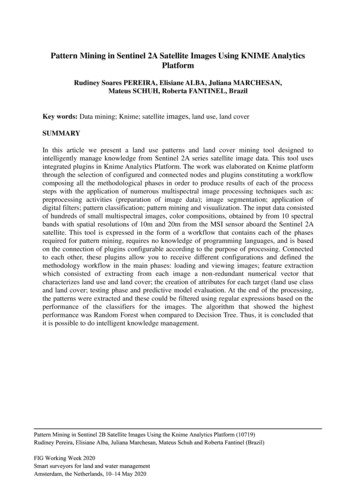
Figure 6 – Partial view of the decision tree produced by the Decision Tree algorithmFigure 7 - Performance of the Decision Tree Predictor algorithm - Confusion matrixThe Random Forest classification algorithm produced the performance results as shown inFigure 8 which shows the performance values of the classifier such as: samples classifiedcorrectly, classification errors and accuracy. The Random Forest classification algorithm hadan accuracy of 93.333% accuracy, an error (incorrectly classified samples) of 6.667%, withthe Cohen's Kappa k 0.867 index, considered satisfactory.Pattern Mining in Sentinel 2B Satellite Images Using the Knime Analytics Platform (10719)Rudiney Pereira, Elisiane Alba, Juliana Marchesan, Mateus Schuh and Roberta Fantinel (Brazil)FIG Working Week 2020Smart surveyors for land and water managementAmsterdam, the Netherlands, 10–14 May 2020
Figure 8 - Performance of the Random Forest - Confusion matrixThe Random Forest algorithm showed the highest accuracy when compared to theperformance of the Decision Tree algorithm. In this study, then, the choice for Random Forestproduced the most precision in the classification process of forest samples. The Figure 9shows the general workflow for conducting the work. It is possible to observe that all theprocesses involved can be simplified using the logic of this solution and the necessaryconfigurations in each of the nodes connected to each other. These nodes composed theworkflow allowing the performance comparison of the two algorithms used Decision TreePredictor and Random Forest. This workflow can be exported in "knwf" format and, later, beused by any user who intends to apply it with other image data.Figure 9 - Overview of Workflow Knime for image classificationPattern Mining in Sentinel 2B Satellite Images Using the Knime Analytics Platform (10719)Rudiney Pereira, Elisiane Alba, Juliana Marchesan, Mateus Schuh and Roberta Fantinel (Brazil)FIG Working Week 2020Smart surveyors for land and water managementAmsterdam, the Netherlands, 10–14 May 2020
4. CONCLUSIONThe Knime Analytics platform appears as a high-performance tool for complex analyzeswithout requiring a single line of code with a programming language, although it is possibleto introduce specialized scripts in the workflow to meet the purpose of the analysis. The flowmodel used allows it to be improved since it is possible to export it, edit it and adapt it to theinterests of each user with this, characterized by its flexibility of use. The analysis of theperformance of the Decision Tree and Random Forest algorithms allowed us to conclude thatit is possible to have images classified with the necessary accuracy. Random Forest was theone that presented the best performance in the classification of images with the target ofinterest Forests. Thus, it is concluded that it is possible to do intelligent knowledgemanagement.Pattern Mining in Sentinel 2B Satellite Images Using the Knime Analytics Platform (10719)Rudiney Pereira, Elisiane Alba, Juliana Marchesan, Mateus Schuh and Roberta Fantinel (Brazil)FIG Working Week 2020Smart surveyors for land and water managementAmsterdam, the Netherlands, 10–14 May 2020
REFERENCES1. Julea N.A. Méger E. Trouvé P. Bolon "On extracting evolutions from satellite image timeseries" IGARSS 2008 pp. 228-231 July 8–11 2008.2. Julea N.A. Méger C. Rigotti E. Trouvé P. Bolon V. Lazarescu "Mining pixel evolutions insatellite image time series for agricultural monitoring" 11th Industrial Conference ICDM 2011pp. 189-203 August 30-September 3 2011.3. E. Christophe J. Inglada "Open source remote sensing: Increasing the usability of cuttingedge algorithms" IEEE Geoscience and Remote Sensing Newsletter vol. 35 no. 5 pp. 9-152009.4. F. Petitjean P. Gançarski F. Masseglia G. Forestier "Analysing Satellite Image Time Seriesby Means of Pattern Mining" in Springer Berlin Heidelberg pp. 45-52 2010.5. Sanhes J. F. Flouvat C. Pasquier N. Selmaoui-Folcher J. Boulicaut "Weighted path as acondensed pattern in a single attributed DAG" in IJCAI 2013 Beijing China pp. 1642-1648August 2013.6. KNIME (Konstanz Information Miner), Available at: http://www.knime.org/, (Accessed 12December 2019).7. Cerf J. L. Besson C. Robardet J.-F. Boulicaut "Data-Peeler: Constraint-Based ClosedPattern Mining in n-ary Relations" SIAM vol. Proc. SIAM pp. 37-48 2008.8. Collin M., F. Flouvat and N. Selmaoui-Folcher, "PaTSI: Pattern Mining of Time Series ofSatellite Images in Knime," 2016 IEEE 16th International Conference on Data MiningWorkshops (ICDMW), Barcelona, 2016, pp. 1292-1295. doi: 10.1109/ICDMW.2016.01879. Berthold M. R., N. Cebron F. Dill T. R. Gabriel T. Kötter T. Meinl P. Ohl C. Sieb K. ThielB. Wiswedel "KNIME: The Konstanz Information Miner" Studies in Classification DataAnalysis and Knowledge Organization (GfKL'07) 2007.10. Selmaoui-Folcher N. F. Flouvat C. Mu J. Sanhes J. Boulicaut "Extraction complèteefficace de chemins pondérés dans un a-dag" in EGC 2015 27–30 Janvier 2015 Luxembourgpp. 179-190 2015.Pattern Mining in Sentinel 2B Satellite Images Using the Knime Analytics Platform (10719)Rudiney Pereira, Elisiane Alba, Juliana Marchesan, Mateus Schuh and Roberta Fantinel (Brazil)FIG Working Week 2020Smart surveyors for land and water managementAmsterdam, the Netherlands, 10–14 May 2020
11. Zaragozí, B.; Belda, A.; Linares, J.; Martínez-Pérez, J.E.; Navarro, J.T.; Esparza, J. 2012.A free and open source programming library for landscape metrics calculations.Environmental Modelling & Software. v. 31, p. 131 – 141.CONTACTSDr. Pereira, RudineyFederal University of Santa Maria, BrazilProfessorAv. Roraima, 1000 Campus Universitário, UFSM-CCRSanta Maria97105-900Rio Grande do Sul StateBrazilTel. 55 55 3220-9468Fax 55 55 3220-8261Email rudiney.s.pereira@ufsm.brWeb site: http://www.ufsm.br/labserePattern Mining in Sentinel 2B Satellite Images Using the Knime Analytics Platform (10719)Rudiney Pereira, Elisiane Alba, Juliana Marchesan, Mateus Schuh and Roberta Fantinel (Brazil)FIG Working Week 2020Smart surveyors for land and water managementAmsterdam, the Netherlands, 10–14 May 2020
KNIME (Konstanz Information Miner) is a platform that allows integration, processing of data arranged in files arranged in the form of tables or images of different origins and formats, performing exploration, comprehensive and easy-to-use analysis. KNIME was developed using rigorous software engineering practices and has the