Transcription
Energy Efficiency Improvementand Cost Saving Opportunitiesfor Petroleum RefineriesAn ENERGY STAR Guidefor Energy and Plant ManagersFebruary 2015ENERGY STAR is a U.S. Environmental Protection Agency Programhelping organizations and individuals fight climate change throughsuperior energy efficiency. Learn more at energystar.gov/industry.Document Number 430-R-15-002
Energy Efficiency Improvement andCost Saving Opportunities forPetroleum RefineriesAn ENERGY STAR Guide for Energy and Plant ManagersErnst Worrell, Utrecht UniversityMariëlle Corsten, Utrecht UniversityChristina Galitsky, Lawrence Berkeley National LaboratoryFebruary 2015DisclaimerThis document was prepared as an account of work sponsored by the United States Government.While this document is believed to contain correct information, neither the United StatesGovernment nor any agency thereof, nor any of their employees, makes any warranty, express orimplied, or assumes any legal responsibility for the accuracy, completeness, or usefulness of anyinformation, apparatus, product, or process disclosed, or represents that its use would not infringeprivately owned rights. Reference herein to any specific commercial product, process, or service byits trade name, trademark, manufacturer, or otherwise, does not necessarily constitute or imply itsendorsement, recommendation, or favoring by the United States Government or any agencythereof. The views and opinions of authors expressed herein do not necessarily state or reflectthose of the United States Government or any agency thereof.AcknowledgmentThis report was funded by the U.S. Environmental Protection Agency’s Climate ProtectionPartnerships Division as part of ENERGY STAR. ENERGY STAR is a government-backed programthat helps businesses protect the environment through superior energy efficiency.ii
ABSTRACTThe petroleum refining industry in the United States is the largest in the world, providing inputs tovirtually all economic sectors, including the transportation sector and the chemical industry. Theindustry operates 144 domestic refineries (as of January 2012), employing over 63,000employees. The refining industry produces a mix of products with a total value exceeding 555billion. Although refineries typically spend 50% of cash operating costs (i.e., excluding capitalcosts and depreciation) on energy, recent developments in natural gas prices have reduced thisto approximately 30%. Even with these savings, energy remains a major cost factor and animportant opportunity for cost reduction. Energy use is also a major source of emissions in therefinery industry, making energy efficiency improvement an attractive opportunity to reduceemissions and operating costs.Voluntary government programs aim to assist industry to improve competitiveness throughincreased energy efficiency and reduced environmental impact. ENERGY STAR , a voluntaryprogram managed by the U.S. Environmental Protection Agency, stresses the need for strongand strategic corporate energy management programs. ENERGY STAR provides energymanagement tools and strategies for successful corporate energy management programs. ThisGuide describes research conducted to support ENERGY STAR and its work with the petroleumrefining industry.This Guide introduces energy efficiency opportunities available for petroleum refineries, beginningwith descriptions of the trends, structure and production of the refining industry and the energyused in the refining and conversion processes. Specific energy savings for the energy efficiencymeasure are provided, based on case studies of plants and references to technical literature. Ifavailable, typical payback periods are also listed. The Guide draws upon the experiences withenergy efficiency measures of petroleum refineries worldwide. The findings suggest that, givenavailable resources and technology, there are opportunities to reduce energy consumption costeffectively in the petroleum refining industry while maintaining the quality of the productsmanufactured. Further research on the economics of the measures, as well as the applicability ofthese measures to individual refineries, is needed to assess the feasibility of implementation ofselected technologies at individual plants.iii
Table of Contents1. Introduction .12. The U.S. Petroleum Refining Industry .33. Process Description.104. Energy Consumption .205. Energy Efficiency Opportunities.286. Energy Management and Control .316.1 Energy Management Systems (EMS) and Programs . 316.2 Energy Teams. 336.3 Energy Monitoring and Control Systems . 347. Energy Recovery.387.1 Flare Gas Recovery . 387.2 Power recovery . 398. Steam Generation and Distribution.418.1 Boilers . 428.2 Steam Distribution System Energy Efficiency Measures . 479. Heat Exchangers and Process Integration.519.1 Heat transfer - Fouling . 519.2 Process integration. 5210. Process Heaters.5710.1 Maintenance. 5710.2 Air preheating. 5810.3 New burners. 5811. Distillation.6012. Hydrogen Management and Recovery .6312.1 Hydrogen integration . 6312.2 Hydrogen recovery . 6312.3 Hydrogen production . 6513. Motor Systems .6614. Pump Systems .7115. Compressors and Compressed Air.79iv
16. Fan systems .8617. Lighting.8918. Power Generation.9218.1 Combined heat and power generation (CHP) . 9218.2 Gas expansion turbines. 9418.3 Steam expansion turbines . 9518.4 Turbine pre-coupling . 9518.5 Gasification . 9719. Other Opportunities .9919.1 Process changes and design . 9919.2 Alternative production flows. 10019.3 Other opportunities . 10019.4 Innovative technologies . 10120. Additional GHG Abatement Opportunities .10421. Water management .10622. Summary and Conclusions.108Acknowledgements . 11623. References .117Appendix A: Active refineries in the U.S. as of January 2012 .134Appendix B: Basic Energy Efficiency Actions for Plant Personnel .140Appendix C: Energy Management System Assessment for Best Practices in Energy Efficiency 141Appendix D: Guidelines for Energy Management Assessment Matrix .143Appendix E: Teaming Up to Save Energy Checklist .147Appendix F: Support Programs for Industrial Energy Efficiency Improvement .149v
1. IntroductionAs U.S. manufacturers face an increasingly competitive global business environment, they seekout opportunities to reduce production costs without negatively affecting product yield or quality.Uncertain energy prices in today’s marketplace negatively affect predictable earnings, which areof particular concern to publicly traded companies in the petroleum industry. The substantialdecline in natural gas prices over the past year has provided a competitive advantage to bothU.S. public and private industry. Successful, cost-effective investment into energy efficiencytechnologies and practices meets the challenge of maintaining a high quality product output whilereducing production costs and mitigating the risk posed by volatile energy prices. Theseinvestments also frequently yield broader additional benefits, such as increasing the overallproductivity of the company.Energy use also constitutes a major source of emissions in the refinery industry, making energyefficiency improvement an attractive opportunity to reduce both emissions and operating costs.End-of-pipe solutions can be expensive and inefficient, while investing in energy efficiency as partof a comprehensive environmental strategy can provide an inexpensive opportunity to reducecriteria and other pollutant emissions. Such investments can also prove an efficient and effectivestrategy to work towards the “triple bottom line” that focuses on the social, economic, andenvironmental aspects of a business.1 In short, energy efficiency investment is sound businessstrategy in today's manufacturing environment.Voluntary government programs aim to assist industry and improve competitiveness throughincreased energy efficiency and reduced environmental impact. ENERGY STAR , a voluntaryprogram managed by the U.S. Environmental Protection Agency (EPA), highlights the importanceof strong and strategic corporate energy management programs. ENERGY STAR providesenergy management tools and strategies for successful corporate energy management programs.This Guide supports ENERGY STAR and its work with the petroleum refining industry bydescribing research on potential energy efficiency opportunities for refineries. ENERGY STAR canbe contacted through www.energystar.gov for additional energy management tools that facilitatestrong energy management practices in U.S. industry.The United States has the largest petroleum refining capacity in the world, providing inputs tovirtually all economic sectors, including the transportation sector and the chemical industry. Theindustry operates 144 domestic refineries (as of January 2012), employing over 63,000employees, and producing a mix of products with a total value exceeding 555 billion (based onthe 2010 Annual Survey of Manufacturers). Although refineries typically spend 50% of cashoperating costs (i.e., excluding capital costs and depreciation) on energy, recent developments inThe concept of the “triple bottom line” was introduced by the World Business Council on SustainableDevelopment (WBCSD). The three aspects of the “triple bottom line” are interconnected as society dependson the economy and the economy depends on the global ecosystem, whose health represents the ultimatebottom line.11
natural gas prices have reduced these expenditures by approximately 20%. Even with thissubstantial reduction, energy remains a major cost factor and an important opportunity for costreduction for industry.This Guide first describes the trends, structure and production of the petroleum refining industry inthe United States. It then describes the main production processes. Next, it summarizes energyuse in refineries, along with the main end uses of energy. Finally, it discusses energy efficiencyopportunities for U.S. refineries, additional GHG abatement technologies, and opportunities forwater management. The Guide focuses on measures and technologies that have beensuccessfully demonstrated within individual plants in the United States or abroad. Due to thecomplexity of the petroleum refining industry, this Guide cannot cover all possible energyefficiency opportunities for refineries. While this Guide primarily focuses on practices that are bothproven and currently commercially available, Section 19.4 briefly discusses a selection of newand innovative technologies that are currently in development.This Guide aims to serve as a guide for energy managers and decision-makers, helping themdevelop efficient and effective corporate and plant energy management programs by providinginformation on new or improved energy-efficient technologies.2
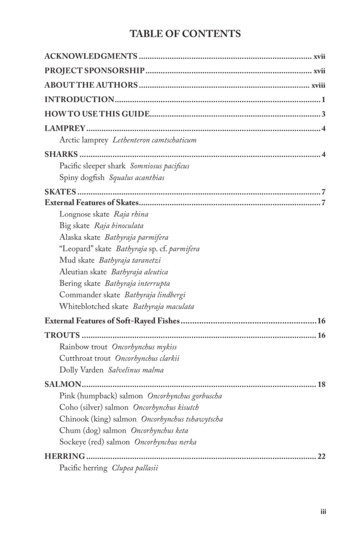
2. The U.S. Petroleum Refining IndustryThe United States has the world’s largest refining capacity, processing just less than a quarter ofall crude oil in the world. Although the major products of the petroleum refining sector aretransportation fuels, its products are also used in other energy applications, and as feedstock forchemical industries.2018CapacityActual Input16Capacity/Input igure 1. Capacity and actual crude intake of the U.S. petroleum refining industry between 1950 and 2012,expressed in million barrels/day of crude oil intake. Source: Energy Information Administration.The U.S. petroleum refining industry has grown over the past 60 years by about 2%/year, onaverage. Although refining capacity grew rapidly until the second oil price shock, productionbegan to level off in the mid to late 1970s. This industry underwent a period of substantialreorganization, and did not resume growth until after the mid-1980s. From 1985 to 2001, theindustry grew at a somewhat slower rate of 1.4%/year, with refinery input stabilizing after 2001.Despite this stabilization, refinery capacity again continued to grow, reaching its highest level innearly three decades by 2011 before dropping in 2012. Figure 1 shows the developments ininstalled capacity (expressed as crude intake capacity) and actual crude intake in the U.S. refiningindustry since 1950.3
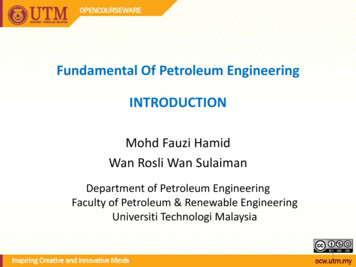
Figure 1 shows that capacity utilization has been relatively stable, with the exception of the periodbetween the two oil price shocks and the period after 2007. Following the first oil price shock,federal legislation favoring domestic production and refining subsidized the construction andoperation of many small refineries (U.S. DOE-OIT, 1998b). This led to a reduced capacityutilization. After 2007, the U.S. recession caused lower petroleum demand, pushing downdomestic refining operations to 83 percent of capacity by 2009. Although the capacity utilizationrate increased to approximately 86 percent in 2011, it remains well below the levels seen from1993 through 2005.350300Number of 120Figure 2. Number of operating refineries in the United States. Source: Energy InformationAdministration.Figure 2 depicts the number of operating refineries in the United States since 1950. It clearlydemonstrates the increasing number of refineries after the first oil price shocks in the 1970s.Small refineries only distill products, and are most often inefficient and less flexible operations,producing only a small number of products. Increasing demand for lighter refinery products andchanges in federal energy policy have led to a reduction in the number of refineries, whileincreasing capacity utilization (see Figure 1).These market dynamics will lead to the further concentration of the refinery industry into highcapacity plants operating at higher efficiencies. The number of operating refineries has declined4
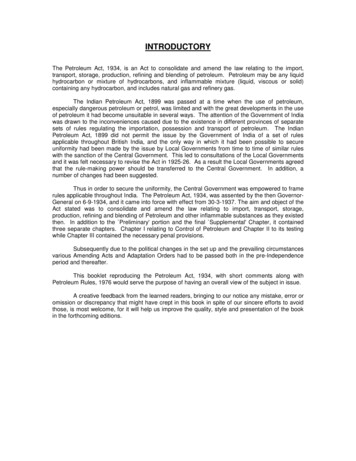
from 205 in 1990 to 144 in 2012, but has been stable over the past decade. Current capacitygrowth primarily results from the expansion of available refinery capacity (i.e., capacity creep).The need to produce cleaner burning fuels to meet environmental regulations (e.g., reduction ofsulfur and benzene content) will increase the need to install new equipment. These environmentalregulations have contributed to the shutdown of new refinery construction over the past decades(U.S. DOE-OIT, 2007). Appendix A provides a list of operating refineries in the United States as ofJanuary 2012.Petroleum refineries are located in 31 states, though the industry is heavily concentrated in a fewstates due to historic resource distribution and easy access to imported supplies (i.e., close toharbors). Hence, the largest number of refineries can be found on the Gulf coast, followed byCalifornia, Illinois, Washington, and New Jersey. Some of the lowest producing states have onlyvery small refineries administered by independent operators. These refineries produce a verylimited mix of products, and are ultimately not expected to be able to compete in the developingoil market. Figure 3 depicts 2012 refining capacity by state, expressed as share of total capacitycrude intake.30%Total capacity: 17.3 million barrels per calendar day25%Share capacity (%)20%15%10%5%WyomingWisconsinWashingtonWest North DakotaNew JerseyNew ure 3. Refining capacity by state as share of total U.S. refining capacity in 2012. Capacity is expressedas capacity for crude intake. Source: Energy Information Administration.5
There are 67 companies in the United States currently operating refineries. Although there are arelatively large number of independent companies in the U.S. refining industry, the majority of therefining capacity is operated by a small number of multi-national or national oil processingcompanies. The largest companies (as of January 2013) are: Valero (11% of crude capacity),ExxonMobil (11%), Phillips 66 (9%), BP (8%), Marathon (7%), Motiva (6%), and Chevron (6%),which combined represent 48% of domestic crude distillation (CDU) capacity. Each of thesecompanies operates a number of refineries in different states. Figure 4 depicts companiesoperating over 0.5% of total domestic CDU capacity.Small refineries frequently use high cost feedstock and produce a relatively simple product mix,which may result in lower profitability when compared with larger refineries. As a result, smallcompanies’ share of total industry economic value is lower than their share of total industryproduction capacity.12%Includes companies operating over 0.5% of CDU capacity (2012),representing a combined 93% of total U.S. capacity.A total of 67 companies operated refineries in the U.S. in 2012.Share CDU capacity (%)10%8%6%4%2%Suncor Energy Inc.Pasadena Refining Systems Inc.Navajo Refining Co. LLCNustar Asphalt Refining LLCCoffeyville Resources RFG & MKTG LLCBP-Husky Refining LLCCalumet Lubricants Co LPLima Refining CompanyAlon Israel Oil Company LTDToledo Refining Co LLCWestern Refining Southwest Inc.PDV Midwest Refining LLCPaulsboro Refining Co. LLCHolly Refining & Marketing Co.Frontier Refining Inc.Delaware City Refining Co. LLCChalmette Refining LLCHouston Refining LPTotal Petrochemicals Inc.Sunoco Inc.Deer Park Refining Ltd PartnershipShell Oil Products USWRB Refining LLCPremcor Refining Group Inc.Tesoro Corp.Citgo Petroleum Corp.Motiva Enterprises LLCFlint Hills Resources LPChevron U.S.A. Inc.BPMarathon Petroleum Co. LLCValeroExxonMobilConocoPhillips0%Figure 4. Refining capacity (expressed as percentage of total CDU capacity) for companies operating over0.5% of total CDU capacity in 2012. The depicted companies operate 93% of total national capacity.Companies operating 0.5% or less of total CDU capacity are not depicted. Refineries may changeownership and increase capacity. Current capacity distribution may be different. Source: EnergyInformation Administration.6
The further concentration of refineries in the United States has contributed to a reduction inoperating costs, but has also impacted refining margins (Killen et al., 2001). The western UnitedStates market is largely isolated from the other primary oil markets in the United States. Althoughoverall market dynamics in the United States and the western United States markets follow thesame path, this isolation results in higher operating margins from western refineries. A secondeffect of this isolation is that refineries have little access to alternative markets when demand inthis region declines.U.S. refineries process different kinds of crude oil types from different sources. Over the pastdecade, there has been a trend towards more heavy crudes and higher sulfur content, althoughnewly produced crudes may in fact be lighter. These effects vary for the different regions in theUnited States.8000Other7000Still GasResidual Fuel OilCoke6000GasolineProduction (Million bbl/year)LPGJet Fuel5000Distillate Fuel 0Figure 5. Petroleum refining production, by major product categories in the United States, 1950 – 2010.Source: Energy Information Administration.Figure 5 depicts the past trend in production since 1950 by product category. This figure showsan increase in the production and relative share of lighter products, such as gasoline, while theshare of heavier fuels like residual fuel oil declined over the past several decades. Figure 5 doesnot show the changing quality demands of the product categories. Started in California, increasedair quality demands and emission standards in many parts of the United States resulted in an7
increased demand for low-sulfur automotive fuels (i.e., gasoline, diesel). Over the past decade,this rising demand has resulted in an increase of hydrotreating capacity of over 40%. Smallrefineries will most likely not be able to invest in this type of expansion and will lose further marketshare. With limited markets for the hydroskimming refineries, a further concentration of refinerieswill likely occur over the coming years. Expansion of existing refineries will provide the increaseddemand, as new greenfield refinery construction is not anticipated within the United States overthe next few years.The continued trend towards low-sulfur fuels and changes in the product mix of refineries willaffect technology choice and needs. For example, current desulfurization and conversiontechnologies use relatively large quantities of hydrogen. Demand for hydrogen is expected to risein order to keep pace with ultra-low sulfur fuel demand. Hydrogen is an energy-intensive product,and increased hydrogen consumption will correspondingly increase energy use and operatingcosts, unless more efficient hydrogen production and recovery technologies are developed andapplied. New desulfurization technologies that are being developed and demonstrated and mayhelp to reduce the need for hydrogen include oxidative, biocatalytic, adsorption, and membranetechnologies.At the same time, the dynamic development of the petroleum industry faces new economic andenvironmental challenges. Increasing and more volatile energy prices will affect the bottom line ofrefineries while commodity markets, like those of most oil products, show continuously fallingmargins. Both factors may negatively affect the profitability of petroleum refining. Furthermore,increased needs to reduce air pollutant emissions from refinery operations, the blending ofbiofuels, other energy related issues (e.g., regulatory changes of power supply), as well asincreased safety demands are challenges faced by refineries and will drive technology choice andinvestments in future process technologies. Climate change and developments in automotivetechnology are similarly poised to affect the future structure of refineries. Reduced profitabilityresulting from a combination of these factors is expected to continue, profoundly impactingindustry decisions regarding technology. Table 1 summarizes the primary challenges facing thepetroleum refining industry.8
Table 1. Key drivers and challenges for the petroleum refining industry. The order in the table does notreflect an order of priorities.ChallengeKey IssuesSafetySafety incidents, refineries now mainly located in urbanized areasReliabilityCapacity utilization, profitability, and energy efficiencyEnvironmentEmissions of criteria air pollutants (NOx, VOC) and greenhousegasesProfitabilityCommodity market, further concentration of the industryFuel QualitySulfur, MTBE-replacementFeedstockIncreasing demand for lighter products from decreasing qualitycrudeEnergyCosts of power9
3. Process DescriptionA modern refinery is a highly complex and integrated system separating and transforming crudeoil into a wide variety of products, including transportation fuels, residual fuel oils, lubricants, andmany other products. The simplest refinery type is a facility in which the crude oil is separated intolighter and heavier fractions through the process of distillation. In the United States, almost 30%of the refinery facilities are small operations producing fewer than 50,000 barrels/day (EIA, 2012),comprising approximately 4% of the total industry output. The existence of small, relativelyinefficient refineries is due in part to legislation subsidizing smaller operations, enacted during theaftermath of the first oil price shock. These small operations typically consist only of distillationcapacity (i.e., no reforming or converting capacities) and produce a limited number of products.Modern refineries have developed much more complex and integrated systems in whichhydrocarbon compounds are not only distilled, but are also converted and blended into a widerarray of products. The overall structure of the refinery industry has changed in recent years due toa growing demand for lighter products. This has led to an increase in complex refineries withgreater conversion capacities. Increased conversion will lead to a corresponding rise in thespecific energy consumption, while producing a more valuable array of products. These trendsare expected to persist in coming years as demand for heating (fuel) oil decreases.All refineries must distill crude oil before conversion occurs. The two most important distillationprocesses are crude or atmospheric distillation and vacuum distillation. Different conversiontechnologies are available to take advantage of thermal or catalytic processes, such as using acatalytic reformer where the heavy naphtha produced in the crude distillation unit is converted togasoline, or a fluid catalytic cracker which converts the distillate of vacuum distillation units.Newer processes, such as hydrocrackers, are used to produce light products from the heavybottom products. Finally, all outputs may be treated to upgrade the product quality (e.g., sulfurremoval using a hydrotreater). Side processes that are used to condition inputs and/or producehydrogen or by-products include crude conditioning (e.g., desalting), hydrogen production, powerand steam production, and asphalt production. Lubricants and other specialized products may beproduced at select locations.The principal energy consuming proc
used in the refining and conversion processes. Specific energy savings for the energy efficiency measure are provided, based on case studies of plants and references to technical literature. If available, typical payback periods are also listed. The Guide draws upon the experiences with energy efficiency measures of petroleum refineries worldwide.