Transcription
Interdecadal Modulationof ENSO TeleconnectionsAlexander Gershunov and Tim P. BarnettClimate Research Division, Scripps Institution of Oceanography,University of California, San Diego, La Jolla, CaliforniaABSTRACTSeasonal climate anomalies over North America exhibit rather large variability between years characterized by thesame ENSO phase. This lack of consistency reduces potential statistically based ENSO-related climate predictability.The authors show that the North Pacific oscillation (NPO) exerts a modulating effect on ENSO teleconnections. Sealevel pressure (SLP) data over the North Pacific, North America, and the North Atlantic and daily rainfall records in thecontiguous United States are used to demonstrate that typical ENSO signals tend to be stronger and more stable duringpreferred phases of the NPO. Typical El Niño patterns (e.g., low pressure over the northeastern Pacific, dry northwest,and wet southwest, etc.) are strong and consistent only during the high phase of the NPO, which is associated with ananomalously cold northwestern Pacific. The generally reversed SLP and precipitation patterns during La Niña wintersare consistent only during the low NPO phase. Climatic anomalies tend to be weak and spatially incoherent during lowNPO–El Niño and high NPO–La Niña winters. These results suggest that confidence in ENSO-based long-range climate forecasts for North America should reflect interdecadal climatic anomalies in the North Pacific.1. IntroductionThe existence of quasi-decadal variability in thePacific sector climate (e.g., Latif and Barnett 1994,1996; Mantua et al. 1997; Minobe 1997) has important implications for long-range climate prediction inNorth America. The spatial manifestations in climatevariables around the North Pacific sector associatedwith the North Pacific oscillation (NPO) are qualitatively similar to those of ENSO. Characterizing thehigh NPO phase are the anomalously deep Aleutianlow, cold western and central North Pacific, and warmeastern Pacific coastal waters, as well as anomalouswarming in the central and eastern tropical Pacific.Reversed climatic conditions characterize the lowNPO phase. The response of the Pacific sector climateCorresponding author address: Alexander Gershunov, ClimateResearch Division, Scripps Institution of Oceanography, University of California, San Diego, 9500 Gilman Drive, La Jolla, CA92093-0224.E-mail: sasha@ucsd.eduIn final form 7 August 1998. 1998 American Meteorological SocietyBulletin of the American Meteorological Societyto ENSO is qualitatively similar but relatively stronger in the Tropics and weaker in the midlatitudes(Mantua et al. 1997; Zhang et al. 1997). This similarityof climatic responses to ENSO and NPO suggests thatthe more slowly evolving NPO can modulate ENSOrelated climate predictability over North America, especially in the west. The expected form of this modulationis a stronger climate response to El Niño (La Niña) during those epochs marked by a high (low) phase of theNPO. We hypothesize that this would correspond to asynergetic (constructive) match of NPO and ENSOphases (warm ENSO–high NPO or cold ENSO–lowNPO), while the opposite (destructive) match wouldtend to weaken the effects of either mode’s influenceon the North American climate. The purpose of thispaper is to show that this is indeed the case.ENSO signals in the North American climatehave been documented by many researchers (e.g.,Ropelewski and Halpert 1986, 1996; Kiladis and Diaz1989; Gershunov and Barnett 1998). The large inter–El Niño or inter–La Niña variability characteristic ofthese seasonal anomalies has also attracted attention(Kumar and Hoerling 1997; Livezey et al. 1997;Gershunov 1998). This type of interevent variability2715
necessarily undermines ENSO-related long-range climate predictability, statistically based predictions being especially vulnerable. Some of this variability maybe due to details of the forcing such as timing, magnitude, and spatial characteristics of the tropical Pacific SST anomaly. Some may be due to the inherentand unpredictable internal atmospheric variability(e.g., Lau 1997). A portion of this variability may bedue to the modulating influence of non-ENSO interannual and longer-period coherent climatic modes(e.g., Mann and Park 1996). Observational evidencesuggests a strong influence of the NPO on NorthAmerican circulation, precipitation, and temperature(Latif and Barnett 1994, 1996; Mantua et al. 1997).For example, over western North America, the northwest tends to be dry and the southwest tends to be wetduring the high phase of the NPO with a reversed pattern occurring during the low phase. The spatial similarity of NPO-related anomalies to those forced byENSO suggests that the NPO may modulate ENSOsignal stability as well as magnitude. This possibilityis also addressed by our analysis.It is important to understand that the focus of thispaper is the effect of ENSO–NPO interference onNorth American climate, not the effect of ENSO andNPO on each other. To be sure, ENSO and NPO appear to be related. Mantua et al. (1997) estimate correlation coefficients between unfiltered indices ofENSO and NPO to have magnitudes between about 0.3and 0.4. There is a profusion of theories on possiblephysical linkages between the tropical and North Pacific(e.g., Enfield and Allen 1980; Gu and Philander 1997;Lysne et al. 1997; Pierce et al. 1998, manuscript submitted to J. Climate). These theories do not agree onthe direction of causality, they do not agree on whetherthe primary connection is oceanic or atmospheric, andthey certainly do not agree on the physics involved.This paper, however, does not take part in the debate on ENSO–NPO physics. In fact, results and conclusions presented below hold regardless of thephysical mechanisms, or even direction of causalityor lack thereof, involved in the ENSO–NPO association. The ENSO and NPO indices used here areindependent of each other, chosen to maximize predictability of each one separately from the other. Thethrust of this paper is toward the practical goal of longrange climate prediction based on well-establishedknowledge of the climate system. The term “modulation” as used in the title refers to the influence of longlived North Pacific anomalies on the strength andstability of North American ENSO-related climate sig2716nals. It does not imply a causal relationship betweenENSO and NPO.In what follows, after a brief description of the dataand general analytic approach in section 2, we describethe NPO modulation of ENSO-related North American climate anomalies. Low-level atmospheric circulation represented by the sea level pressure (SLP) fieldover the North Pacific, North America, and the NorthAtlantic is considered in section 3. The precipitationfield over the contiguous United States as representedby the frequency of heavy daily precipitation (HPF)is considered in section 4. NPO modulation of ENSOsignal magnitude and stability is considered for bothSLP and HPF. Results are summarized and discussedin section 5.2. Data and methodsInterdecadal NPO-related regime shifts have beenconfirmed by independent analyses to have occurred in1925, 1947, and 1977 in various SST, SLP, and proxyindices from around the North Pacific (e.g., Mantuaet al. 1997; Minobe 1997). This separates our periodof record (1933–93) into three epochs: 1933–46 and1977–93, marked by the high phase of the NPO, and1947–76, marked by the low phase. Parenthetically,Mantua et al. (1997) use the name, PDO (PacificDecadal Oscillation) for the same phenomenon we callNPO. Although consideration of interannual NPOshifts would slightly strengthen the results presentedbelow, interannual variations in the NPO are ignoredhere because they are unpredictable at present. Theinterdecadal NPO component, however, even if currently unpredictable with dynamical methods, tendsto be persistent.ENSO extreme winters are defined to occur whenDecember, January, and February (DJF) NIÑO 3.4(5 N–5 S, 120 –170 W) detrended SST is more than0.8 standard deviations (0.8σ 0.6 C) away from thelong-term mean. While high enough to exclude questionable events, this threshold provides an adequatenumber of ENSO cases when subcomposited by NPOphase (see Table 1). Detrended DJF NIÑO 3.4 SST waschosen as the ENSO index for two reasons: 1) NIÑO3.4 SST anomalies are well known to exert a stronginfluence on extratropical circulation during borealwinter (Graham and Barnett 1995), and 2) interannualNIÑO 3.4 SST anomalies are most skillfully predictedby hybrid coupled models for DJF (Barnett et al.1993). Besides being more amenable to skillful preVol. 79, No. 12, December 1998
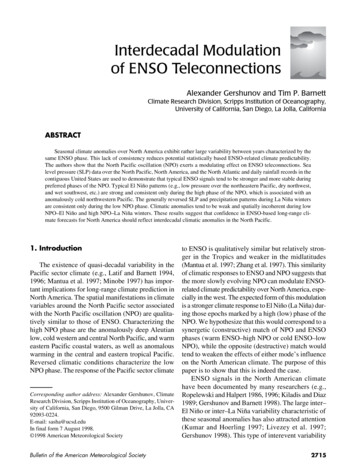
TABLE 1. Classification of winters based on phases of ENSO and NPO.High NPOLow NPOEl Niño1940, 1941, 1942, 1980, 1983, 1987, 1988, 19921954, 1958, 1964, 1966, 1969, 1970, 1973La Niña1934, 1943, 1984, 1985, 19891950, 1951, 1956, 1971, 1972, 1974, 1976diction, detrended NIÑO 3.4 SST anomalies are independent of epochal NPO shifts considered here.SLP records for the Northern Hemisphere wereobtained from the National Center for AtmosphericResearch (dataset ds010.1). (Information on this dataset is available online at ) Because the North AmericanENSO signal is more stationary from month to monthduring January, February, and March (JFM) than during DJF, monthly JFM anomalies were averaged torepresent the winter seasons’ SLP anomaly. The spatial domain used in our SLP analysis extends from 20 to 70 N over the Western Hemisphere.Precipitation data were obtained from the NationalClimatic Data Center. Daily precipitation records at168 stations in the contiguous United States were selected for long and reasonably continuous records.Station locations are denoted by dots in Fig. 1. Sixtyone winters (JFM 1933–93) of data are available forthese locations. Heavy rainfall events are defined foreach location as those days with rainfall totaling abovethe 75th percentile of the 61-winter rainy day climatology at that station. For every winter, HPF is recorded. These heavy rainfall events make up most ofthe seasonal total rainfall and, not surprisingly, resultsobtained with HPF are similar to those obtained withtotal seasonal precipitation. We chose HPF to represent the precipitation field because while HPF isclosely related to total seasonal rainfall amount, it carries special societal importance because of its directrelation to flood risk. HPF is also a good candidate forstatistical prediction because, at least in the westernUnited States, sensitivity of daily precipitation frequency to ENSO tends to increase for more extremeprecipitation events (e.g., Cayan et al. 1998, manuscript submitted to J. Climate). Moreover, HPF is expected to be less sensitive to rain gauge biases than istotal seasonal precipitation amount.Of the 61 winters used in this study, 27 ENSO active winters are composited according to ENSO andNPO phase combination (see Table 1).Bulletin of the American Meteorological SocietyThe general approach is to illustrate the effect ofNPO on ENSO teleconnections by compositing SLPand HPF according to ENSO phase and further by NPOphase. For both variables, signal strength and stability are considered. Circulation signals (SLP) are considered on a spatial domain including North Americaand adjoining oceans. This is northward and downstream of the tropical and North Pacific forcing centers, respectively. Precipitation signals are consideredwithin the contiguous United States. All anomalies areconstructed relative to the 1933–93 base period.3. SLPa. Analysis procedureTo illustrate the nature of NPO influence on ENSOteleconnections, we describe signal strength and signal stability, or consistency from one winter to anotherwithin a composite. SLP signal strength is measuredby composite anomaly means, while stability is expressed by intracomposite standard deviations. Thestandard deviations are expressed as percentage oflocal climatological standard deviation computed fromthe entire 61-winter climatology. Signal is separatedfrom noise by statistical significance assessment viabootstrap resampling (Efron 1982). The approach issensitive to composite size and is described in a simi-FIG. 1. Dots represent station locations for 168 stations usedin this study.2717
lar context in Gershunov and Barnett (1998) andGershunov (1998). SLP signal strength and stabilityresults are presented in Figs. 2 and 4, respectively.b. ResultsThe left panels of Fig. 2 display the mean SLPanomaly for the El Niño composite and subcompositesaccording to NPO phase, as indicated. The El Niñosignal over the North Pacific consists of an anoma-lously deep Aleutian low with low pressure anomalies stretching and diminishing toward the southeastalong the west coast of North America. Furthercompositing by NPO phase reveals that the Pacificsector El Niño SLP signal is determined primarily inEl Niño winters occurring during the high phase of theNPO. In such winters, the Aleutian low as well as theanomalously low SLP along the West Coast are almosttwice that for all El Niño years. By contrast, El NiñoFIG. 2. Mean SLP anomalies for the (a) El Niño and (b) La Niña JFM composites expressed in millibars. Middle panels [(c) and (d)]present the same information for El Niño and La Niña composites subcomposited by the high NPO phase, while lower panels [(e) and(f)] represent the low NPO subcomposites. The zero line is thickened. Thin contours are drawn at 0.5-mb intervals. Negative contoursare dashed and positive contours are solid. Values significant at α 0.1, 0.05, and 0.01 are lightly, medium, and darkly shaded.2718Vol. 79, No. 12, December 1998
winters ocurring during the low phase of the NPO exhibit a rather different and mostly insignificant SLPanomaly pattern in the eastern North Pacific.During La Niña winters (Fig. 2b) a pattern roughlyinverse of the El Niño pattern is evident. The positiveSLP anomaly in the North Pacific, however, is notcentered on the climatological position of the Aleutian low, but is rather pushed out to the Bering Sea andalong the U.S. west coast [see Hoerling et al. (1997)for an investigation of the physics responsible for thenonlinearity of ENSO teleconnections]. Furthercompositing by NPO phase reveals that the North Pacific La Niña signal is associated with winters occurring during the low phase of the NPO (Fig. 2f). Amoderately significant low SLP anomaly emerges overthe central United States. The La Niña pattern occurring during NPO’s high phase (Fig. 2d) is relativelydistorted in the North Pacific–North American sector.The center of the anomalously high SLP occurs in thePacific Northwest corner of the United States. Thewhole contiguous United States is characterized by statistically significant high pressure anomalies mergingwith the stronger anomaly in the Azores high.It is apparent that the typical El Niño and La NiñaSLP anomalies in the North Pacific–North Americansector occur preferentially during winters characterizedby the high and low NPO phases, respectively. This isthe constructive ENSO–NPO phase relationship. In theopposite, or destructive, phase pairings the typicalENSO signals tend to be seriously distorted. This isexpected to have direct implications for ENSO-relatedpredictability over the contiguous United States.A relationship between ENSO, NPO, and SLP overthe North Atlantic is suggested in Fig. 2. The NorthAtlantic oscillation (NAO) is associated with changesin surface westerlies over the North Atlantic and is aprimary determinant of European climate (e.g., Hurrel1995). The typical NAO signature in the SLP anomalyfield is a dipole between the strengths of the Bermuda–Azores high and the Icelandic low. The NAO appearsto be in a positive phase (stronger westerlies) duringLa Niña winters, especially those occurring during thehigh NPO phase. The negative NAO phase is observedduring El Niño winters, especially those occurring during the low NPO phase. Why are destructive ENSO–NPO phase combinations associated with moresignificant NAO excursions? This important questionis beyond the scientific and geographic scope of thispaper. Preliminary results indicate a weak contemporaneous relationship between ENSO and NAO. Thisrelationship is reflected in Figs. 2a and 2b. NPO andBulletin of the American Meteorological SocietyNAO indices suggest a lagged relationship with theNPO leading by several years. A weak contemporaneous relationship is manifested in Figs. 3a and 3b.NAO has an apparent tendency to be in the same phaseduring El Niño (La Niña) as during low NPO (highNPO) phases. However, when ENSO extreme yearsare removed from the composites, high NPO wintersare no longer associated with coherent North AtlanticSLP anomalies (Fig. 3c). A rigorous investigation ofthe links between ENSO–NPO and NAO is deferredto a future paper.Figure 4 examines the stability of the SLP signals.Intracomposite SLP anomaly standard deviation relativeto the climatological standard deviation is displayedin percent in the same format as the SLP anomalies inFig. 2. These standard deviations reveal that the Aleutian low SLP anomaly (especially its northwestern extent) exhibits superclimatological stability (i.e., lowerthan climatological variability) during El Niño wintersbut significantly so only during the high NPO phaseyears. The same can be said for the subclimatologicalstability around the west coast of the United States.This is due to the large intracomposite differencesbetween the southeastern extension of the Aleutian lowSLP anomaly. The Gulf Coast SLP anomaly also tendsto be less stable during El Niño–high NPO winters.The high SLP anomaly observed during La Niñawinters tends to be stable during both phases of theNPO right along the U.S. west coast, but with largerand more spatially coherent significance during theconstructive phase (low NPO). The highly localized(and statistically insignificant) low SLP anomaly in theeastern Gulf of Alaska occurring during the constructive phase also appears to be very stable. The Azoreshigh anomaly, although also weak, similarly tends tobe very stable during La Niña–low NPO winters.To summarize, examination of Figs. 2 and 4 generally suggests that the major North Pacific–North American El Niño and La Niña SLP anomalies expected toaffect the U.S. climate tend to be both stronger and morestable during constructive ENSO–NPO phase pairings.Destructive phase pairings, however, may be associatedwith anomalous winters in Europe and eastern NorthAmerica through their association with the NAO.4. HPFa. Analysis procedureThe processing of HPF data is described in detailby Gershunov (1998). Quantiles for HPF are derived2719
FIG. 3. SLP anomalies for the (a) high and (b) low NPO JFM composites including ENSO extreme years. (c) and (d) Same as (a)and (b) but with ENSO extreme winters excluded. Note that the composite pattern displayed in (c) is calculated by excluding eight ElNiño winters and only five La Niña winters (see Table 1). Contours and shading are as in Fig. 2.at each station from the 61-yr climatology. Eachseasonal value is then ranked according to its respective climatological probability of being larger thananother observation from the same empirical probability density function. This quantile transformation isdone to ensure that a specification based on a composite mean frequency will not be artificially biasedtoward higher values. The composite means representsignal magnitude and are displayed in quantile unitsin Fig. 5.Specification skill and stability is assessed viacross-validated proportion of the intracomposite variance (R2cv) explained by the composite mean. Skillfulspecification is indicative of repeatable conditionsfrom one winter to another within a composite. TheR2cv is used here to assess stability because of themeasure’s direct usefulness in assessing potential predictability (Gershunov 1998). HPF is a variable wewant to be able to predict. Areas with potential predictability are those characterized by some appropriate combination of signal magnitude and stability. TheR2cv for HPF composites is displayed in Fig. 6.2720b. ResultsConsider the El Niño HPF signal (left panels ofFig. 5). A zonally uneven north–south gradient separates the wet southwest and southeast from the drynorthwest and northeast. Subcompositing by NPOphase produces a similar but stronger pattern duringthe constructive (high NPO) phase. Because of thereduction in degrees of freedom, higher signal magnitude is not everywhere reflected in higher statisticalsignificance; however, the similarity of Figs. 5a and5c is evident. The pattern of the destructive phase(Fig. 5e) is generally similar, especially in the easternUnited States, but rather weak and confused in spatialdetail, particularly in the western and central UnitedStates. Just about the only significant and spatiallycoherent part of the signal is evident along the southeastern and Gulf coasts during the destructive phase.The pattern correlation coefficient between the canonical El Niño pattern shown in Fig. 5a and subcompositeEl Niño anomalies during high (low) phases of theNPO displayed in Fig. 5c (Fig. 5e) is 0.89 (0.70), corresponding to 79% (49%) of spatial variability shared.Vol. 79, No. 12, December 1998
FIG. 4. SLP intracomposite standard deviation for the (a) El Niño and (b) La Niña JFM composites expressed in millibars.Subcompositing in middle [(c) and (d)] and lower [(e) and (f)] panels is the same as in Fig. 2. Intracomposite standard deviations areexpressed as percentages of the climatological standard deviations. The 100% contour is thickened. Smaller contours are dashed,larger contours are solid; all are drawn at 20% intervals. Statistical significance is represented by shading as in Fig. 2.The La Niña HPF pattern is largely the inverse ofthe El Niño pattern (cf. Figs. 5a and 5b). The inversepatterns differ mainly in that the opposite signal isstronger in the southwest and weaker in the northeast.Compositing by NPO phase reveals an accentuatedLa Niña signal during the constructive phase (Fig. 5f)and a rather weak and spatially incoherent signal during the destructive phase (Fig. 5d). The pattern correBulletin of the American Meteorological Societylation coefficient between the canonical La Niña pattern shown in Fig. 5b and subcomposite La Niñaanomalies during high (low) phases of the NPO displayed in Fig. 5d (Fig. 5f) is 0.38 (0.86), corresponding to 14% (74%) of spatial variability shared.Examination of Fig. 6, moreover, reveals that mostof the significant HPF anomalies are also stable or consistent from one winter to another within a particular2721
FIG. 5. HPF for the (a) El Niño and (b) La Niña JFM composites expressed as quantiles of the local 61-yr climatologies.Subcompositing in middle [(c) and (d)] and lower [(e) and (f)] panels is the same as in Fig. 2. The 0.5th quantile (median) is thickened.Thin contours are drawn at 0.1 intervals below (dashed) and above (solid) the median. Statistical significance is represented by shading as in Fig. 2.composite. This leaves signal strength and stabilityassociated with ENSO, with minor local exceptions,largely attributable to the constructive ENSO–NPOinteractions. An example of a local exception to this2722rule is the strong and stable dryness in central California during La Niña–high NPO winters.These results are consistent with SLP results presented above both in their main thrust suggesting poVol. 79, No. 12, December 1998
FIG. 6. Cross-validated proportion of variance (R2cv) in the JFM HPF explained by the phase model for (a) El Niño and (b) La Niñawinters. Subcompositing in middle [(c) and (d)] and lower [(e) and (f)] panels is the same as in Fig. 2. Positive values are contoured at0.1 intervals. The zero contour is thickened. Statistical significance is represented by shading as in Fig. 2.tential predictability during constructive ENSO–NPOphase winters and in their spatial agreement. For example, the accentuated high frequency of heavy rainfall in the northwest during La Niña–low NPO wintersBulletin of the American Meteorological Society(Fig. 5f) is consistent with the existence of a localizedand stable low SLP anomaly in the eastern Gulf ofAlaska (Figs. 2f and 4f).2723
5. Summary and conclusionsDocumented ENSO teleconnections to NorthAmerica (e.g., Ropelewski and Halpert 1986, 1996;Kiladis and Diaz 1989; Gershunov and Barnett 1998)are complicated by large inter–El Niño or inter–La Niña variability (Kumar and Hoerling 1997;Livezey et al. 1997; Gershunov 1998). While some ofthis variability may be due to details of the tropicalPacific forcing and some to the inherent and unpredictable internal atmospheric variability, a significant andpotentially predictable portion appears to be due to thenon-ENSO interannual and longer-period coherentmodes of climate variability. We presented evidencethat the NPO modulates ENSO teleconnections affecting North America. El Niño (La Niña) signals arestrong and stable during the high (low) NPO phase.Alternatively, signals tend to be weak, spatially incoherent, and unstable during the El Niño–low NPO andLa Niña–high NPO phase combinations. Given theimportance of signal strength and stability in determining climate predictability, we expect high (low) NPOepochs to be conducive to El Niño– (La Niña–) relatedpredictability. In other words, our confidence in anyNorth American ENSO-based climate forecast thatresembles canonical El Niño or La Niña patternsshould be conditioned on NPO phase.Although the present study is purely empirical,these results are relevant to the problem of ENSObased climate forecasting with dynamical models.These so-called two-tiered forecasting schemes(Bengtsson et al. 1993; Barnett et al. 1994) commonlyinvolve forcing an atmospheric general circulationmodel (AGCM) with a tropical Pacific SST anomalyforecasted with a dynamical, statistical, or hybridmodel of ENSO, while climatological SSTs are prescribed elsewhere. Given a strong tropical Pacific SSTanomaly, a realistic AGCM will produce an ensemblemean North American climate response similar to theobserved canonical ENSO anomaly. Such AGCMsforced with the strong and well-predicted 1997/98tropical Pacific warm anomaly correctly predicted thestrong and typical El Niño climate signal in NorthAmerica (e.g., Mo et al. 1998). Our results raise thequestion, “Would the 1997/98 North American winter AGCM forecasts have been so successful if theNPO had not been in its high phase?” An alternativequestion is, “If a strong La Niña event develops in thewinter of 1998/99, as currently forecast by most models, and if the North Pacific persists in its cold phase,can we be confident in any North American climate2724forecast resembling canonical La Niña conditions?”The empirical results presented here certainly suggestthat we should not have much confidence in such aforecast. It seems imperative that the state of the NPObe reckoned in all ENSO-based forecasts for the NorthAmerican winter climate, whether statistical or dynamical. Some operational climate forecasting groupshave begun to include persisted North Pacific SSTanomalies in the forcing field of their ENSO-basedAGCM prediction schemes (L. Goddard 1998, personalcommunication). At present, however, it is not knownwhether AGCMs are able to successfully simulate theNorth American climatic manifestations of the ENSO–NPO interference. A study examining several GCMsin this regard is forthcoming.How does the NPO modulate the consistency andstrength of El Niño anomalies? The strongest atmospheric manifestation of the NPO is in the strength ofthe Aleutian low (Mantua et al. 1997; our Fig. 3), whichis also well known and shown here to be affected byENSO teleconnections. We hypothesize that a deeperAleutian low shifts the storm track southward whileEl Niño provides an enhanced eastern tropical Pacificmoisture source for the storms to tap. Alternatively, aweaker Aleutian low during the low phase of the NPOpaired with La Niña steers cyclonic storms farthernorth, increasing precipitation in the northwest whilethe less frequent storms passing over the southwesttend to be drier than normal because less moisture isavailable from the eastern tropical Pacific. This paradigm is generally consistent with observed precipitation anomalies in the western United States.The atmospheric pressure anomaly in the Aleutianregion is sensitive to ENSO phase. Therefore, its magnitude, as determined by the NPO may be reducedduring low NPO–El Niño and high NPO–La Niñawinters. It should not be surprising, therefore, that suchNPO–ENSO combinations produce confused SLP signals and spatially incoherent, unstable precipitationsignals. Furthermore, storms, even if dislodged farthersouth during the high NPO phase, would tend to bedrier during La Niña winters because of the reducedeastern tropical Pacific moisture source. The morenortherly storm track during low phases of the NPOputs most storms somewhat out of reach of the enhanced tropical moisture source during El Niño winters. The storms that do wander farther south in suchwinters probably tend to be wetter. This may help explain the spatially incoherent SLP anomaly patternsover the northeastern Pacific and HPF anomaly patterns over the contiguous United States during winVol. 79, No. 12, December 1998
ters characterized by destructive ENSO–NPO phasecombinations.Less general and more locally rooted theories mayhold on regional scales and other low-frequency modesare likely important modulators of interannual variability in other parts of the world. Lacking good physical understanding of most of these documentedinterannual and lower-frequency modes (e.g., Mannand Park 1996), we are far from being able to physically forecast their evolution. However, the timescalesinvolved in the evolution of quasi-decadal coupledclimatic modes, such as the NPO, make them amenable to persistence forecasting with le
tial domain used in our SLP analysis extends from 20 to 70 N over the Western Hemisphere. Precipitation data were obtained from the National Climatic Data Center. Daily precipitation records at 168 stations in the contiguous United States were se-lected for long and reasonably continuous records. Station locations are denoted by dots in Fig .