Transcription
BMC Plant BiologyBioMed CentralOpen AccessResearch articleCloning of transgenic tobacco BY-2 cells; an efficient method toanalyse and reduce high natural heterogeneity of transgeneexpressionEva Nocarova and Lukas Fischer*Address: Charles University in Prague, Faculty of Science, Department of Plant Physiology, Vinicna 5, CZ 128 44 Prague 2, Czech RepublicEmail: Eva Nocarova - evanocarova@seznam.cz; Lukas Fischer* - lukasf@natur.cuni.cz* Corresponding authorPublished: 22 April 2009BMC Plant Biology 2009, 9:44doi:10.1186/1471-2229-9-44Received: 30 September 2008Accepted: 22 April 2009This article is available from: http://www.biomedcentral.com/1471-2229/9/44 2009 Nocarova and Fischer; licensee BioMed Central Ltd.This is an Open Access article distributed under the terms of the Creative Commons Attribution License (http://creativecommons.org/licenses/by/2.0),which permits unrestricted use, distribution, and reproduction in any medium, provided the original work is properly cited.AbstractBackground: Phenotypic characterization of transgenic cell lines, frequently used in plant biologystudies, is complicated because transgene expression in individual cells is often heterogeneous andunstable. To identify the sources and to reduce this heterogeneity, we transformed tobacco(Nicotiana tabacum L.) BY-2 cells with a gene encoding green fluorescent protein (GFP) usingAgrobacterium tumefaciens, and then introduced a simple cloning procedure to generate cell linesderived from the individual transformed cells. Expression of the transgene was monitored byanalysing GFP fluorescence in the cloned lines and also in lines obtained directly aftertransformation.Results: The majority ( 90%) of suspension culture lines derived from calli that were obtaineddirectly from transformation consisted of cells with various levels of GFP fluorescence. In contrast,nearly 50% of lines generated by cloning cells from the primary heterogeneous suspensionsconsisted of cells with homogenous GFP fluorescence. The rest of the lines exhibited "permanentheterogeneity" that could not be resolved by cloning. The extent of fluorescence heterogeneityoften varied, even among genetically identical clones derived from the primary transformed lines.In contrast, the offspring of subsequent cloning of the cloned lines was uniform, showing GFPfluorescence intensity and heterogeneity that corresponded to the original clone.Conclusion: The results demonstrate that, besides genetic heterogeneity detected in some lines,the primary lines often contained a mixture of epigenetically different cells that could be separatedby cloning. This indicates that a single integration event frequently results in various heritableexpression patterns, which are probably accidental and become stabilized in the offspring of theprimary transformed cells early after the integration event. Because heterogeneity in transgeneexpression has proven to be a serious problem, it is highly advisable to use transgenes tagged witha visual marker for BY-2 transformation. The cloning procedure can be used not only for efficientreduction of expression heterogeneity of such transgenes, but also as a useful tool for studies oftransgene expression and other purposes.Page 1 of 11(page number not for citation purposes)
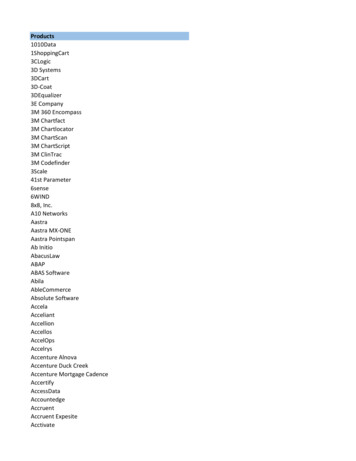
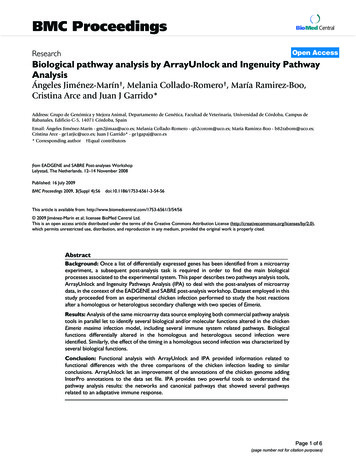
BMC Plant Biology 2009, 9:44BackgroundTobacco BY-2 cell line is the most popular and widelyused cell line in plant research. Hundreds of scientificpapers have been published using this line as a model tostudy various aspects of plant cell physiology. BY-2 cellsare relatively homogenous, allowing studies of cell phenotypes [1]. Moreover, the cells exhibit high growth rate,enabling synchronization of cell divisions and cell-cycleanalyses [2,3]. Being easily transformable either by particle bombardment [4] or by co-cultivation with Agrobacterium tumefaciens [5], transgenic derivatives of BY-2 cellline have had high impact in analyses of protein functionby ectopic expression, gene knock-outs or translationalgene fusions. GFP-tagging of proteins provides viablestaining of different cell structures and organelles andanalyses of subcellular protein localization [6,7]. Theexpression of fluorescent protein constructs can be easilymonitored by fluorescence microscopy, whereas expression of non-tagged transgenes cannot be readily detectedat individual cell level. In both cases, homogenous andstable expression of transgenes is highly desirable for bothmolecular/biochemical analyses of the total cell cultureand for monitoring the effects of transgene expression inindividual cells.Variation in transgene expression in independent transgenic lines has been repeatedly reported to be related tothe sequence of the introduced gene construct, involvingRNA-sensing mechanism, the locus of insertion, thenumber of insertion copies, and the initial level of transgene expression [8-13].The impact of the position of the inserted transgene in thechromosomal environment remains unclear, and thereports are partly controversial. In contrast to classicalstudies [8], Schubert with colleagues reported that the siteof insertion had rather marginal effect; the expression ofreporter genes under the control of a strong promoter wascomparable among independent transgenic Arabidopsisplants harbouring the same transgene copy number [11].However, silenced transgenes integrated into heterochromatin regions were not included in the study due to selection bias, as revealed by subsequent analyses of transgenicplants or cell lines generated without selection pressure[12,14]. Recently, Fischer with colleagues showed that theintegration site significantly influences the sensitivity ofthe transgene to RNA silencing rather than affecting its initial expression level [15].In contrast to numerous analyses of independent transgenic lines, much less attention has been paid to analysesof genetically identical clones [16,17], which could bringvaluable information about the variability of transgeneexpression independently of the positional Analyses of GFP-tagged transgenic BY-2 cell lines in ourlaboratory repeatedly produced only a low frequency oflines with well-balanced and stable fluorescence in allcells. In order to analyse the nature and sources of this variability, we transformed tobacco BY-2 cell line with a geneencoding free GFP, which allows simple in situ evaluationof transgene expression levels via assessment of green fluorescence. The homogeneity and stability of GFP fluorescence was monitored in both the primary calli obtainedafter Agrobacterium-mediated transformation and in suspension cultures derived from these calli. In order to eliminate high natural heterogeneity in GFP expression foundin the primary lines, we introduced a simple cloning procedure. In addition to reducing the heterogeneity of GFPexpression, the method also offered the opportunity tostudy the variability of transgene expression in geneticallyhomogeneous clones, thus contributing to understandingof the impact of positional effect in transgene expression.ResultsGFP fluorescence in primary calli and suspensionsobtained after transformationAbout 70% of round-shaped calli that were obtained afterthe Agrobacterium-mediated transformation of BY-2 cellsdisplayed GFP fluorescence intensity sufficient for reliableevaluation of its homogeneity. Out of these calli, the GFPfluorescence was homogenous over the whole callus inonly 35 – 50% cases in three independent transformations (Figure 1a; Table 1). The rest of the calli containedregions with evidently different levels of GFP fluorescence. Out of these heterogeneous calli, 25% formed separate sectors (Figure 1a) and 36% were mixed in a mosaicarrangement (Figure 1a; Table 1). The frequency of thesecategories was comparable in all three transformations.Suspension cultures derived from the mixed calli contained cells with various GFP fluorescence intensities, asexpected. However, also the majority ( 70%) of homogenous calli gave rise to heterogeneous suspensions (Figure1b). The cells with varied GFP fluorescence were predominantly in separate cell files, but occasionally were locatedeven within a single cell file (Figure 1b). Classifying cellsaccording to their GFP fluorescence intensities as high,low, or no fluorescence revealed that the proportionsamong the categories remained stable in the majority ofthe suspension cultures. Only in few lines (6/3; 1/2) theproportion of cells with high GFP fluorescence graduallydeclined with time (Figure 2).Cloning of suspension culturesWe introduced a simple and rapid method to generateclones from individual cells or cell files from the suspension cultures as follows: An excess of wild-type BY-2 suspension cells was added to the suspension culture oftransformed (kanamycin resistant) cells in stationaryPage 2 of 11(page number not for citation purposes)
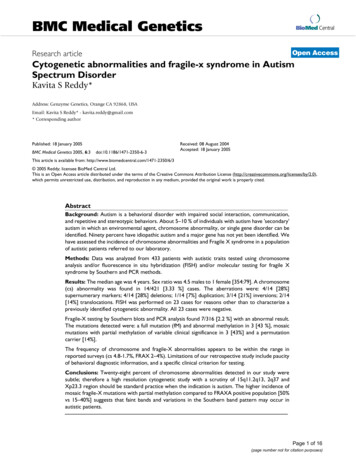
BMC Plant Biology 2009, se of growth (Figure 3a). The mixture was then appliedonto a Petri dish with solid MS medium containing kanamycin. Within 10 days, macroscopically visible calliappeared from individual resistant cells or cell files on the"feeder layer" of the wild-type BY-2 cells (Figure 3b, c).Few days later these "secondary" calli reached the size of 1– 3 mm and could be transferred to a fresh medium forsubsequent evaluation of GFP fluorescence homogeneity.FigureHeterogeneitysioncultures1of GFP fluorescence in BY-2 calli and suspenHeterogeneity of GFP fluorescence in BY-2 calli andsuspension cultures. (a) Primary calli obtained after transformation, showing calli with homogeneous and heterogeneous GFP expression either in mosaic or sectorialarrangements of cell populations with distinct GFP fluorescence. (b) Non-homogenous GFP expression in suspensioncells. The arrows indicate cells with evidently different GFPexpressions located in a single file. Scale bars: 1 mm for A, 50μm for B.GFP fluorescence in secondary calli and suspensionsCloning of suspension cultures with heterogeneous GFPfluorescence resulted in secondary calli, of which an average 93% gave rise to cell lines with almost exclusivelyhomogenous GFP fluorescence (Table 1). Although themajority of secondary calli seemed to be homogenous,more than half of the suspension cultures derived fromthese calli still consisted of cell populations with variousGFP levels (Table 1). The frequency of homogenous suspensions varied depending on the original suspension(Figure 4). Some lines (e.g. 1/3, 5/6) gave rise to bothhomogenous and heterogeneous suspension, whereas inthe case of line 1/7 practically all the secondary and tertiary suspensions were homogenous, with either high orlow GFP fluorescence intensities. In the case of line 6/3 ora secondary clone 5/6a, the original heterogeneity of GFPfluorescence persisted in all derived clones (Figure 4);even tertiary cloning of these "permanently heterogeneous" lines (e.g. 5/6am) did not diminish their heterogeneity. Generally, subsequent cloning of secondary clonesproduced almost exclusively homogeneous offspring.Their heterogeneity patterns in terms of proportions ofindividual GFP fluorescence categories corresponded tothose of the original clones (Figure 4). Cloning of suspensions with homogeneous GFP fluorescence consistentlygave homogenous subclones (e.g. 1/7d in Figure 4).Table 1: Frequencies of BY-2 calli and suspensions with homogeneous and heterogeneous GFP fluorescencePrimary suspensionsSecondary suspensionsGFP fluorescence in callusPrimary calliHomogeneousHeterogeneousSecondary calliHomogeneousHeterogeneousHomogeneous39.3% 9.7%29.2% 5.3%70.8% 5.3%93% 2.3%46.3% 5.4%53.7% 5.4%Heterogeneous – mosaic35.8% 13%0%100%7% 2.3%0%100%Heterogeneous – sectorial24.9% 6.8%0%100%0%0%100%11.5% in total88.5% in total42.8% in total57.2% in totalFrequencies of homogeneous and heterogeneous calli and suspension cultures derived from these calli in primary lines obtained aftertransformation, and in secondary lines produced by cloning of primary heterogeneous (!) suspensions. Values represent means SD (n 3); dataare from three independent transformations; in every replication the number of evaluated lines was 60–80 for calli and 20 for suspensions).Page 3 of 11(page number not for citation purposes)
BMC Plant Biology 2009, ure 2in frequency of GFP-expression categories in selected primary BY-2 suspension cultures with timeChangesChanges in frequency of GFP-expression categories in selected primary BY-2 suspension cultures with time.GFP-expression categories: , strong fluorescence; weak fluorescence, - no fluorescence.The proportions of GFP fluorescence categories in bothhetero- and homogeneous suspensions remained stablefor months in almost all cloned secondary suspensions(data not shown).Molecular analysis of the causes of GFP fluorescenceheterogeneityAnalysis of T-DNA insertions in individual clones bySouthern hybridisation (Figure 5) revealed that GFP fluorescence heterogeneity could have several causes. Lines 1/7 and 1/3 were composed of two genetically differentclones that were separable by cloning, as shown by comparing 1/7d with 1/7o or 1/3f with other 1/3 clones (Figure 5). Other clones that also strongly differed in theirproportions of the GFP fluorescence categories (Figure 4)seemed to be genetically identical, as shown by comparing 1/3a, 1/3c and 1/3d or 5/6a, 5/6b, 5/6h and 5/6j samples, where the GFP probe hybridised with equally-sizedrestriction fragments after cleavage with HindIII or BamHI(Figure 5a). A possible presence of mutations within the35S promoter or GFP sequence was excluded by sequencing of 35S-GFP cassettes obtained by PCR amplification;all sequences obtained from individual 5/6 clones 5/6a,5/6b, 5/6h and 5/6j were identical (data not shown).Genetically identical clones of lines 1/3 and 5/6 were further analysed with respect to DNA methylation. The 35SGFP cassette was cleaved out with EcoRI and HindIII, andexposed to the action of several methylation-sensitiveenzymes (Bsu15I, Eco72I and Eco47I). Subsequent South-Page 4 of 11(page number not for citation purposes)
BMC Plant Biology 2009, rces of GFP expression heterogeneityAnalysis of GFP fluorescence in primary suspensionsobtained either directly from transformation or from secondary and tertiary clones revealed the coexistence of cellpopulations with different T-DNA insertions in some primary lines, representing genetic heterogeneity. Although,the majority of GFP-expression heterogeneity is mostlikely determined epigenetically.FigureAscheme3 of the BY-2 cloning procedureA scheme of the BY-2 cloning procedure. (a) Mixtureof transgenic and wild-type lines before plating onto solidmedia. (b) Cloned calli emerging on the feeder layer 10 daysafter plating. (c) Cloned calli of a heterogeneous lineobserved with a fluorescence stereomicroscope. Scale bars:100 μm for A, 1 mm for C.ern blot analysis did not reveal any change in cytosinemethylation at the analysed restriction sites, with theexception of the completely silenced clone 5/6j, whoseDNA seemed to be methylated in the Bsu15I and Eco72Irestriction sites (Figure 5b).DiscussionMonitoring of GFP fluorescence – a suitable way toestimate GFP expression in situThe green fluorescent protein (GFP) is an importantreporter molecule for monitoring gene expression andprotein localization in vivo, in situ, and in real-time observation. GFP fluorescence is stable, species-independent,and can be followed non-invasively in living cells wherethe green fluorescence reports active transcription andtranslation of the GFP gene [18]. Because of its simplicity,monitoring GFP fluorescence has been also routinely usedin transgene silencing studies [19,20]. Although GFP isgenerally very stable [21], some differences in protein orfluorescence levels may occur due to protein degradationunder certain treatments or in certain cell types. Nevertheless, in phenotypically homogeneous cell lines culturedunder stable conditions, monitoring GFP fluorescence canbe regarded as a suitable method for reliable estimation ofGFP expression levels.Genetic heterogeneitySouthern hybridisation of genomic DNA isolated fromselected clones of lines 1/7 and 1/3 clearly documentedthat even the round-shaped primary calli can contain cellpopulations with different T-DNA insertions. Because theprobability of plating independently transformed cell filesso closely together was low when considering plating density of 30 – 50 calli per 6 cm-diameter plate, these cellsare likely to represent the offspring of independentlytransformed cells that were located in a single cell file.Considering the large number of plated cells and transformation efficiency of 0.1 – 0.5%, the results indicate thatthere could be cell files that are highly susceptible to Agrobacterium-mediated transformation. Alternatively, thegenetically mixed calli could represent the offspring of asingle cell transformed in S or G2 phase of the cell cyclewith multiple T-DNAs, which then segregated unequallyto daughter cells during mitosis.Epigenetic heterogeneityAnalyses of genetically identical lines have documenteddevelopmentally- and environmentally-derived variability in transgene expression [10,17] and in stress-inducedsilencing [16]. In our study, GFP expression also variedamong genetically identical clones even though the cellswere phenotypically homogeneous and were culturedunder stable conditions. This indicates that factors otherthan environmental or developmental or stress situationscan induce changes in GFP expression. Gene expression isgenerally influenced by specific chromatin marks thatmay be present on both DNA and associated proteins[22]. Our methylation analysis of the GFP gene fromselected genetically identical lines revealed that cytosins inanalysed restriction sites were methylated only in somerestriction sites and only in the line 5/6j with completelysilenced GFP expression. This indicates that all otherobserved differences in GFP expression levels and heterogeneity are either independent of DNA methylation ormethylation occurred in locations other than the selectedrestriction sites. The epigenetic state of chromatin is heritable through cell division, but can be easily modulated inresponse to certain triggers. For example, changes at thechromatin level such as cytosine methylation can accompany gene or transgene silencing [22] although the presence of methylated DNA is not necessarily related to thesilenced phenotype [23].Page 5 of 11(page number not for citation purposes)
BMC Plant Biology 2009, ure 4 of GFP-expression categories after the cloning of primary and secondary BY-2 linesFrequencyFrequency of GFP-expression categories after the cloning of primary and secondary BY-2 lines. (a) Primary cloning of suspensions obtained from calli directly after transformation. (b) Secondary cloning of selected subclones. The clonedlines are on the left, with progenies indicated by letters on the right. GFP-expression categories: , strong fluorescence; weak fluorescence, - no fluorescence.Page 6 of 11(page number not for citation purposes)
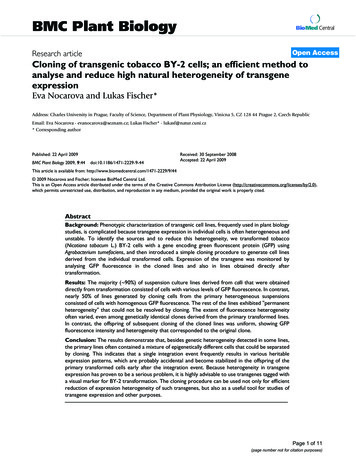
BMC Plant Biology 2009, ure 5 analysis of selected primary clonesMolecularMolecular analysis of selected primary clones. (a) analysis of T-DNA insertions by Southern hybridization of totalgenomic DNA digested with either BamHI (B) or HindIII (H). (b) Methylation analysis by Southern hybridization of totalgenomic DNA digested with HindIII (H) and EcoRI (E), cleaving out the 35S-GFP cassette, and further with methylation-sensitiveendocucleases Bsu15I, Eco72I or Eco47I, having restriction sites within the cassette; arrows indicate position of uncleaved 35SGFP cassette. The blots were hybridised with DIG-dUTP-labelled GFP probe. M, molecular weight ladder.Positional effect in the chromosomal environment at thesite of transgene integration is known to influence transgene expression [13], although it seems to have muchlower impact [11] than previously assumed [8]. Differentsites, or arrangements, of T-DNA insertion can influencethe accessibility/susceptibility of transgene to epigeneticregulation at either transcriptional or posttranscriptionallevel [15,24]; reviewed in [13]. Specifically in case of integration into heterochromatin region, the epigenetic information is almost regularly reflected in the chromatinstructure of the inserted T-DNA, which results in transgene silencing [12,14,25]. In our experiments, GFPexpression often varied strongly among clones with identical T-DNA insertions. For example, a single insertionresulted in completely different transgene expression patterns in genetically identical subclones of line 5/6 (Figure4). In previous studies, transgene expression was analysedin clonal plant replicates generated long time after theintegration event [10,17]. In contrast, the use of cell cultures and their cloning allowed us to analyse clones/replicates that arose immediately after the transgeneintegration. Since our results showed that GFP-expressionpatterns were stable and heritable in the cloned lines, thevarious expression patterns observed among geneticallyidentical clones had to be established and stabilized in theoffspring of the primary transformed cells early after theintegration event. The process of integration of "naked" TDNA is known to be accompanied by de novo establishment of specific chromatin composition and structure[25]. Our results clearly document that in certain insertionsites the establishment of different epigenetic states/trans-Page 7 of 11(page number not for citation purposes)
BMC Plant Biology 2009, 9:44gene-expression patterns is accidental and independent ofchromosomal environment in BY-2 cells.Heterogeneity in GFP expression derived from the coexistence of either genetically or epigenetically different cellswithin the primary lines was in some cases resolved bycloning. However, in many clones (e.g. line 6/3; Figure 4)the heterogeneity in GFP expression among individualcells persisted and could not be resolved by subsequentcloning, representing a state of „permanent expressionheterogeneity“. Van Leeuwen with colleagues alsoobserved spatial and temporal variability in the expression of luciferase gene in different leaves and leaf sectorsof stably transformed Petunia plants [10]. The authorsattributed this mosaic character of transgene expression totemporal changes in the accessibility of promotersequences for transcription factors, or variable levels ofthese factors in different leaf sectors at a time [10]. Thepattern of this transgene expression variability was moreor less specific for individual lines [10], similarly to theheterogeneity patterns observed in our lines 6/3c, 1/3a, 5/6a and their subclones (Figure 4). Since the heterogeneitypatterns were heritable through subsequent cloning, theycould be the result of specific variation in epigenetic statesat a certain genomic locus [26].Finally, the remaining evident cause of heterogeneity orinstability of GFP expression is silencing [27]. Occurrenceof transgene silencing was indicated by the presence ofcells with contrasting GFP levels in a single cell file (Figure1b) and by a gradual decline in the frequency of GFPexpressing cells observed in some lines (e.g. line 1/2; Figure 2). Silencing at the transcriptional level in connectionwith DNA methylation was demonstrated by the detection of methylated cytosin in clone 5/6j (Figure 5b). Therole of methylation was confirmed by using the DNAdemethylation drug, 5-azacytidin [28], which reactivatedGFP expression in several lines after several months ofsilenced GFP expression (e.g. lines 1/2, 5/6j; Nocarovaand Fischer, unpublished). Silencing of transgene expression is naturally triggered mainly by high transcript levels[11], but may also be related to changes in the epigeneticstatus of plant genomic DNA in the process of dedifferentiation [29] that accompanies preparation of transgenicplants and plant cell lines.Cloning of plant cells – history and futureThe first reports of cloning non-transgenic plant cells werepublished long time ago [30,31]. The method of cloningtransgenic plant cell line introduced in our study has notbeen, to our knowledge, published and used before.Müller with colleagues described protoplast-based cloning of transgenic wheat lines, although this method wastime-consuming and induced high frequency (up to 50%of clonal cells lines) of transgene silencing [16]. It tes that the process of protoplast formation and regeneration may be accompanied by stress-induced epigeneticchanges, causing transgene silencing [16]. The minimaloccurrence of silencing in our experiments indicates thatthe drug selection of resistant cells during the cloning procedure causes significantly little stress. In contrast to protoplast-based cloning, our method does not alwaysproduce clones from single cells, because BY-2 cellsremain temporarily attached in files. However, as the filesoriginate from single cells, they are genetically homogeneous and calli derived from these files represent real clones.Although our cloning procedure did not, against expectations, lead exclusively to lines with homogenous GFPexpression, clearly the cloning method is an effective wayto substantially increase the number of homogenouslines. Whereas only 10% of the primary cell lines werehomogenous just after transformation, the cloning oflargely heterogeneous lines produced additional 43% ofhomogeneous cell lines (Table 1).In addition to generating homogeneously expressingtransgenic lines, the cloning procedure appears to be asuitable tool for detailed analysis of the induction and stabilization of epigenetic changes connected with T-DNAinsertion into the plant genomic DNA. Thus, in a modified arrangement, cloning of lines with silenced GFPexpression using 5-azacytidin-containing media producedclones with reactivated GFP expression (Nocarova andFischer, unpublished). Another possible use of the cloning procedure includes the cloning of epigeneticallyshifted lines habituated to certain conditions [32]. Intransgenic lines carrying a negative selection gene whoseexpression is lethal under certain treatment, mixing anabundance of such a line with non-transformed linewould enable cloning of reversed, non-transformed lines.ConclusionBy analysing GFP fluorescence in tobacco BY-2 cells, wefound that expression of GFP transgene was highly heterogeneous in the majority of transgenic lines obtaineddirectly from transformation. This heterogeneity had twocauses: (1) genetic heterogeneity, namely the presence ofcells with different T-DNA insertions; and (2) epigeneticheterogeneity, including transgene silencing, formation ofstable epigenetic states early after transformation, and"permanent heterogeneity" with fluctuating changes inGFP expression. The genetic heterogeneity and the presence of cells in different but stable epigenetic states wasresponsible for almost half (43%) of the heterogeneity inthe primary lines, and could be resolved by cloning.Because the cloning procedure can significantly increasethe frequency/yield of homogenous lines, it is of high general impact for both molecular and biochemical analysesof BY-2 transgenic lines. In order to facilitate a simple wayfor assessment of transgene expression heterogeneity inPage 8 of 11(page number not for citation purposes)
BMC Plant Biology 2009, 9:44both primary and cloned lines, it is highly advisable to useGFP-tagged transgenes. Alternatively, for transgenes thatlack a visible, cell-autonomous phenotype the cloningprocedure can be used to obtain genetically homogeneouslines with statistically higher chance of homogeneoustransgene expression. Analysis of GFP expression in primary cell lines and their clones also showed that a singleT-DNA insertion often resulted in various heritable transgene expression patterns/epigenetic states. These lineswere probably established accidentally and became stabilized in the offspring of the primary transformed cellsearly after the integration event. Thus, the cloning procedure introduced in this study also appears to be suitablefor analysing the sources of variability in transgene expression.MethodsCultivation and transformation of BY-2 cell lineTobacco cell line BY-2 (Nicotiana tabacum L. cv. Bright Yellow 2 [33]) was cultured in modified MS medium [34].Cells in suspension were subcultured every seventh day (1ml of cells into 30 ml of liquid media). Stock BY-2 calliwere maintained on media solidified with 0.7% (w/v)agar and subcultured monthly. The cultures were kept indarkness at 26 C; suspensions were placed on orbitalincubator (IKA KS501, IKA Labortechnik, Staufen, Germany; orbital diameter 30 mm). Suspensions were prepared by resuspending of 1 ml of fresh calli in 30 ml ofliquid media by repeated pipetting through a cut tip(internal diameter 5 mm).Transformation of BY-2 line was performed by a slightlymodified protocol introduced by [5]. A 2 ml aliquot of 3day old BY-2 cells was co-cultivated with 200 μl of anovernight culture of Agrobacterium tumefaciens strainC58C1 carrying a helper plasmid pGV2260 [35] and amodified binary vector pCP60 [36] (kindly provided bydr. P. Ratet). The T-DNA contained a gene encoding redshifted green fluorescent protein [37] (kindly provided byABRC) inserted under the control of CaMV 35S promoterwith a single enhancer region. The T-DNA further contained neomycin phosphotransferase gene (NPTII) drivenby nopalin synthase promoter (pNOS), which providedkanamycin resistance. After co-cultivation, the cells werewashed with 60 ml of 3% sucrose and 20 ml of liquidmedium containing 100 μg/ml cefotaxim (CEFTAX,Hikma Farmaceutica, Terrugem, Portugal) in Nalgene
BioMed Central Page 1 of 11 (page number not for citation purposes) BMC Plant Biology . but also as a useful tool for studies of transgene expression and other purposes. Published: 22 April 2009 . and for monitoring the effects of transgene expression in