Transcription
UNSW Business SchoolAccounting Research Seminar SeriesTerm 1, 2020Minimum Stock Price Requirements andVoluntary DisclosureJames KavourakisThe University of MelbourneDate: Friday March 6, 2020Time: 3.00pm – 4.00pmVenue: BUS 216business.unsw.edu.auLast Updated 16 January 2017CRICOS Code 00098G
Minimum stock price requirements and voluntary disclosureJames KavourakisThe University of MelbourneAbstractThis study examines the disclosure choices of firms that breach NASDAQ and NYSE minimumstock price requirements. I find that non-compliance with the requirements is associated with anincrease in the volume of voluntary disclosure released in 8-K filings. This association is strongerin firms with a broader base of investors connecting the firms more strongly to listed markets, andextends to the use of forward looking statements in 8-K filings and press releases. I also examinethe consequences of the disclosure response to non-compliance and find associated improvementsin coverage by the media, broad measures of investor interest, stock liquidity, and prospects ofremaining listed on the exchange. My results suggest that minimum price requirements alterthe optimal disclosure policy of non-compliant firms, incentivizing greater voluntary release ofinformation to investors, an important consideration for exchanges and regulators weighing themerits of such delisting standards.
I. IntroductionSince 2003, the equity securities of more than 1,000 firms have traded at prices lower than 1.00.While this valuation is otherwise unremarkable, both the National Association of Securities Dealers(“NASDAQ”) and the New York Stock Exchange (“NYSE”) maintain minimum price requirements(“MPR”) permitting the exchange to delist ordinary equity securities with persistent per-share stockvaluations below this level. Breach of MPRs (“non-compliance”) occurs when a stock price remainsbelow 1.00 for 30 consecutive days.1 Such breaches are common, having occurred 1,957 timessince 2003, and are actively enforced. Failure to comply with MPRs leads to 42% of mandatoryexchange delistings, as non-compliant firms are forced to move listings to over-the-counter marketsor alternative exchanges without such requirements, potentially causing permanent destruction ofshareholder value (Macey et al., 2008)To rectify non-compliance with MPRs, firms must achieve ten consecutive days of trading withclosing prices above 1.00 within the six months that follow the breach event. MPRs, therefore,provide strong incentives for firms to intervene in the pricing of their stock. Firm often rectify stockprices using reverse splits, resulting in mechanical increases in stock prices that are attractive tofirms looking to avoid delisting (Macey et al., 2008; Čornanič and Novak, 2015). Non-compliantfirms may also engage in earnings management to influence stock prices (Čornanič and Novak,2015). Alternatively, these firms may alter voluntary disclosure and investor relations policies.2Voluntary disclosure provides a medium for firms to release positive news and attract liquidity totheir stock, reducing cost of capital or increasing expectations for future cash flow performance(Botosan, 1997; Aboody and Kasznik, 2000; Richardson et al., 2004). While non-compliant firmslikely implement a portfolio of the above options to remedy their stock price deficiencies, the extent1 MPRsare activated by trading prices on the NYSE and bid prices on the NASDAQ.example, in 2012 Sutor Technology made a combined announcement of both a breach of the NASDAQminimum bid price rule and the signing of an agreement with Equity Partners Inc. to act as investor relations consultantto assist the firm in regaining compliance with continuing listing rules. In this release, the firm asserted its objective toexpand its disclosures and inform the market of its positive future prospects. Similarly, in 2003, SpaceHub Inc. retainedIR Partners Inc. to assist it in recovering compliance. Actions taken by the IR firm included the considerable increasingof corporate disclosure (see http://www.irpartnersinc.com/news/).2 For2
to which such disclosures form part of their strategic stock price interventions is not clear.This paper examines the determinants and consequences of the use voluntary disclosure as aresponse to non-compliance with MPRs. MPRs are employed both on major US exchanges andon several other exchanges around the world.3 While prior studies emphasize the delisting of hightail-risk firms as motivation for the application of MPRs (Rhee and Wu, 2012), MPRs may alsoelicit positive responses from firms to avoid the delisting of their stock. Possible firm responsescould include the release of additional voluntary disclosures, enhancing the market valuation of thefirm while also decreasing information asymmetry and maintaining exchange quality and listingrevenue. Given both the importance of stock listing and the widespread use of MPRs, understandingthe responses of these firms to breaching MPRs is relevant to addressing the concerns of priorresearch that suggests these merits are based merely on ‘popular perception’ (Seguin and Smoller,1997).To provide evidence on the disclosure responses of firms to breach of MPR requirements, I firstexamine the characteristics associated with non-compliance by low stock price firms, identifiedusing notices of delisting rule non-compliance sent by the exchange and filed on Form 8-K between2003 and 2018 (hereafter “delisting notices”). Non-compliant firms typically release a lower volumeof voluntary disclosure, and suffer from lower levels of media coverage and investor recognition.Consistent with Rhee and Wu (2012), my findings also show that non-compliance with MPRs ismore prevalent in firms with poor accounting performance, and also that it is more prevalent infirms with more research-intensive operations. Collectively, these results suggest non-compliantfirms may be both less recognized by investors, affecting their pricing in the market (Merton, 1987),and of lower fundamental quality.Second, I examine the extent to which non-compliant firms respond to breaches of MPRs by altering3 Rheeand Wu (2012) suggest that the South Korean and Indonesian stock exchanges maintain minimum pricingrequirements. Further, in 2002, the Hong Kong Stock Exchange experimented with minimum pricing rules at lowerprice levels, before removing the rule after the market capitalization of stocks with values under HK 0.50 fell by asmuch as 88%. Additionally, the Toronto stock exchange maintains a flexible minimum pricing requirement (withoutnominated value) in Section 711 of its listing rules. Furthermore, the TSXV exchange maintains a minimum capitalraising price of 0.05 per security. The Frankfurt General Standard also requires listing prices greater than 1 Euro.3
their disclosure policies. I begin by investigating the the effect of non-compliance on the volume ofdisclosure. My findings are consistent with MPRs providing strong incentives for non-compliantfirms to increase the volume of voluntary disclosure released to the market. Non-compliance isassociated with a 3.25% increase in the volume of voluntary disclosure (1-2 disclosures) releasedby firms in the following 12-months. While research-intensive firms are more likely to be noncompliant with MPRs, there is no evidence that the disclosure response is conditional on proprietarycosts of disclosure common in such firms. Rather, my results show that the disclosure responseis more prevalent amongst firms with more diverse institutional shareholder bases focused onretail investors, suggesting that firms reliant on access to secondary markets are more likely to usevoluntary disclosure as a means of retaining stock listing.Several approaches are employed to confirm these findings. Making use of an exchange-intiated intervention in the enforcement of MPRs, I divide my sample between non-compliance and disclosureby examining the period between July 2008 and July 2009, where both the NASDAQ and NYSEsuspended the application of MPRs. I find no evidence that firms continue engage in disclosureresponses to pre-existing breaches of MPRs during the period of suspension. Instead, I find thedisclosure response is conditional on active enforcement of MPRs. Using alternative measures ofvoluntary disclosure also supports the primary results. Non-compliance is associated with increaseduse of forward-looking content reported in 8-K filings, in addition to increased use of press releases.Both results for alternative disclosures measures suggest that incrementally greater volumes ofdisclosure released by non-compliant firms following breach.The presence of explicit stock price targets such as those applied by MPRs may also incentivizemanagers to engage in stock hype, biasing the release of textual disclosures and quantitativeinformation to encourage stock price appreciation (Aboody and Kasznik, 2000; Nagar et al., 2003;Richardson et al., 2004). However, contrary to methods used for stock hype, I find that tone in8-K filings is negatively association non-compliance. Similarly, evidence from the stock returnssurrounding 8-K filings no support for a stock hype response. Given my evidence that non-compliant4
firms may under-disclose prior to non-compliance with MPRs, the absence of positive sentimentconveyed in 8-K filings suggests that MPRs may serve to motivate credible disclosures fromnon-compliant firms, alleviating under-disclosure in prior periods.Third, I examine the extent to which the disclosure response of non-compliant firms may addressthe recognition deficiencies that typify non-compliance. Analysts, media, and investors may beattracted to cover or invest in companies with more extensive or more frequent disclosure, as thisdisclosure may reduce search costs and increase the market’s awareness of smaller, less-visible firms(Botosan, 1997; Brennan and Tamarowski, 2000; Grullon et al., 2004; Graham et al., 2005; Busheeand Miller, 2012). Consistent with voluntary disclosure attracting both investors and coverage tothe stock, I find a positive association between non-compliance and both media coverage and broadmeasures investor interest. However, there is no association between non-compliance and eithercoverage by financial analysts or ownership by institutional investors. To confirm that improvementsin disclosure, media coverage and investor interest affect stock activity, I examine the impact of noncompliance on stock liquidity and find non-compliance is associated with improvements in liquidity.Further tests confirm that these consequences are postively associated with the magnitude of thedisclosure response of non-compliant firm. These results suggest that coverage by the financialpress may be an important channel through which non-compliant firms increase their recognition,potentially reducing capital costs through improvements in stock liquidity.Finally, I examine whether the disclosure response of non-compliant firms is associated with theprospects of remaining listing. I regress delisting outcomes over the post-period against the changein the monthly volume of voluntary and mandatory disclosure between pre- and post-periods. I findthat the change in the volume of voluntary disclosure is negatively associated with the probabilityof delisting in the following 12-month period. There is no evidence of such an association fornon-MPR-based delisting, and a positive association between MPR-based delisting and mandatorydisclosure. These differences are consistent with voluntary disclosure having a positive effect inmeeting the requirements of MPRs.5
The results of this study make several contributions. Primarily, the results may be of interest topolicymakers overseeing stock exchanges and listing standards. This study complements previouswork that suggests MPRs benefit market by permitting the removal of low-quality firms (Rhee andWu, 2012). Rather than improving the quality of markets by the removal of securities with low stockvaluations, my results suggest that MPRs may improve market efficiency by incentivizing voluntarydisclosure, improving liquidity and decreasing information asymmetry. Furthermore, prior studiesprimarily focus on the role of exchange operated qualitative governance standards (Macey andO’Hara, 2002; Klein, 2003; Chemmanur and Fulghieri, 2006; Jiang and Wang, 2008). In thisstudy, I providee evidence that MPRs, an exchange-based quantitative standard, may also serveas an important mechanism to incentivize greater transparency from low-exposure firms. As thedisclosure response of non-compliant firms is not conditional on research-intensity or competitiveforces, these results suggest that operational limitations on investor relations activity such as thoseidentified by Hong and Huang (2005) and Bushee and Miller (2012) may impede transparency priornon-compliance (Hong and Huang, 2005; Bushee and Miller, 2012).This study also directly contributes to research examining firm responses to non-compliance. Priorresearch has focused on the examination of stock splits and accrual-based earnings management(Macey et al., 2008; Čornanič and Novak, 2015). In contrast to the adverse effects of reverse stocksplits on stock liquidity and investor returns, my findings that non-compliant firms issue largervolumes of disclosure giving rise to greater recognition and liquidity suggest that firms may respondto non-compliance by taking actions that improve the information environment in which the firm’ssecurities exist.Finally, my findings may provide novel evidence on the influence of stock price incentives ondisclosure choices. Recent studies primarily use variation in stock price management incentivesfrom compensation and stock issuance decisions (Aboody and Kasznik, 2000; Lang and Lundholm,2000; Richardson et al., 2004; Kimbrough and Louis, 2011). In contrast, this study examinesvariation in stock price incentives introduced from external sources, and finds results consistent6
with these incentives motivating unbiased disclosures, consistent with Nagar et al (2003).The remainder of the paper proceeds as follows. Section II outlines the institutional backgroundassociated with MPRs. Section III discussed my data and variable construction. Section IV examinesthe determinants of non-compliance and my matching process. Section V reports the results oftesting. Section VI presents robustness tests. Section VII concludes.II. Institutional backgroundBoth the NASDAQ and NYSE have a range of listing and delisting standards with which firmsregistered on the exchanges must comply. These standards play a significant role in the maintenanceof orderly equity markets and promote corporate governance and disclosure objectives under theSecurities Exchange Act of 1934. The origin of MPRs stems from the late 1980s, when the SECbecame concerned about the increasing trend of penny-stock fraud (SEC, 2004).4 Following theenactment of the Securities Enforcement Remedies and Penny Stock Reform Act of 1990 (“CERAct”), the NASDAQ and NYSE sought approval for the implementation of MPRs to prevent pennystocks taking advantage of the absence of the enforcement of the CER Act on listed companies. Theapproval of MPRs traded off several competing interests. While many penny-stocks have genuinereasons to fund expansion using equity capital markets, both exchanges and regulators prioritizedthe need for the protection of the investors from fraud by low stock value companies, seeing stockprice as indicative of high risk and poor governance.Both exchanges adopt similar approaches to MPRs.5 NYSE regulations state that a firm is noncompliant ‘if the average closing price of a security as reported on the consolidated tape is less than4 Consistentwith the concern prevalent at the time, in 1990, Congress enacted the Securities Enforcement Remediesand Penny Stock Reform Act of 1990. This act increased the regulation and supervision of low-priced stocks inover-the-counter markets. Stocks listed on the NASDAQ and NYSE were exempt from many of the requirements.Consequently, the SEC lobbied the NASDAQ to raise governance standards for low priced stocks in the interest ofinvestor protection. In 1991, the NASDAQ successfully implemented and received approval for its minimum pricemaintenance requirement, soon followed by the NYSE. The purpose of these rules was to prevent penny-stocks fromtaking advantage of the absence of enforcement of the Penny Stock Reform Act enforcement against listed firms.5 NYSE requirements for MPRs can are located in section 802.01C of the Listed Company Manual. NASDAQrequirements can are located in the NASDAQ Continuing Listing Guide in Rule 5450(a).7
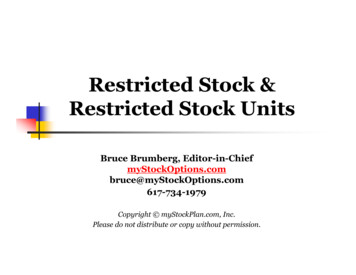
1.00 over a consecutive 30 trading-day period’. The NASDAQ enforces a similar requirement, butbase it on the bid price of the securities. While the NYSE is viewed to retain some discretion in itsapplication of MPRs, the NASDAQ applies the rules universally (Macey et al., 2008) Following 30consecutive days of sub- 1.00 stock price activity, exchanges send a notice of non-compliance tonon-compliant firms. The rules require non-compliant firms to file this notice on form 8-K with theSEC.6Following notification by the exchange, non-compliant firms are at risk of delisting and mustrectify stock price deficiencies to remain listed. These firms then make one of several choices.Non-compliant firms may seek immediately delisting, opting for alternative trading venues withoutMPRs with which they would be non-compliant (Macey et al., 2008). Most commonly, this venueis an over-the-counter market. Alternatively, firms on both exchanges have a six-month windowin which to achieve rectification, during which time the exchange encourages these firms to takeactions to rectify stock prices.7 Non-compliant firms achieve rectification by attaining stock pricesgreater than 1.00 for ten consecutive days. Following the expiration of these six months, there areseveral possible outcomes. The exchange may use its discretion to allow for the continued listing ofthe security. Non-compliant firms may also appeal delisting. For firms with plans to rectify stockprices, appeals may result in extended grace periods allowing for shareholder voting or other actionsto facilitate those plans. In the absence of reasons to allow for a prolonged listing, non-compliantsecurities delist from the exchange.III. Research DesignData sourcesTo examine the response of non-compliant firms to breaches of MPRs, I gather notices issued bythe NASDAQ and NYSE from 8-K regulatory filings lodged with the SEC and available on SEC6 Figure 1 provides a graphical representation of the timeline for delisitng as a result of minimum price requirements.7 Firmslisted on the NYSE are required to provide notice to the NYSE of intent to rectify or to delist.8
EDGAR between 2004 to 2017. These notices are reported under Item 3.01, and contain dataincluding the exchange of listing, the nature of listing or delisting requirement non-compliance, andinformation on time frame for rectification. I gather all notices referencing MPRs related to thenotification of non-compliance, resulting in 1,957 firm-breach observations, concentrated on theNASDAQ with only 198 occurring on the NYSE.These observations are then matched to data from additional sources. To examine the disclosureactivity of firms, I rely primarily on data extracted from 8-K filings also gathered from the SEC’sEDGAR database. For additional tests of voluntary disclosure, data on press releases comes fromRavenPack PR and data on conference calls from Thomson Reuters StreetEvents.8For variables related to coverage and recognition, I utilize RavenPack Dow Jones Edition for mediacoverage, the International Brokerage Estimates System (IBES) for analyst coverage and the SEC’sserver log database for broad investor recognition. Stock prices, returns, and share counts areobtained from the Center for Research into Security Prices (“CRSP”). Data on stock price, returns,and market liquidity measures for firms listed on both the NYSE and NASDAQ comes from theCenter for Research into Security Prices (“CRSP”). As CRSP does not provide data on firms listedon OTC markets, this limits my sample observations to those periods where the firms maintainprimary exchange listings. Finally, I gather financial reporting information from the Compustatannual fundamentals file.Variable measurementMeasurement of disclosureThis paper employs several measures of disclosure. The first set of measures relates to volumeor frequency. My primary measure is the monthly volume or number of 8-K filing items. TheSEC requires 8-K filings to identify the subject matter to which their content relates using five8 RavenPackcontains press releases from over 28,000 issuers, including more than 5,000 publicly listed US firms(Shroff et al., 2013; Drake et al., 2014). StreetEvents provides a comprehensive dataset of conference calls.9
different headings and 31 different categorizations. Each categorization has a heading and itemnumber (“item”). Cooper et al. (2016) provide guidance to separate 8-K disclosures into thosethat are voluntary in nature, VOLIT EMS, and mandatory in nature, MANIT EMS. In an extensiveanalysis, the authors suggest that Items 2.02 (Results of Operations and Financial Condition), 7.01(Regulation FD) and 8.01 (Voluntary Disclosures) relate to the voluntary disclosure activity offirms.9 The remaining 29 filing items are asserted to be mandatory disclosures. While this measuremay appear to conflate the disclosure of an event with the occurrence of that event, recent studiesprovide considerable evidence that voluntarily disclosed items, as identified by Cooper et al. (2016),provide a robust proxy for voluntary disclosure measured using alternative approaches (Bao et al.,2018; Bouvreau et al., 2018; Nagar et al., 2019).The second set of measures relates to the tone or sentiment of these disclosures. I measure T ONEfollowing the approach of Loughran and McDonald (2011). This measure of T ONE is constructedfor both voluntary disclosures and for mandatory disclosures, and computed as the differencebetween positive and negative words divided by the sum of positive and negative words. To parseT ONE between voluntary and mandatory disclosure, T ONEMAN contains the tone of 8-K filingswhere there are no voluntarily disclosed items. T ONEMAN measures the tone of 8-K filings wherethere is at least one voluntarily disclosed items. While this approach limits the ability to exactlyidentify the tone of individual parts of 8-K filings, precisely measuring the tone contained in exhibitsand attachments referenced within items in 8-K filings and allocating them to specific items isfrequently not plausible, as many such attachments relate to or are referenced by multiple 8-K filingitems.Measurement of coverage and recognitionThis paper also employs a number of measures relating to securities coverage and recognition.There are two measures of stock coverage. Coverage provided by professional financial analysts ismeasured by LNCOV , the logarithm of the number of analysts providing earnings forecasts for the9Afull list of SEC 8-K item numbers is located at html.10
security of interest. Coverage by the financial press or media is measured using LNMEDIACOV ,calculated following Bushee et al. (2010) using RavenPack Dow Jones Edition. This measure ofmedia coverage captures the volume of media articles released by covering press. To ensure therelevance of media articles, all releases with a relevance score provided by RavenPack of less than75 are removed.There are also several measures of the breadth of investor interest and recognition of firm securities.Interest in firm securities from institutional investors is measured by BREADT H, the proportionof 13-F filers holding positions in the security (Lehavy and Sloan, 2008; Richardson et al., 2012).While this captures the level of interest from sophisticated institutional holders, it does not measureinterest from 13-F filing investors who may hold positions in non-compliant firms. Broad investorinterest in firm securities is measured using data from the server access logs of the SEC. The SECrecords each download of disclosure housed on the SEC website. The SEC publicly discloses thelogs of these downloads, which are complete with both masked internet protocal (“IP”) addresses,time stamps, Central Index Keys (“CIKs”), and filing links.10 In recent work, Drake et al. (2019)suggest that these server logs provide a reasonable proxy for the recognition of a broad set ofinvestors, who access SEC filings for the firm following newfound awareness of the stock. Thevariable IPS measures the breadth of this interest by taking the logarithm of the monthly count ofunique IP addresses accessing the filings.11,12Sample constructionThe construction of the non-compliance (or “treatment”) sample begins with the 1,957 instances ofnon-compliance. These observations represent 1,101 individual firms, with many firms receiving10 Whilethe explanation above is focused on brevity, a more thorough explanation can be found in novel research byDrake et al. (2015) and Lee et al. (2015).11 Prior to measuring IPS, the data is cleaned to remove the effect of web crawlers following Lee et al. (2015), whorestrict the data to include only those downloads by IP addresses with less than 50 requested CIKs each day.12 Unlike BREADT H, IPS is not scaled by the total access to server logs as the total number of IP addressesdisplays considerably greater volatility that the number of 13-F filers, creating noise in the measure. The unscaledmeasure, therefore, captures the number of IP addresses accessing firm filings, which I suggest represents the breadth ofownership, as more IP addresses should be strongly related to more investors or other stock followers.11
multiple notices from the exchanges for repeated failures to maintain stock prices above requirements, as shown in Table 1 Panel B. Taking advantage of the 560 separate dates on which firms arenon-compliant, I adopt a sample design approach similar to that used for identification in researchleveraging the staggered adoption of regulatory events (eg. Christensen et al., 2016). For each instance, I identify the month of non-compliance. I then match each treatment observation to potentialcontrol observations drawn from the complete CRSP universe in the month of non-compliance. Thecontrol observations are restricted to firms listed on the NYSE or NASDAQ with stock prices higherthan 1.00 and no history of non-compliance.13 These design choices restrict unobserved marketwide time-correlated or exchange-correlated variation between samples. The non-compliance andcontrol samples are combined and create a window of observation from 12 months before breachto 12 months post-breach, producing a complete sample window of 25 monthly observations. Theresulting data is aligned in “cohorts”, defined as all firm-month observations in the sample centeredon the same month.14For the purposes of empirical testing, I then apply further restrictions. I remove firm-monthsmissing SIC codes or other necessary financial data. Both treatment and control firms must contain12 months of data before (pseudo) non-compliance, and I also remove firms without at least onemonthly observation after breaching MPRs, excluding firms that opt to immediately delist uponnon-compliance. To finalize the sample, all continuous variables are winsorized at the 1% level.The resulting sample is denoted as the “Cohort Sample”.The Cohort Sample contains 3,633,719 firm-month-cohort observations, including 143 distinctcohorts and 690 non-compliant firms. Consistent with the raw data, several firms in this samplebecome non-compliant on more than one occasion, with a total of 1,095 instances of non-compliance.Overall, despite the attrition instances of non-compliance due to data availability, this sample is13 Allcontrol firms also have a stock price of less than 10 in the month of matching. I apply this restriction purelyfor computational purposes. This restriction likely has little impact on the results as firms with stock prices of morethan 10 are not expected to match on the remaining firm characteristics.14 A cohort contains a set of non-compliant and time-matched control firms. For example, if there are five firms thatare identified as non-compliant in January, 2008, these firms are linked to January, 2008 observations for all controlpotential control firms. These firm-month observations (made up of five non-compliant and a much larger sample ofcompliant firms) form a cohort. A similar process is then repeated for firms identified as non-compliant in other months.12
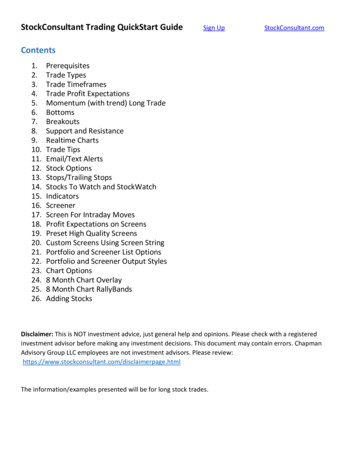
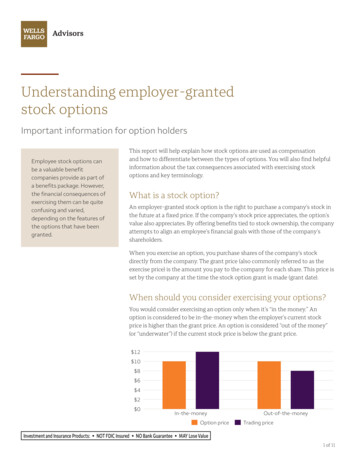
notably larger than those used in prior studies of the consequences of MPRs (Čornanič and Novak,2015).Descriptive statisticsFigure 2 presents the distribution of non-compliance across time from 2004 to 2017, with noncompliance occuring on 560 unique dates. The figure shows a concentration of non-complianceduring 2008 and 2009, as would be expected given the considerable drawdowns in stock pricesthat occured during the period, increase the likelihood of non-compliance. A similar, but smaller,concentration also exists in the years following the recession, indicating continued devaluation ofmany securities.Figure 3 presents the distribution of non-compliance by industry sector. This distribution shows aconcentration of non-compliance in technology and intellectual property intensive firms. Specifically,the manufacture of hardware and software and chemicals and pharmaceuticals represent the largestconcentrations of non-compliance. These sectors are both characterized by large investments inresearch and development and considerable recognized and unrecognized intangible value, possiblysuggestive of high levels of research-driv
managers to engage in stock hype, biasing the release of textual disclosures and quantitative information to encourage stock price appreciation (Aboody and Kasznik, 2000; Nagar et al., 2003; Richardson et al., 2004). However, contrary to methods used for stock hype, I find that tone in 8-K filings is negatively association non-compliance.