Transcription
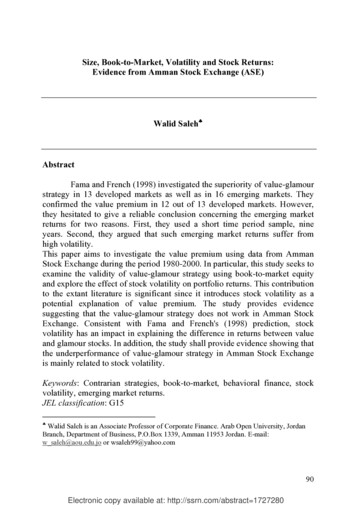
Size, Book-to-Market, Volatility and Stock Returns:Evidence from Amman Stock Exchange (ASE)Walid Saleh AbstractFama and French (1998) investigated the superiority of value-glamourstrategy in 13 developed markets as well as in 16 emerging markets. Theyconfirmed the value premium in 12 out of 13 developed markets. However,they hesitated to give a reliable conclusion concerning the emerging marketreturns for two reasons. First, they used a short time period sample, nineyears. Second, they argued that such emerging market returns suffer fromhigh volatility.This paper aims to investigate the value premium using data from AmmanStock Exchange during the period 1980-2000. In particular, this study seeks toexamine the validity of value-glamour strategy using book-to-market equityand explore the effect of stock volatility on portfolio returns. This contributionto the extant literature is significant since it introduces stock volatility as apotential explanation of value premium. The study provides evidencesuggesting that the value-glamour strategy does not work in Amman StockExchange. Consistent with Fama and French's (1998) prediction, stockvolatility has an impact in explaining the difference in returns between valueand glamour stocks. In addition, the study shall provide evidence showing thatthe underperformance of value-glamour strategy in Amman Stock Exchangeis mainly related to stock volatility.Keywords: Contrarian strategies, book-to-market, behavioral finance, stockvolatility, emerging market returns.JEL classification: G15 Walid Saleh is an Associate Professor of Corporate Finance. Arab Open University, JordanBranch, Department of Business, P.O.Box 1339, Amman 11953 Jordan. E-mail:w saleh@aou.edu.jo or wsaleh99@yahoo.com90Electronic copy available at: http://ssrn.com/abstract 1727280
Walid Saleh - Size, Book-to-Market, Volatility and Stock Returns: Evidence from AmmanStock Exchange (ASE)- Frontiers in Finance and Economics – Vol. 7 No.2 – October 2010, 90 – 124FFE is hosted and managed by SKEMA Business School1 - IntroductionOver the past two decades an extensive body of empirical researchhas provided evidence suggesting that the cross-sectional pattern of stockreturns can be predicted using some value measures such as market value ofequity, book-to-market equity, cash flow yield, earnings-to-price ratio as wellas intrinsic value to price ratio1. Examples are, Fama and French, 1992, 1993,1998; Lakonishok, Shliefer, and Vishny, 1994; Gregory, Harris, and Michou,2001, Cai, 1997; Danial and Titman, 1997; LaPorta, 1996; Jaffe, Keim, andWesterfield, 1989, amongst others.More than one explanation has been introduced to explain thesuperiority of “value” stocks over “glamour” stocks2.Firstly, the risk model, which asserts that value stocks outperform glamourstocks because they are riskier in some aspects (e.g. Fama and French, 1992,1993, 1996). Fama and French proposed a three-factor model to explain thecross-sectional of stock returns. They provided evidence suggesting that theCAPM is unable to explain the cross-sectional returns anymore. Therefore,they modeled two more factors to the market factor: book-to-market equityand size.Secondly, the contrarian model, which assumes that investorsundervalue value stocks whereas they overvalue glamour stocks (e.g.Lakonishok, Shleifer, and Vishny, 1994; Gregory, Harris, and Michou, 2001;and Bulky and Harris, 1997).Thirdly, the superiority of value stocks is attributed to the biasinduced by research design such as survivorship bias and data mining in theselection of the sample (e.g. Lo and Mackinlay, 1990; Kothari, Shanken, andSloan, 1995). Finally, the superiority of value stocks can be interpreted by thebid-ask spread and infrequent trading (e.g. Conrad and Kaul, 1993).1For example, see Saleh and Tucker (2007) in which they constructed portfoliosbased on intrinsic value to price ratio. Where intrinsic value was estimated usingdifferent specifications of the residual income model.2Value (glamour) stocks refer to those stocks that have low (high) price relative tosome measure of their fundamental value.91Electronic copy available at: http://ssrn.com/abstract 1727280
Walid Saleh - Size, Book-to-Market, Volatility and Stock Returns: Evidence from AmmanStock Exchange (ASE)- Frontiers in Finance and Economics – Vol. 7 No.2 – October 2010, 90 – 124FFE is hosted and managed by SKEMA Business SchoolFama and French (1998) undertook a comprehensive study in which theyinvestigated the value strategy for 13 developed markets as well as for 16emerging markets. They found that value stocks outperform glamour stocks intwelve out of thirteen developed markets over the period 1975-1995.However, they were unable to conclude that value premium in emergingmarkets is reliably positive for two reasons3. Firstly, the nine year sampleperiod (1987-1995) was too short. Secondly, they argued that emergingmarket returns suffer from high stock volatility. Amman Stock Exchange(ASE) had been one among those emerging markets that were investigated byFama and French (1998). Their results for ASE showed that high (low) bookto-market stocks earn 0.0146 (-0.029) and that small stocks outperform largestocks by 0.0125; 0.0237 against 0.0113.This paper investigates the ability of book-to-market equity and sizeto explain the cross-sectional stock returns using data from ASE over theperiod 1980-2000. In particular, this study aims to explore the superiority ofvalue stocks. Furthermore, this study seeks to solve the main two problemsraised by Fama and French (1998) concerning emerging market returns, thesample period and stock volatility.Thus, this paper contributes to the extant literature by introducingstock volatility as a potential explanation of value premium, especially foremerging market returns.It is found that the value-glamour strategy does not work in ASE andthat small stocks deliver higher returns than large stocks but the difference isnot significant. Consistent with Fama and French’s (1998) prediction, stockvolatility helps in explaining the difference in returns between value stocksand glamour stocks. Furthermore, evidence is provided to suggest that theunderperformance of the value-glamour strategy is mainly related to stockvolatility. Therefore, it is concluded that small and high book-to-marketstocks outperform small and low book-to-market stocks because returns of thefirst are more volatile than those of the latter, whilst large and high book-tomarket under-perform large and low book-to-market stocks because returns ofthe first are more volatile than those of the latter. Thus, large and low book-tomarket stocks deliver higher returns. Moreover, the results assert that stock3Note that Chen and Zhang (1998) documented that value stocks deliver reliablyhigher returns in the US, Japan, Malaysia, and Hong Kong, their results for Taiwanand Thailand did not assert the value premium.92
Walid Saleh - Size, Book-to-Market, Volatility and Stock Returns: Evidence from AmmanStock Exchange (ASE)- Frontiers in Finance and Economics – Vol. 7 No.2 – October 2010, 90 – 124FFE is hosted and managed by SKEMA Business Schoolvolatility should be modeled as a risk factor over the one-year period. Forexample, it is found that high volatility stocks deliver higher returns than lowvolatility stocks over a one-year period, and this difference is significant atless than 10% level, on an average. Splitting the sample into different marketconditions shows that stock volatility has no effect on small stocks in upmarket states, whilst it has a significant effect on large stocks, particularly onthe low book-to-market stocks. In down market conditions, the results showthat stock volatility has a significant effect on small and high book-to-marketstocks as well as on large and low book-to-market stocks.This paper is organized as follows: Section 2 introduces the relatedliterature whilst Section 3 describes the data and methodology. Section 4examines the difference in returns between value and glamour stocks. Section5 summarizes and concludes.2 - Literature ReviewFama and French (1993, 1995, and 1996) argued in favour of“rational investment” behaviour in the explaination of the value premium.They argued that value stocks outperform glamour stocks because valuestocks are fundamentally riskier in some aspects than glamour stocks. Famaand French (1992) found that size (market value of equity) and the ratio ofbook equity to market equity capture much of the cross-section of averagestock returns. They argued that if stocks are priced rationally, systematicdifferences in average return are due to differences in risk, then size and thebook-to-market ratio must proxy for sensitivity to common risk factors inreturns.However, Lakonishok, Shleifer, and Vishny (1994) argued in favourof “irrational explanation”. Under this strategy, investors investdisproportionately (over-invest) in stocks that are under-priced and underinvest in stocks that are overpriced. For instance, investors assume that stocksthat have done very well in the recent past will continue to do so, thus theybuy them up. Consequently, these stocks become overpriced. Likewise,investors assume that stocks that have done poorly in the recent past willcontinue to do so, thus, they oversell them. As a result, these “out-of-favour”stocks become under-priced. Thus, value stocks refer to stocks that have a lowprice relative to some measure of their fundamental value, while growth orglamour stocks refer to stocks that have high price relative to some measureof their fundamental values.93
Walid Saleh - Size, Book-to-Market, Volatility and Stock Returns: Evidence from AmmanStock Exchange (ASE)- Frontiers in Finance and Economics – Vol. 7 No.2 – October 2010, 90 – 124FFE is hosted and managed by SKEMA Business SchoolFama and French (1998) found that value stocks outperform glamour(growth) stocks in twelve out of thirteen developed markets. Cai (1997)documented the same result for the Tokyo stock market. While recentresearch shows that “out-of-favour” (value) stocks earn higher returns thanglamour stocks in most international markets (e.g. the U.S., the UK, Japan,Germany, Italy, the Netherlands, Belgium, Australia, Hong Kong, Singapore,among others, and some emerging markets), the underlying reasons for thissuperiority remain debatable.Overall, most empirical studies documented a robust value premiumthat is both economically and statistically significant for most developedmarkets. However, Spyrou and Kassimatis (2006) argued that previous studiesdrew their conclusions based on long-term averages and overlooked the yearby-year stability of the effect. Therefore, they examined the year-by-yearreturn performance and stability of value-glamour investment strategy fortwelve European markets. Overall, they provided evidence suggesting that thevalue premium is driven by few years where HML returns are high andsignificant. Furthermore, they found that historical betas for value andglamour portfolios vary significantly over time and that value portfolio betasare not always smaller than glamour portfolio betas.Ang and Chen (2005) examined the value premium over the period1926-1963. They provided evidence suggesting that the value premium iscaptured by the CAPM. Furthermore, they argued that even the post-1963period produces no reliable evidence against a CAPM story for the valuepremium, when the tests allow for time-varying market betas. Loughran(1997) showed that the value premium of 1963-1995 is restricted to smallstocks.Fama and French (2006) showed that Loughran’s (1997) evidence isspecial to 1963-1995, U.S. stocks, and the book-to-market value-glamourindicator. Further, they showed that Agn and Chen’s (2005) evidence isspecial to 1926-1963. Thus, the CAPM’s problem is that variation in betaunrelated to size and value-glamour goes unrewarded throughout 1926-2004.This produces rejections of the model for 1926-1963 and 1963-2004.94
Walid Saleh - Size, Book-to-Market, Volatility and Stock Returns: Evidence from AmmanStock Exchange (ASE)- Frontiers in Finance and Economics – Vol. 7 No.2 – October 2010, 90 – 124FFE is hosted and managed by SKEMA Business SchoolIn another series of studies, extant research investigates whether theprofitability of HML, SMB and WML4 can be linked to future GDP growth(e.g. Liew and Vassalou, 2000; Vassalou, 2000; and Gregory, Harris andMichou, 2003). In general, Liew and Vassalou (2000) and Vassalou (2000)indicated that news related to future GDP growth explains the cross-section ofequity returns. However, Gregory, Harris and Michou (2003) providedevidence suggesting that there is no correlation between value strategy returnsand future GDP growth once HML and SMB are included as risk factors.Liew and Vassalou (2000) aimed to investigate whether theprofitability of HML, SMB, and WML can be linked to future GDP growth.They used data from ten developed countries to conduct their analysis5. Theirresults confirmed those in Fama and French (1998) that the value premium ispervasive. They found that the returns of HML are higher when the portfoliosare rebalanced more frequently. SMB produces positive returns in allcountries except Switzerland. Furthermore, they examined the returns onHML, SMB, and WML at different states of future economic growth. Theirresults showed that the returns on HML and SMB are positively related tofuture growth in the macro economy. High portfolio returns precede periodsof high GDP growth. Likewise, low portfolio returns are associated with lowfuture GDP growth.In the UK, Gregory, Harris and Michou (2003) examined therelationship between the returns to value investment strategies and variousmacroeconomic state variables that in a multi-factor asset pricing model couldbe taken as proxies for risk. Further, they investigated whether the returns tovalue strategies predict future GDP, consumption and investment growth overand above the contribution of the Fam
Size, Book-to-Market, Volatility and Stock Returns: Evidence from Amman Stock Exchange (ASE) Walid Saleh Abstract Fama and French (1998) investigated the superiority of value-glamour strategy in 13 developed markets as well as in 16 emerging markets. They confirmed the value premium in 12 out of 13 developed markets. However, they hesitated to give a reliable conclusion concerning the emerging .

