Transcription
Easy Volatility InvestingTony Cooper1Double-Digit NumericsFebruary 2013AbstractFor many decades the only way to invest in volatility has been through trading options, futures, orvariance swaps. But in recent years a number of volatility-related exchange traded Funds (ETFs) andExchange Traded Notes (ETNs) have been launched which make volatility trading accessible to theretail investor and fund managers without the need to access futures markets. Our objective is to devise atrading strategy using them.We document where volatility returns come from, clearing up some misconception in the process. Thenwe illustrate five different strategies that will appeal to different investors. Four of the strategies aresimple to describe and implement. All of the strategies have had extraordinary returns with high SharpeRatios and low correlation to the S&P500, in some cases negative correlation. The returns seems to betoo good to be true – like picking up 100 bills in front of a steamroller – so we have a detaileddiscussion on the risks and the nature of the steamroller.We illustrate how these strategies can be incorporated into existing portfolios to reduce portfolio riskespecially in times of crisis. They have positive exposure to the markets during good times and negativeexposure during bad times. Unfortunately they do not always provide absolute returns and whilereducing net portfolio drawdowns they can themselves have significant drawdowns. Still, we suggestthat a traditional 60% equities, 40% bonds portfolio should be adjusted to 55% equities, 35% bonds, and10% volatility.This is primarily an expository paper which explains concepts that are quite simple. So we omit formaltechnicalities such as bootstrap, robustness, statistical, and stress tests and leave out mathematics apartfrom some interesting notes that we confine to an optional technical appendix. The investing strategiesare very easy to apply and the (optional reading) discussions of the mechanics of the futures marketsbelies their simplicity.JEL classification: C32; C53; G11; G12; G13Keywords: Volatility trading; Futures pricing; Volatility Risk Premium; Roll yield; Momentum1. IntroductionIn order to create a long term volatility trading strategy for inclusion into an investment portfolio weseek to use three intriguing and enticing stylized facts about stock market volatility:1) Stock market volatility, unlike returns, is predictable2) Changes in volatility are negatively correlated with changes in market prices1email: tonyc@ddnum.com1
3) Investors are prepared to pay us a premium (the Volatility Risk Premium) for us to take volatilityrisk off their handsIn other words, we want to consider investing in volatility as an asset class.The structure of this paper is as follows:We discuss the lure of volatility and demonstrate this by simulating a mean-reversion trading strategy onthe VIX which produces 215% annualized returns. Then we hint at the profitability of an ExchangeTraded Note (ETN) with ticker XIV. But before we can feel safe trading it we must explain where thereturns come from.It is the volatility risk premium (VRP) which provides our returns. We provide convincing evidence thatthe VRP exists in the options market. But the volatility ETNs that we are interested in result fromtrading the VIX futures markets so we must test to see if the VRP exists there also.But the futures market has a complication – there is a concept called roll yield that people mistake forthe VRP and treat as a free lunch. It is important to clear up the misconception because we can earnmore return by chasing the VRP rather than roll yield. The VRP is not a free lunch because earning thepremium requires taking on volatility risk.Then we introduce the four Exchange Traded Notes that make up our volatility trading toolbox. Weexplain the dynamics of one of these notes – the XIV. We show how its changes relate to the VIXchanges with the important point that even though there is a regression formula between the two theXIV does not have the mean-reversion predictability of the VIX. This is because the futures market hasthe predictability already built into the prices.For the purpose of studying risk closely we divide the history of our ETNs into five risk regimes, one ofwhich includes the Global Financial Crisis (GFC). It is interesting that these volatility regime changesactually predated the GFC by a few months and may have been a harbinger of the crisis to come.Then we develop four different methods in order of increasing complexity for trading our ETNs (andhint at a fifth). The different methods are suited to different investors and also provide a consistency ofreturns that gives us some extra confidence that volatility trading works. The simplest strategy is buyand hold and the most complicated uses just a moving average of historical volatility. All strategies canbe calculated in a simple spreadsheet.The investing strategies are very easy to apply and the discussions of the mechanics of the futuresmarkets belies their simplicity. It is possible to trade them without understanding the futures markets atall.We devote significant attention to the risks of the strategies, particularly the risk of being run over by thesteamroller. The risks are the usual market risks (such as liquidity) plus the following volatility-specificrisks: (i) volatility drag, (ii) timing synchronization risk, (iii) VRP-roll yield convergence risk, (iv)regime change risk, and (v) steamroller risk. We conclude with the finding that being run over by thesteamroller isn’t so bad after all.Due to the low (and often negative) correlation of the strategies with the S&P500 we look at how thestrategies can be used to boost returns and lower volatility in existing portfolios. We give examples ofhow combining volatility strategies with stocks (AAPL) or with the S&P500 or with bonds reduces the2
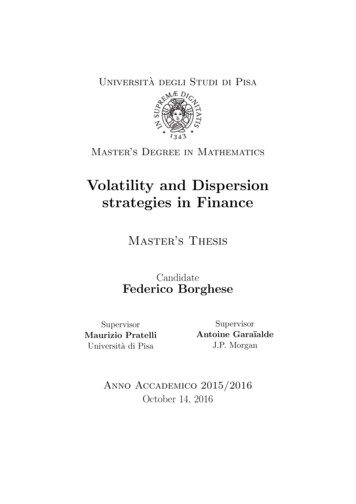
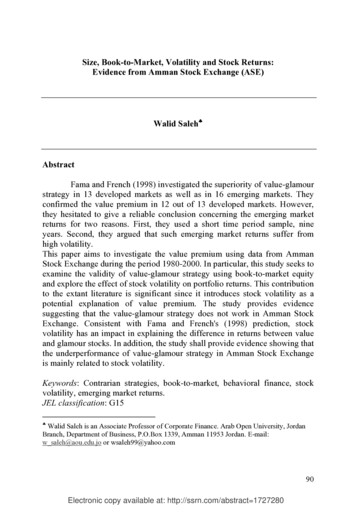
maximum drawdown and improves the Sharpe Ratio of each. We reduce the AAPL maximumdrawdown of 55% to only 36%. Even a small allocation of 10% of a bond portfolio to volatility canboost the Sharpe Ratio from 1 to 2.2We conclude with a summary and suggestions for which types of investor the strategies will appeal to.The methodology (and the ETNs) are in their infancy and we offer suggestions for future research.Finally, an optional 6-page technical appendix not part of the paper is provided as a reference for someof the dynamic concepts in the paper.2. The Lure and Intrigue of VolatilityThe VIX is the Chicago Board Options Exchange Market Volatility Index, CBOE (2009). It is an indexthat is, in some sense, a measure of the market’s expectation of the average volatility over the next 30days. It is not a measure of the current volatility in the market although, as we shall see, it is related.Since market volatility (from fact 1) is quite predictable the VIX is quite predictable. It tends to be meanreverting which means that extreme values are more likely to be followed by less extreme values.As proof of the predictability a simple mean-reversion trading strategy based on moving averagecrossovers2 produces the results shown in the equity curve in Figure 1 (left). The annualized return forthe strategy has been 215% since 1990.Figure 1VIX Short Term Mean Reversion Trading Equity CurveDynamic Correlation between S&P500 changes and VIX changes 0.2100,000,000,00010,000,000,000 0.31,000,000,000 0 0.5 0.610,000 0.71000100 0.81011990 1992 1994 1996 1998 2000 2002 2004 2006 2008 2010 2012 0.919901995200020052010The return is considerable but since the VIX is not tradable the return is not realizable.Related to the VIX is the VXV, the CBOE S&P 500 3-Month Volatility Index. This is, in some sense, ameasure of the market’s expectation of the average volatility over the next three months (rather than onemonth for the VIX). The ratio VXV / VIX is more important to us than the VXV itself.Besides the predictability of the VIX the second lure is that changes in the VIX are negatively correlatedwith changes in the S&P500. This means that, were it possible, a long position in the VIX, provided itgenerated positive returns, would provide useful portfolio diversification. Figure 1 (right) shows the2Go long when the VIX crosses below the 11 day simple moving average, else go short3
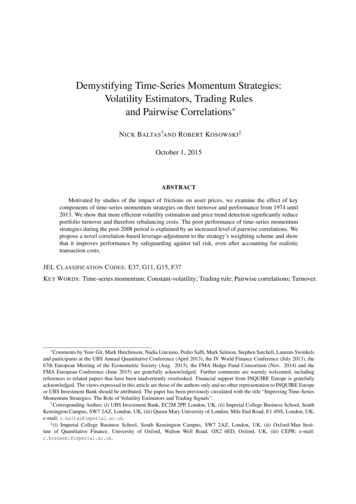
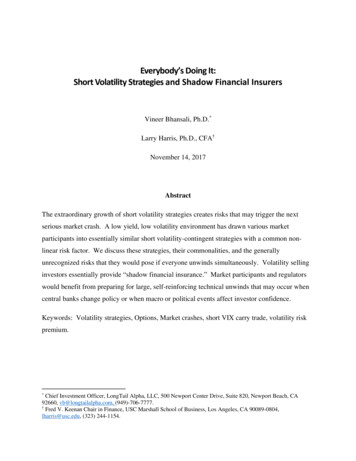
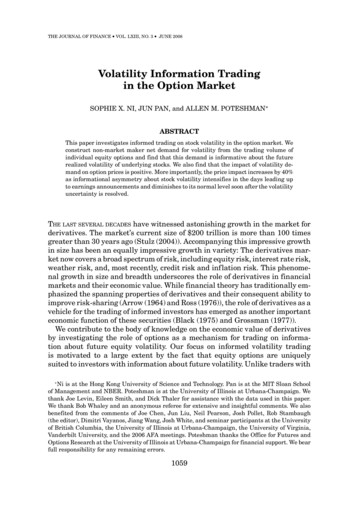
changing correlation between VIX changes and S&P500 changes calculated using the DynamicConditional Correlation (DCC) method (Engle, 2009) which avoids the lag that arises from using rollingwindows. Not only is the correlation negative, it seems to be more negative during recent crises. Thatcould be useful.As a further lure we reproduce the chart from Yahoo! in Figure 2. It shows an exchange traded note XIVwhich tracks inverse volatility compared to the VIX. We note that while the VIX ends up roughly whereit started and XIV inversely tracks VIX changes XIV ends up 40% higher than it started. We ask why?And can this be exploited for good returns? 40% gain over six months is indeed a lure.Figure 23. The Volatility Risk PremiumIn order to earn higher returns than the risk-free rate investors must (by definition) take on some risks.The extra returns that taking on these risk provide are call risk premia. The most famous, perhaps, is theequity risk premium which is the excess return that the stock market provides over a risk-free rate.Ilmanen (2011) has a chapter on each of twelve different risk premia. Presumably a well diversifiedportfolio would be exposed to each of the twelve as they are not 100% correlated with each other.It should be noted that exploiting risk premia is not the same as exploiting market inefficiencies. We willsee later that the market incorrectly prices volatility. But this is not an inefficiency, it is simply apremium for risk.The premium that we seek to exploit is the Volatility Risk Premium (VRP) which is the premium that aninvestor in some asset pays to reduce exposure to the volatility of the future returns of that asset. In otherwords, the price hedgers are prepared to pay to speculators to offload price risk. In our case the asset isthe S&P500 index.The VRP is reflected in S&P500 options by options being overpriced. Sellers of these options (who areessentially “selling volatility”) receive the VRP through these higher prices. Now the VIX is a measureof the “implied” volatility of these options therefore the VIX is too high compared to where it should beif it were an unbiased predictor of future S&P500 volatility.In a nutshell the VIX overpredicts the S&P500 volatility and this overprediction represents the VRP.4
This is easily seen in Figure 3 (left). The red line is the VIX which is a predictor of the mean volatilityover the next 30 calendar days. The blue line is the mean realized volatility that resulted on the 30 dayssubsequent to the VIX reading. It is evident that the VIX overestimates the realized volatility.Figure 3VIX (red) and Subsequent S&P500 30 day Mean Realized Volatility (blue)90VIX30d RV80Estimate of Volatility Risk Premiumlog VIX minus Subsequent log Realised 40.20 0.2 0.4 0.6 0.8199020101995200020052010The difference between the red and blue lines is an estimate of the VRP. We use differences of the logof the volatility in Figure 3 (right). (Use of logs reduces spikes in the numbers.)It is evident that the VRP is mostly positive but sometimes negative. We note that in periods of highvolatility the predictions underestimate the VIX and so the volatility risk premium is negative. At thosetimes we will need to reverse our positions in order to collect the premium.Ilmanen (2011) explains that collecting the VRP is quite lucrative but looks more lucrative than it reallyis because of the “peso problem.” Rather than the peso term we prefer the term “picking up 100 bills infront of a steamroller.”The problem is that returns look good in any period that does not have a visiting steamroller in it. Thegood returns should really be moderated for the probability of the steamroller. But in our case we werefortunate to have a steamroller arrive in the form of the Global Financial Crisis (GFC) during ourbacktesting period.4. VIX Futures MarketWe cannot trade the VIX directly but there is an active and liquid futures market for it and this isaccessible to retail investors in the form of Exchange Traded Products (ETPs). To understand theseETPs it helps to understand the futures market somewhat.VIX futures can be regarded in some sense (ignoring the VRP, various cash flows, dividends and cost ofmoney effects) as a form of prediction or “bet” on where the VIX will close on the day they expire andare settled. The VIX futures price reflects the market participants’ best collective guess as to what theVIX index will be at settlement.The bets can be long or short. For example, if you buy a long contract3 today at price 16 and the VIX is 18 at settlement then you gain 2. If your bet was short then you would lose 2. For every long bet3Note that CBOE Mini-VIX Futures trade at VIX times 100. We assume the value of 1 here for simplicity5
there is a short bet (a zero sum game) which is why the contract price represents the best collectiveguess.Figure 4 (left) shows the spot VIX (at Days 0) and eight VIX futures predictions (contracts) as theywere priced at the close on 21 March 2012. This chart is called the term structure. The first red dot onthe left shows the actual VIX closed at about 15. The remaining red dots show the eight futures contractprices at various days till settlement4. Contracts are spaced a month apart.Figure 4VIX Futures Contango as at 21 Mar 2012VIX Futures Backwardation as at 03 Oct 0100150Days till settlement20026250050100150Days till settlement200250It is evident that market participants predicted the VIX to rise over the next 250 days. When the termstructure is rising it is called conta
Keywords : Volatility trading; Futures pricing; Volatility Risk Premium; Roll yield; Momentum 1. Introduction In order to create a long term volatility trading strategy for inclusion into an investment portfolio we seek to use three intriguing and enticing stylized facts about stock market volatility: 1) Stock market volatility, unlike returns, is predictable 2) Changes in volatility are .