Transcription
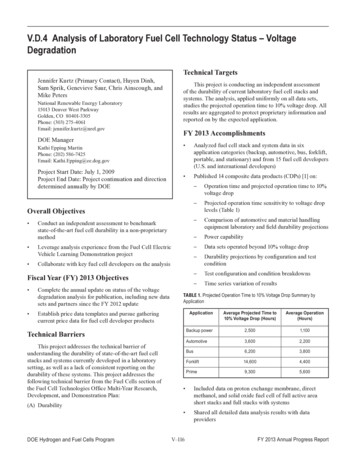
V.D.4 Analysis of Laboratory Fuel Cell Technology Status – VoltageDegradationJennifer Kurtz (Primary Contact), Huyen Dinh,Sam Sprik, Genevieve Saur, Chris Ainscough, andMike PetersNational Renewable Energy Laboratory15013 Denver West ParkwayGolden, CO 80401-3305Phone: (303) 275-4061Email: jennifer.kurtz@nrel.govDOE ManagerKathi Epping MartinPhone: (202) 586-7425Email: Kathi.Epping@ee.dog.govProject Start Date: July 1, 2009Project End Date: Project continuation and directiondetermined annually by DOETechnical TargetsThis project is conducting an independent assessmentof the durability of current laboratory fuel cell stacks andsystems. The analysis, applied uniformly on all data sets,studies the projected operation time to 10% voltage drop. Allresults are aggregated to protect proprietary information andreported on by the expected application.FY 2013 Accomplishments Analyzed fuel cell stack and system data in sixapplication categories (backup, automotive, bus, forklift,portable, and stationary) and from 15 fuel cell developers(U.S. and international developers) Published 14 composite data products (CDPs) [1] on:Overall Objectives Conduct an independent assessment to benchmarkstate-of-the-art fuel cell durability in a non-proprietarymethodLeverage analysis experience from the Fuel Cell ElectricVehicle Learning Demonstration projectCollaborate with key fuel cell developers on the analysisFiscal Year (FY) 2013 Objectives Complete the annual update on status of the voltagedegradation analysis for publication, including new datasets and partners since the FY 2012 update Establish price data templates and pursue gatheringcurrent price data for fuel cell developer products(A) DurabilityDOE Hydrogen and Fuel Cells ProgramOperation time and projected operation time to 10%voltage drop––Projected operation time sensitivity to voltage droplevels (Table 1)––Comparison of automotive and material handlingequipment laboratory and field durability projections––Power capability––Data sets operated beyond 10% voltage drop––Durability projections by configuration and testcondition––Test configuration and condition breakdowns––Time series variation of resultsTable 1. Projected Operation Time to 10% Voltage Drop Summary byApplicationApplicationTechnical BarriersThis project addresses the technical barrier ofunderstanding the durability of state-of-the-art fuel cellstacks and systems currently developed in a laboratorysetting, as well as a lack of consistent reporting on thedurability of these systems. This project addresses thefollowing technical barrier from the Fuel Cells section ofthe Fuel Cell Technologies Office Multi-Year Research,Development, and Demonstration Plan:––Average Projected Time to10% Voltage Drop (Hours)Average Operation(Hours)Backup rklift14,6004,400Prime9,3005,600 Included data on proton exchange membrane, directmethanol, and solid oxide fuel cell of full active areashort stacks and full stacks with systems Shared all detailed data analysis results with dataprovidersV–116FY 2013 Annual Progress Report
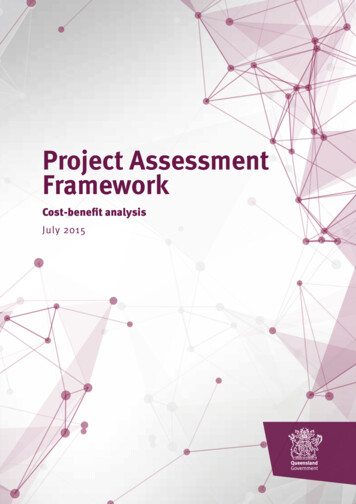
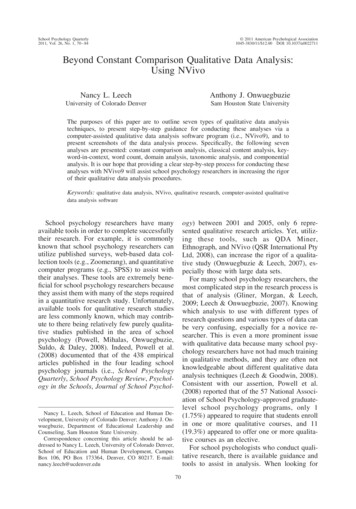
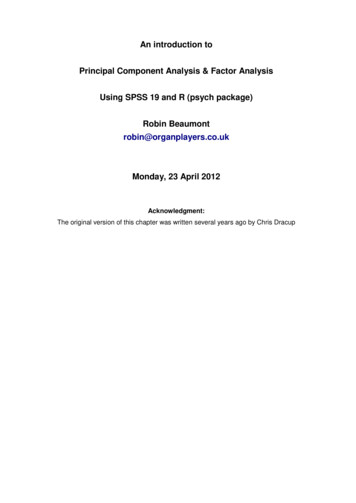
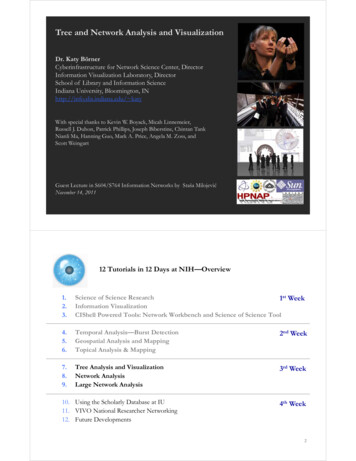
V.D Fuel Cells / Degradation StudiesKurtz – National Renewable Energy LaboratoryGGGGGIntroductionThe U.S. Department of Energy (DOE) has fundedsignificant research and development activity withuniversities, national laboratories, and the fuel cell industryto improve the market competitiveness of fuel cells.Most of the validation tests to confirm improved fuel cellstack performance and durability (indicators of marketcompetitiveness) are completed by the research organizationsthemselves. Although this allows the tests to be conducted bythe developers most familiar with their specific technology,it also presents a number of challenges in sharing progresspublicly because test conditions and data analysis take manyforms and data collected during testing are often consideredproprietary.The National Renewable Energy Laboratory (NREL)is benchmarking the state-of-the-art fuel cell performance,specifically focusing on durability, through independentassessment of current laboratory data sets. NREL’sdata processing, analysis, and reporting capitalize oncapabilities developed in DOE’s Fuel Cell Electric VehicleLearning Demonstration. Fuel cell stack durability statusis reported annually and includes a breakdown of statusfor different applications. A key component of this projectis the collaborative effort with key fuel cell developers tounderstand what is being tested in the laboratory, studyanalysis results, and expand the included data sets.ApproachThe project involves voluntary submission of data fromrelevant fuel cell developers. NREL is contacting fuel celldevelopers for multiple fuel cell types to either continue orbegin a data sharing collaboration. A continuing effort is toinclude more data sets, types of fuel cells, and developers.Raw and processed data are stored in NREL’s HydrogenSecure Data Center. Processing capabilities are developedor modified for new data sets and then included in theanalytical processing of NREL’s Fleet Analysis Toolkit. Theincoming raw data may be new stack test data or they maybe a continuation of data that have already been suppliedto NREL. After the raw data are processed, the results areanalyzed with particular attention to durability and operatingconditions. Each individual data set has a set of data figuresthat are shared with the data provider and used to create theCDPs. CDPs are designed to report on the technology statuswithout revealing proprietary information.ResultsThis fuel cell stack durability analysis expanded thenumber of data sets analyzed, applications and fuel cell typesFY 2013 Annual Progress Reportstudied, and amount of details published. Results publishedin April 2013 were the fifth update for this analysis effort.The annual voltage degradation analysis of state-of-theart laboratory durability was completed in advance of themilestone to provide an update that could be presented at theDOE’s Annual Merit Review. In the current published data set,six applications were covered, 15 fuel cell developers supplieddata (more than one data set in many cases), and the data setscovered proton exchange membrane, direct methanol, andsolid oxide fuel cell stack testing. A total of 98 data sets havebeen analyzed. Note that a data set represents a short stack,full stack, or system test data. Of the total data sets, 78% havebeen retired (Figure 1), meaning the system or stack is notaccumulating any new operation hours either because of testcompletion, technology upgrades, or failures. The publisheddata results include eight CDPs. The power capabilityillustrates the range of fuel cell power for the data sets byapplication from 2 kW to 50 kW. Most of the analyzed datasets are laboratory systems at less than 14 kW power.The analyzed data sets are from laboratory testing offull active area short stacks (e.g., stacks with fewer cells thanthe expected full power stack) and test systems with fullpower stacks. The data sets also vary from one to the otherin how the stack/system was tested. Data were generatedbetween 2004 and late 2012 from different testing methodsthat included constant load, transient load, and acceleratedtesting. The variability in test conditions and test setupscreated a group of data that can be difficult to compare.Additional breakdown of the data sets is an important aspectof future work and is dependent on the accumulation of moredata sets in order to not reveal an individual data supplier’scontribution to the results or proprietary data.Fuel cell durability is studied at a design-specific currentpoint and measured against a target of 10% voltage drop frombeginning of life. The 10% voltage drop metric is used forassessing voltage degradation with a common measurement,but the metric may not be the same as end-of-life criteriaand does not address catastrophic failure modes. Figure 2is an aggregated set of results separated by application andidentifies the percentage of short stacks and how many datasets are still operating (at the time of the results) for eachapplication. Each application has the average, maximum,and 25th and 75th percentile values identified for the operationhours and the projected hours to 10% voltage drop.The 10% voltage drop level is not necessarily ameasurement for end of life or even a significant reductionin performance. Many data sets have not passed (or did notpass) the metric of 10% voltage degradation. The reasondata sets operated beyond 10% voltage degradation could bebecause end-of-life criteria may be greater than 10% voltagedegradation or because the test was designed to operateuntil a failure occurred. The stack configuration and testconditions can have a significant impact on the projected timeto 10% voltage degradation within an application. In general,V–117DOE Hydrogen and Fuel Cells Program
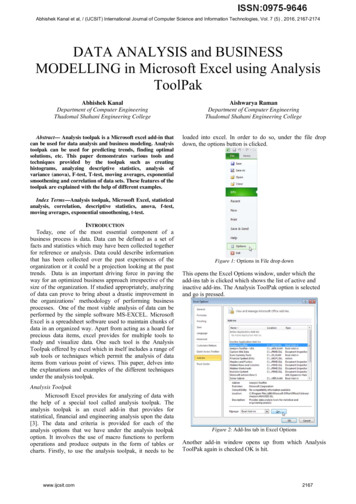
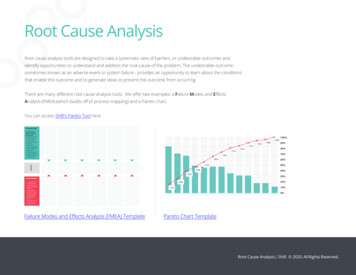
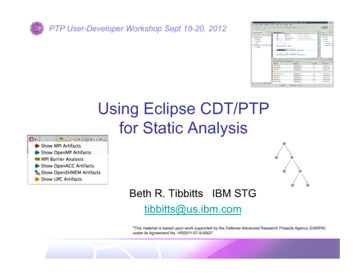
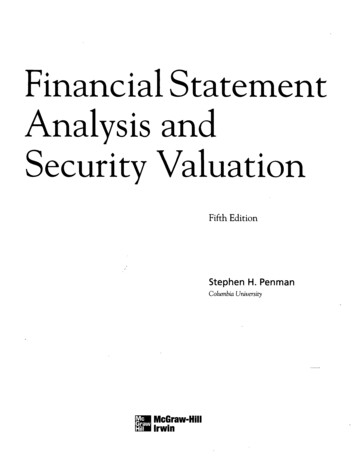
V.D Fuel Cells / Degradation Studies300Cumulative Lab Data Operation Hours and Dates100Backup Op HrsAuto Op HrsBus Op HrsForklift Op HrsPrime Op HrsActive Data SetsInactive Data Sets8002008NREL cdp lab 04Created: Mar-21-13 8:58 PM200912/2009 CDPs105/2009 CDPs5006/2010 CDPs11006040Data Set Count07/2011 CDPs115003/2012 CDPs103/2013 CDPs12001Operation Hours [1,000]250Kurtz – National Renewable Energy Laboratory20201020112012201301) Data set count at publication of a CDP set - where a data set represents a short stack, full stack, or system test data.Figure 1. Cumulative Lab Data Operation Hours and DatesFigure 2. Operation Hours and Projected Hours to 10% Voltage Drop by Application Categorythe average projection decreases with more aggressive testconditions and full systems (Figure 3). Not all applicationshave data sets in each configuration or test condition group.The test condition groups include: Steady – little or no change to load profile Duty Cycle – load profile mimics real-world operatingconditionsDOE Hydrogen and Fuel Cells Program Accelerated – test profile is more aggressive than realworld operating conditions.Most applications have seen an increase in averagetime to 10% voltage degradation over the last three years(Figure 4). Averages may decrease from year to year basedon new data sets added and varied test conditions andconfigurations. Another possible reason for changes year-V–118FY 2013 Annual Progress Report
V.D Fuel Cells / Degradation StudiesKurtz – National Renewable Energy Laboratoryj22000ggygAverage -PrimeAverage -ForkliftAverage -AutomotiveAverage -BackupProjected Hours to 10% Voltage 00400020000AllShort StackFull StackSystemConfigurations, All Test ConditionsSteadyDuty CycleAcceleratedTest Conditions3, All Configurations1) The DOE 10% voltage degradation metric is used for assessing voltage degradation;it may not be the same as end-of-life criteria and does not address catastrophic failure modes.2) Not all applications have data sets in each configuration or test condition group.3) Steady - little or no change to load profileDuty Cycle - load profile mimics real-world operating conditionsAccelerated - test profile is more aggressive than real-world operating conditionsNREL cdp lab 08Created: Apr-01-13 1:42 PMFigure 3. Projected Hours to 10% Voltage Drop by Configuration and Test ConditionAverage Projected Hours to 10% Voltage Drop181,216Projected Hours REL cdp lab 10Created: Apr-01-13 2:32 PM20102011Year20122013(1) The DOE 10% voltage degradation metric is used for assessing voltage degradation; it may not be the same as end-of-life criteria and doesnot address catastrophic failure modes.(2) At least 13 fuel cell developers supplied data, including international. Analysis is updated periodically.Figure 4. Average Projected Hours to 10% Voltage Degradation by Year and Application GroupFY 2013 Annual Progress ReportV–119DOE Hydrogen and Fuel Cells Program
V.D Fuel Cells / Degradation StudiesKurtz – National Renewable Energy Laboratoryto-year (particularly when the average decreases) is fuel celldevelopment is focusing on multiple performance metricsthat include durability, cost reduction, and efficiency. A testconfiguration may have been based on improvements in anarea other than durability, with a small negative impact ondurability. Development that focuses on more than one area(such as durability and cost reduction) is actually a statementon how far the technology has progressed. The research is notjust focused on durability solutions. An up and down trend ofaverage durability in an application from the past few yearsrepresents the degree of integration amongst the highestpriority research topics. In addition, there are continuedneeds for the technology that is capable of meeting both costand durability targets.Conclusions and Future DirectionsFY 2013 Publications/Presentations1. Kurtz, J., Dinh, H., “Fuel Cell Technology Status AnalysisProject: Partnership Opportunities,” Fact sheet describingopportunities for industry to participate in NREL’s fuel celltechnology performance, durability, and price analysis. (June 2013)2. Kurtz, J., Dinh, H., Sprik, S., Saur, G., Ainscough, C.,Peters, M., “Fuel Cell Technology Status – Voltage Degradation,”Presented at the 2013 Annual Merit Review and Peer EvaluationMeeting, Washington, D.C. (May 2013)3. Kurtz, J., Dinh, H., Sprik, S., Saur, G., Ainscough, C., Peters,M., “State-of-the-Art Fuel Cell Voltage Durability Status: Spring2013 Composite Data Products.” (May 2013)References1. http://www.nrel.gov/hydrogen/proj fc analysis.htmlThis project has leveraged other technology validationprojects and existing industry relationships to steadilyincrease the quantity and depth of reporting on the stateof-the-art fuel cell durability status with a relatively lowinvestment from DOE. U.S. and international developers havevoluntarily supplied at least one data set, and it is an ongoingeffort to include new data sets, update data sets alreadyincluded (if applicable), and include new fuel cell developers,applications, and types. The voluntary participation ofleading fuel cell developers showcases the fuel cell durabilityimprovements with the current technology and provides anoverall technology benchmark (with the published aggregateddata) and an individual developer benchmark (with thedetailed data products). The data are fully integrated intoFleet Analysis Toolkit, and an online interface providesinformation on the project, contact information for interestedcollaborators, and all publications. The published resultsfrom April 2013 are the fifth update and were completedahead of the milestone requirement with many new data setsand results. Future work includes the following: Continue cultivating existing collaboration anddeveloping new collaborations with fuel cell developers Gathering, processing, and reporting on current fuel cellproduct cost and/or priceDOE Hydrogen and Fuel Cells ProgramV–120FY 2013 Annual Progress Report
The 10% voltage drop level is not necessarily a measurement for end of life or even a significant reduction in performance. Many data sets have not passed (or did not pass) the metric of 10% voltage degradation. The reason data sets operated beyond 10% voltage degradation could be because end-of-life criteria may be greater than 10% voltage