Transcription
Ann Surg Oncol (2014) 21:2971–2980DOI 10.1245/s10434-014-3728-0ORIGINAL ARTICLE – ENDOCRINE TUMORSPancreastatin Predicts Survival in Neuroendocrine TumorsScott K. Sherman, MD1, Jessica E. Maxwell, MD, MBA1, M. Sue O’Dorisio, MD, PhD2, Thomas M. O’Dorisio, MD3,and James R. Howe, MD1Department of Surgery, University of Iowa Carver College of Medicine, Iowa City, IA; 2Department of Pediatrics,University of Iowa Carver College of Medicine, Iowa City, IA; 3Department of Internal Medicine, University of IowaCarver College of Medicine, Iowa City, IA1ABSTRACTBackground. Serum neurokinin A, chromogranin A,serotonin, and pancreastatin reflect tumor burden in neuroendocrine tumors. We sought to determine whether theirlevels correlate with survival in surgically managed smallbowel (SBNETs) and pancreatic neuroendocrine tumors(PNETs).Methods. Clinical data were collected with InstitutionalReview Board approval for patients undergoing surgery atone center. Progression-free (PFS) and overall (OS) survival were from the time of surgery. Event times wereestimated by the Kaplan–Meier method. Preoperative andpostoperative laboratory values were tested for correlationwith outcomes. A multivariate Cox model adjusted forconfounders.Results. Included were 98 SBNETs and 78 PNETs.Median follow-up was 3.8 years; 62 % had metastaticdisease. SBNETs had lower median PFS than PNETs (2.0vs. 5.6 years; p \ 0.01). Median OS was 10.5 years forPNETs and was not reached for SBNETs. Preoperativeneurokinin A did not correlate with PFS or OS. Preoperative serotonin correlated with PFS but not OS. Higherlevels of preoperative chromogranin A and pancreastatinshowed significant correlation with worse PFS and OSPresented at the Society of Surgical Oncology 67th Annual CancerSymposium, Phoenix, AZ, March 13, 2014Electronic supplementary material The online version of thisarticle (doi:10.1245/s10434-014-3728-0) contains supplementarymaterial, which is available to authorized users.Ó Society of Surgical Oncology 2014First Received: 10 February 2014;Published Online: 22 April 2014J. R. Howe, MDe-mail: james-howe@uiowa.edu(p \ 0.05). After multivariate adjustment for confounders,preoperative and postoperative pancreastatin remainedindependently predictive of worse PFS and OS (p \ 0.05).Whether pancreastatin normalized postoperatively furtherdiscriminated outcomes. Median PFS was 1.7 years inpatients with elevated preoperative pancreastatin versus6.5 years in patients with normal levels (p \ 0.001).Conclusions. Higher pancreastatin levels are significantlyassociated with worse PFS and OS in SBNETs and PNETs.This effect is independent of age, primary tumor site, andpresence of nodal or metastatic disease. Pancreastatinprovides valuable prognostic information and identifiessurgical patients at high risk of recurrence who couldbenefit most from novel therapies.Small bowel (SBNETs) and pancreatic (PNETs) neuroendocrine tumors (NETs) have an annual incidence in theUnited States of 1–2 per 100,000.1,2 Surgery is the primarytreatment for SBNETs and PNETs and benefits evenpatients with advanced metastases.2–13 Despite effectivetreatments and long overall survival (OS) times, tumorrecurrence occurs frequently after resection.7 Medicaltreatment with somatostatin analogs, such as octreotide, isindicated in patients with symptomatic or recurrent disease.12 Octreotide promotes disease stabilization andprolongs survival in selected patients.7,14 Additional treatments, such as peptide-receptor radionuclide therapy inSBNETs and PNETs and everolimus or sunitinib inPNETs, can help patients with recurrent, extensive, orrefractory disease.15–17The difficulty of distinguishing patients with indolentdisease from those likely to experience early progressionand death remains a major problem in neuroendocrinetumor management.18 In addition to features visible oncross-sectional imaging, serum levels of tumor markersinform prognosis in SBNETs and PNETs. Neuroendocrine
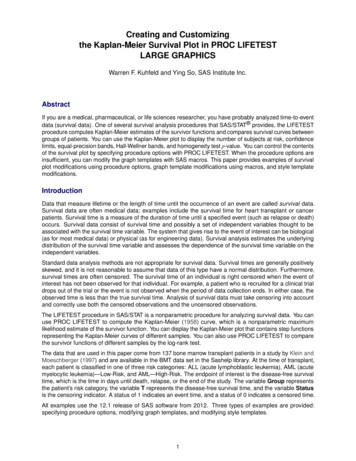
2972S. K. Sherman et al.cells secrete proteins and amines such as chromogranin A,neurokinin A, pancreastatin, and serotonin, which reflectextent of disease and can herald progression.19–23 Of these,chromogranin A is the most widely used and represents theonly tumor marker recommended by current NET management guidelines.2,3,12,24 Despite these endorsements,chromogranin A has important limitations for predictingNET prognosis, including false elevation due to comorbidconditions or medications and lack of assay standardization.24–26 Pancreastatin has been proposed as an alternativebiomarker, because its levels are less susceptible to nonspecific effects, the assay is more standardized, and earlyexperience indicated a correlation with tumor burden andoutcomes.25–30Improving biomarker-based prognostication throughlong-term correlation with outcomes at specialized centersis identified as a priority in NET treatment.18 In addition toimproving the accuracy of discussions with patients, distinguishing high-risk patients before surgery allowsinclusion in clinical trials of those most likely to benefit. Toimprove prognostication in neuroendocrine disease, wetherefore sought to determine whether preoperative andpostoperative serum levels of these four tumor markerscorrelate with outcomes in a large cohort of surgicallymanaged SBNET and PNET patients with long-term follow-up.tests. Preoperative and postoperative laboratory values werecompared by the Wilcoxon sign-rank test. All analyses usedR v. 3.0.1 (Vienna, Austria).METHODSLaboratory Values and OutcomesClinical data for patients undergoing surgery forSBNETs and PNETs at a single center between 1999 and2013 were retrospectively reviewed under an InstitutionalReview Board–approved protocol. The operative approachwas as previously described.31 Preoperative and postoperative laboratory values were recorded, and clinical notesand radiology reports were reviewed for dates of surgery,disease progression, last follow-up, and death. All eventtimes were defined as from the date of surgery. Pancreastatin was measured with a C-terminal–specificradioimmunoassay as described.25 Laboratory values werelog-transformed because of skew and were tested both ascontinuous and categorical (normal range vs. elevated)variables for correlation with progression-free (PFS) andOS. Median event times were estimated by using the Kaplan–Meier method, and p-values were calculated by usingthe log-rank test.32 Follow-up times were estimated by thereverse Kaplan–Meier method.33 For laboratory valuesshowing significant association with outcomes (p \ 0.05)on univariate analysis, multivariate Cox models adjusted foreffects of confounding factors.34 Proportional hazardsassumptions were verified. Patient characteristics werecompared by using Fisher’s exact or Wilcoxon rank-sumTo understand their relation to outcomes, preoperativeserum levels of tumor markers as well as clinical factors weretested for univariate association with PFS and OS. Asexpected, N and M stage, as well as tumor grade, showedsignificant correlations with PFS and OS (Table 2). Lymphnode ratio, T-stage, and primary site showed significantassociations with PFS, whereas age at surgery significantlycorrelated with OS. Preoperative labs were collected a median of 30 days before surgery (interquartile range16–57 days). Of 176 patients, preoperative chromogranin A(n 121), pancreastatin (n 130), and serotonin (n 137)were available for most patients, whereas neurokinin A(n 71) was less commonly measured. Laboratory valueswere tested as continuous variables for association withoutcomes. The risk of progression or death did not correlatewith preoperative neurokinin A levels (p [ 0.4; Table 2).Although neurokinin A was previously reported to correlatewith OS in 35 midgut NET patients, even with analysis limited to SBNET patients with preoperative neurokinin A levels(n 52), no association with PFS or OS existed (p [ 0.4).19Preoperative serotonin levels were significantly associatedwith PFS, but not OS (p 0.02 and 0.9, respectively). Incontrast, preoperative chromogranin A (PreopCgA) andRESULTSPatient CharacteristicsIncluded were 98 SBNET and 78 PNET patients(n 176), 46 % of whom were female. The median age atsurgery was 58 years, and 62 % had metastatic disease.The median time from diagnosis to surgery was 65 days.Significant differences existed between SBNET and PNETpatients in median age at surgery, the proportion who werefemale, and the proportion with low-grade, node-positive,or metastatic disease (Table 1). Median follow-up was3.8 years and was similar between SBNET and PNETpatients. Median PFS was 3.3 years overall but was significantly shorter among patients with SBNETs comparedwith PNETs (2.0 vs. 5.6 years; p \ 0.01). Despite highrates of tumor progression, estimated median OS was 10.5years in patients with PNETs and was not reached inSBNET patients (Fig. 1). Five-year OS was 79 % inSBNETs and 80 % in PNETs. In 108 patients with metastatic disease at the time of surgery, 5-year OS was 76 %for SBNETs and 71 % for PNETs.
Pancreastatin Predicts NET Survival2973TABLE 1 Patient characteristics and survivalVariableCombined (n 176)SBNETs (n 98)PNETs (n 78)SBNETs versusPNETs(p value)Age at surgery, years, median (range)58.2 (22.2–85.3)60.4 (27.6–85.3)54.8 (22.2–81.5)\0.01Female (%)46.038.855.10.03Node-positive disease (%)Metastatic disease (%)75.662.192.681.452.937.7\0.001\0.001Low-grade tumor (%)76.485.265.20.01Intermediate-grade tumor (%)21.014.829.00.047High-grade tumor (%)2.50.05.80.047Follow-up, years, median (95 % CI)3.8 (3.0-4.5)3.7 (2.7–4.4)4.2 (3.2–5.6)0.2PFS, years, median (95 % CI)3.3 (2.5–5.6)2.0 (1.7–4.2)5.6 (3.6–NA)\0.01OS, years, median (95 % CI)10.5 (10.0–NA)NA (9.1–NA)10.5 (10.0–NA)0.9Bold values are statistically significant (p \ 0.05)SBNET small bowel neuroendocrine tumor, PNET pancreatic neuroendocrine tumor, CI confidence interval, NA cannot be estimated(a)(b)Tumor TypeSBNET (n 98)PNET (n 78)0.60.00.00.20.40.4Proportion0.60.80.8Tumor TypeSBNET (n 98)PNET (n 78)0.2ProportionOverall Survival by Tumor Type1.01.0Progression-free Survival by Tumor Type02468101214024Years68101214YearsFIG. 1 Progression-free (a) and overall (b) survival by primarytumor type. SBNETs are shown with darker lines and PNETs withlighter lines. Progression-free survival was significantly lower amongSBNET patients. SBNET small bowel neuroendocrine tumor, PNETpancreatic neuroendocrine tumorpancreastatin (PreopPST) levels showed significant correlation with both PFS and OS (p \ 0.05). These resultssuggested that PreopCgA and PreopPST offer prognosticinsight in SBNETs and PNETs.To investigate whether a simple distinction between elevated versus not-elevated tumor markers provided usefulinformation, laboratory values were next considered as categorical variables. Preoperative levels of chromogranin A,pancreastatin, serotonin, and neurokinin A were elevatedabove their reference ranges in 66, 65, 69, and 39 % ofpatients tested, respectively. When considered as binaryvariables, high PreopPST, but no other marker, showed significant association with worse PFS and OS (p \ 0.05;Table 2). When compared with those with normal levels,patients with PreopPST above the reference range of135 pg/mL had significantly shorter median PFS (1.7 vs.6.5 years) and OS (9.1 years vs. not reached; Table 3; Fig. 2a,b). Five-year PFS was 14.9 % among patients with elevatedPreopPST, compared with 59.4 % among patients with normal levels, and 5-year OS fell to 72.6 % with elevatedPreopPST from 88.3 % among patients with normal levels.Multivariate AnalysisUnivariate association of PreopCgA and PreopPST levelswith outcomes suggested that these tests could be predictive
2974TABLE 2 Univariate analysisof association with progressionfree (PFS) and overall survival(OS) by log-rank testS. K. Sherman et al.Combined(n 176)SBNET small bowelneuroendocrine tumor, PNETpancreatic neuroendocrinetumorOS(p value)PFS(p value)Tumor site\0.010.9––––0.70.80.40.20.70.4Age at 0.010.0380.023PFS(p value)PNETs(n 78)Clinical featureSexBold values are statisticallysignificant (p \ 0.05)Tumor markers were analyzedboth as continuous logtransformed variables and ascategorical elevated versusnormal variables. Preoperativepancreastatin shows significantcorrelation with PFS and OSSBNETs(n 98)OS(p value)PFS(p value)OS(p 020.7Lymph node ratio0.0120.50.40.30.0170.7Log preop neurokinin A0.90.60.90.50.90.7Log preop serotonin0.0170.9\0.010.430.90.9Log preop chromogranin ALog preop \0.010.039\0.001\0.001Preop neurokinin A [40 ng/mL0.90.60.90.30.80.2Preop serotonin [200 ng/mL0.30.30.100.90.50.8Preop chromogranin A [95 ng/mL0.40.30.80.60.50.3\0.010.150.0540.066Preop pancreastatin [135 pg/mLof earlier progression and death. However, clinical characteristics predictive of PFS and OS were not equallyrepresented in SBNET and PNET patients. To investigatewhether differences in preoperative laboratory values provided independent prognostic information, multivariate Coxmodels adjusted for confounding factors. After accountingfor the primary tumor site, age at surgery, and presence ofnodal or metastatic disease, higher PreopPST, but not PreopCgA, remained independently predictive of worse PFSand OS (p \ 0.001 and p 0.01 for PreopPST; p 0.27and p 0.29 for PreopCgA; Table 4). These results did notchange when tumor grade was added to the model (TableS1). Because of changes in grading criteria over time and lownumbers of non-low-grade tumors, grade was omitted fromthe final model. Estimated median Cox-adjusted PFS was2.0 years among patients with elevated PreopPST versus5.6 years among patients with normal PreopPST (Fig. 2c).Thus, independent of known prognostic factors, a 3.6-yeardifference in median PFS is attributable to whether PreopPST is elevated.The location of the primary tumor also remained independently predictive of PFS and OS after multivariateadjustment. To confirm that differences in survival by PreopPST levels were not due to differences inherent in SBNETversus PNET tumors, PFS and OS were compared by primary tumor site in patients with elevated versus normalPreopPST. No significant differences existed. In patientswith normal PreopPST, PFS and OS were similar in SBNETand PNET patients (median PFS, 6.5 and 5.6 years, p 0.4;OS not reached for both, p 0.4; Table 3). In patients with\0.0010.048elevated PreopPST, PFS and OS were lower than in patientswith normal PreopPST but again were similar betweenSBNET and PNET patients (median PFS, 1.7 and 1.6 years,p 0.6; OS, 9.1 and 5.6 years, p 0.3). From these analyses we conclude that elevated PreopPST is associated with asharp decrease in predicted PFS and OS regardless ofSBNET or PNET origin.Postoperative Tumor Marker LevelsPostoperative laboratory values were next tested forassociation with PFS and OS. Postoperative levels weredrawn at a median of 124 days after surgery and wererecorded for most patients. In these patients, surgery reducedserum tumor markers, and postoperative chromogranin A(PostopCgA; n 117), pancreastatin (PostopPST;n 124), and serotonin (n 129) were significantly lowerthan preoperative levels (median changes: -30.5 ng/mL,-55.0 pg/mL, -88.0 ng/mL, respectively; p \ 0.01 for all).Postoperative neurokinin A (n 54) did not differ fromPreopNKA (p 0.09). Correlations of these values withPFS and OS mirrored those of preoperative values, withpostoperative serotonin showing significant association withPFS but not OS (p 0.01 and 0.9) and with PostopCgA andPostopPST showing significant correlation with PFS and OS(p \ 0.05). Both PostopCgA and PostopPST remainedindependently correlated with PFS and OS after multivariateadjustment for patient age, tumor site, and presence of nodaland distant metastases (p \ 0.01). Increased levels of either
Pancreastatin Predicts NET Survival2975TABLE 3 Survival differences based on tumor marker elevation, shown in all patients and in small bowel (SBNET) and pancreatic neuroendocrine tumor (PNET) subgroupsLevelMedian years PFS PFS5-yearMedian years(95 % CI)p value PFS (%) OS (95 % CI)High ([135 pg/mL;n 84)1.7 (1.3–2.6)Normal (n 46)6.5 (4.7–NA)High ([95 ng/mL; n 80)2.0 (1.7–5.3)Not elevated (n 41)3.2 (2.5–NA)High ([135 pg/mL;n 57)1.6 (1.1–1.9)Normal (n 67)7.3 (6.5–NA)High ([95 ng/mL; n 61)1.9 (1.6–3.3)Normal (n 56)5.6 (3.2–NA)Preoperative, postoperativepancreastatinHigh, high ([135 pg/mL;n 44)1.6 (0.8–1.9)High, normal (n 17)3.9 (2.6–NA)Preoperative, postoperativechromogranin AHigh, high ([95 ng/mL;n 49)1.6 (1.3–3.3)High, normal (n 16)6.5 (2.5–NA)High ([135 pg/mL;n 64)1.7 (1.3–2.6)Normal (n 15)6.5 (4.7–NA)Tumor MarkerOS5-yearp value OS (%)All patientsPreoperative pancreastatinPreoperative chromogranin APostoperative pancreastatinPostoperative chromogranin A\0.0010.4\0.001\0.01\0.0114.99.1 (5.6–NA)59.4NA (7.5–NA)33.8NA (6.5–NA)28.1NA (5.6–NA)16.47.5 (5.6–NA)64.3NA (9.1–NA)27.8NA (NA–NA)57.3NA (6.5–NA)8.66.5 (4.0–NA)32.19.1 (5.6–NA)24.56.5 (6.1–NA)57.1NA (NA–NA)\0.0115.09.1 (6.5–NA)70.9NA (NA–NA)\0.0018.8NA (6.5–NA)74.5NA (9.1–NA)11.0NA (6.5–NA)32.59.1 (5.6–NA)0.05416.45.6 (2.7–NA)56.1NA (7.5–NA)0.0232.66.1 (5.0–NA)56.5NA (NA–NA)0.02.7 (2.2–NA)27.8NA 88.590.387.10.1563.80.0371.0100100SBNETs onlyPreoperative pancreastatinPostoperative pancreastatinHigh ([135 pg/mL; n 42) 1.5 (0.8–1.9)Normal (n 32)7.3 (6.5–NA)Preoperative, postoperativepancreastatinHigh, high ([135 pg/mL;n 37)1.6 (0.8–2.0)High, normal (n 11)4.2 (2.6–NA)High ([135 pg/mL;n 20)1.6 (1.2–NA)Normal (n 31)5.6 (2.5–NA)High ([135 pg/mL;n 15)1.6 (1.3–NA)Normal (n 35)NA (3.2–NA)High, high ([135 pg/mL;n 7)1.3 (0.5–NA)High, normal (n 6)3.9 Ts onlyPreoperative pancreastatinPostoperative pancreastatinPreoperative, 682.70.0441.7100Bold values are statistically significant (p \ 0.05)Both preoperative and postoperative pancreastatin levels provide strong discrimination of patient outcomes. Among those with elevatedpreoperative tumor markers, postoperative pancreastatin levels provide additional prognostic informationPFS progression-free survival, OS overall survival, CI confidence interval, NA cannot be estimatedpermitted strong discrimination between patients more andless likely to have early progression or death (Table 3).The impact of postsurgical normalization of tumormarkers was assessed by considering outcomes in patientswith elevated PreopPST by whether PostopPST remainedelevated. Among 84 patients with elevated PreopPST,PostopPST levels were available for 61. In these patients,PostopPST levels remained significantly predictive of bothPFS and OS (p \ 0.01). Whereas elevated PreopPST byitself indicates predicted median PFS and 5-year OS of1.7 years and 73 %, among those whose PreopPST levelsnormalized after surgery, median PFS and 5-year OSimproved to 3.9 years and 100 % (Table 3; Fig. 2d). Inthose whose PostopPST remained elevated, 5-year PFS was
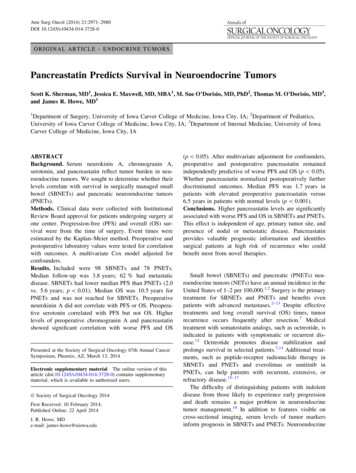
2976S. K. Sherman et al.(a)(b)Overall Survival by PreoperativePancreastatin1.01.0Progression-free Survival by PreoperativePancreastatinPreoperative Pancreastatin 135 es (n 84)No (n 46)Preoperative Pancreastatin 135 pg/mL0.00.0Yes (n 84)No (n 46)0246108024Years(c)101.0With Elevated Preoperative Pancreastatin (n 84)Preoperative Pancreastatin 135 pg/mLPostoperative Pancreastatin 135 pg/mLYesNo0.60.40.20.40.6Proportion0.80.8Yes (n 44)No (n 17)0.00.00.2Proportion8(d) PFS by Postoperative Pancreastatin in PatientsPFS Cox-Adjusted for Age, Site, Nodel andMetastatic Status1.06Years024680Years246810YearsFIG. 2 Median progression-free (PFS) (a) and 5-year overallsurvival (OS) (b) were higher in patients with normal (upper lighterline, n 46) versus elevated preoperative pancreastatin (lowerdarker line, n 84; median PFS, 6.5 vs. 1.7 years; 5-year OS, 88vs. 73 %). c Multivariate Cox model-adjusted PFS. Estimated medianPFS was significantly longer in patients with normal preoperativepancreastatin (upper lighter line) compared with elevated (lowerdarker line) even after adjustment for confounding factors. d PFS bypostoperative pancreastatin in patients with elevated preoperativepancreastatin levels. Patients with elevated preoperative pancreastatin(middle line; same as the darker line in a; n 84) can be furtherstratified by elevated (lower darker line, n 44) versus normalized(upper lighter line, n 17) postoperative pancreastatin levelsonly 8.6 % (vs. 14.9 % as predicted by elevated PreopPSTalone), and median OS dropped to 6.5 years. Deceptively,combining PreopCgA with PostopCgA information resulted in statistically significant differences in OS (Table 3),but this was because elevated PreopCgA failed to select ahigh-risk subset of patients. Because of the nonsignificantinfluence of elevated PreopCgA, little additional information was gained by combining preoperative andpostoperative measurements, and differences in outcomewere similar to those predicted by PostopCgA alone. Survival by normalization of PostopPST in SBNET and PNETsubgroups was similar to the combined results, althoughlarger sample sizes made results in the combined groupmore robust.DISCUSSIONIn this study we demonstrate that PreopPST providessignificant prognostic information in SBNET and PNETpatients, with higher levels independently predicting worsePFS and OS. Although considering the degree of tumormarker elevation allowed the strongest correlations withoutcomes, a binary distinction between pancreastatin elevated above the reference range versus normal allowed
Pancreastatin Predicts NET Survival2977TABLE 4 Multivariate Cox model resultsProgression-free survivalFactorHROverall survival95 % CIp valueHR95 % CIp value1.11–2.140.011.59–1090.02Results in all patientsLog preoperative pancreastatin (per doubling)1.401.18–1.67\0.001Node-positive disease2.401.03–5.580.043Metastatic disease2.321.01–5.320.0473.070.60–15.70.18Age at surgery (per ry site (if 1.08–2.270.021.851.05–3.280.03Node-positive tatic disease2.270.79–6.520.131.550.23–10.40.7Age at surgery (per year)1.010.98–1.040.61.020.96–1.080.6Log preoperative pancreastatin (per doubling)1.361.11–1.67\0.01Node-positive disease1.520.43–5.350.5Metastatic disease1.770.41–7.570.4Age at surgery (per year)1.030.99–1.060.10Results in PNETs onlyLog preoperative pancreastatin (per doubling)1.5412.7Results in SBNETs onlyInsufficient eventsfor multivariateanalysis inthis subgroupBold values are statistically significant (p \ 0.05)Preoperative pancreastatin levels remained independently predictive of progression-free and overall survival after adjustment for confoundingfactorsHR hazard ratio, CI confidence intervalseparation of patients into groups at high and low risk forprogression and death. Incorporating PostopPST measurements further refines prognostic predictions.Pancreastatin is a fragment of the 439-amino acid chromogranin A peptide produced by the peptidase prohormoneconvertase-2.25,35,36 Its predominant human form contains52 amino acids, although tumors may secrete additionalshorter N-terminal-truncated fragments.37 Stored in secretory granules, pancreastatin inhibits glucose-stimulatedinsulin release and pancreatic and gastric secretion while itpromotes glycogenolysis and impairs glucose uptake inmuscle, fat, and liver.37,38 Although high pancreastatin hasbeen recognized as a feature of neuroendocrine tumors forsome time, pancreastatin’s role in normal physiologyremains poorly understood.36,39 Pancreastatin seems to exertits effects through activity at membrane-associated G-proteins and phospholipase C, but a specific membrane-boundpancreastatin receptor (PSTR) has not been identified.37,39Attempts to identify the PSTR have focused on affinitypurification from rodent liver.37,39 NETs overexpress manyhormone receptors, such as those for somatostatin and gastric-inhibitory polypeptide, making it tempting to speculatethat the putative PSTR might be more abundant in, and morereadily isolated from, NET tissue specimens.40–42 Pancreastatin causes Ras-independent activation of the mitogenactivated protein kinase pathway and also activates thephosphatidyl-inositol-3-kinase/Akt pathway.37 Whetherpancreastatin represents a potential pharmacologic target inaddition to reflecting NET disease burden is unknown.Recent research highlights pancreastatin’s advantages inassessing neuroendocrine disease. Pancreastatin assays aremore standardized than those for chromogranin A, andpancreastatin levels do not vary with proton pump inhibitorexposure.25,30 Pancreastatin has greater sensitivity andspecificity for diagnosing NETs than chromogranin A andmight better reflect neuroendocrine disease burden.25,28,29Pancreastatin also correlates with outcomes. In 122 NETpatients undergoing hepatic artery chemoembolization,pancreastatin predicted response to therapy, and elevatedlevels independently correlated with lower survival (1.9 vs.3.4 years).29 Pretreatment pancreastatin independentlypredicted worse survival in 59 NET patients beginningsomatostatin analog therapy and also closely paralleledtumor burden.27Our results showing dramatic differences in outcomesbased on pancreastatin levels in 176 surgically managedpatients extend these findings and support pancreastatin’sutility for predicting NET behavior. Elevated PreopPSTpredicted a median PFS of 4.8 years less than with normalPreopPST and a 5-year OS more than 15 % lower (Fig. 2a,b). Adding PostopPST measurements allowed further separation of these estimates (Fig. 2d). Patients whose
2978elevated PreopPST remained high after surgery had agreater than 90 % chance of progression and nearly 40 %chance of death within 5 years, whereas none of thepatients whose pancreastatin normalized after surgery diedduring the same period, and median PFS more than doubled (Table 3). It is unknown whether serial pancreastatinmeasurements during follow-up add additional information; however, Pre- and PostopPST offer significantprognostic power. Multivariate analysis and investigationof results stratified by tumor type confirm that these effectsdo not reflect the status of other prognostic markers butconstitute independent information. Furthermore, if PreopPST levels are not available, this study demonstrates thatisolated PostopPST or PostopCgA serve as strong indicators of probable outcomes.The divergent prognoses of patients with elevated andnormal PreopPST recommend updates in NET management and in future research. First, its strong prognosticimplications support using pancreastatin as part of SBNETand PNET initial work-up and subsequent monitoring.Next, although somatostatin analogs are effective in progressive disease and are well tolerated, they are expensive,and many patients enjoy long periods of PFS after surgerywithout additional treatment.12,14 Current guidelines do notrecommend adjuvant octreotide in asymptomatic patients.Instead, patients begin additional therapeutics upon evidence of progression.2,3 Whether early initiation ofoctreotide or other treatments before tumor progressionwould impact survival is unknown. The currently enrollingEastern Cooperative Oncology Group E2212 phase II trial(NCT02031536) will determine whether adjuvant everolimus prolongs PFS in metastatic PNETs. As identificationof novel NET therapeutic targets and development of newagents proceeds, pancreastatin’s ability to discriminateoutcomes even in patients with metastases suggests thatfuture trials for advanced disease should consider monitoring pancreastatin.40,43 Our results support that elevatedPreopPST selects patients with median PFS nearly 5 yearslower than patients with normal levels, who could benefitmost from more aggressive therapy. Incorporation of pancreastatin in new clinical trial inclusion criteria could helpidentify patients most likely to benefit and reduce requiredsample sizes by selecting patients at the highest risk, inwhom researchers could best discern treatment effects.The independent association of PostopCgA levels withsurvival agrees with earlier data. Extensive evidence supports chromogranin A for NET evaluation, but few studiesspecifically address PreopCgA.20,22,23,44–47 In the presentstudy, PreopCgA was not significantly associated with outcomes after adjusting for prognostic covariates. The reasonfor this result is unclear but could relate to the influence offactors beyond tumor burden, such as proton pump inhibitoruse, kidney disease, inflammation, and hypertension, onS. K. Sherman et al.PreopCgA levels.24,26,30,44 Thus, although PostopCgA ishelpful, our results suggest lower utility of PreopCgA inprognostication. In terms of price, tests of CgA and PST arecomparable, with the Interscience Institute quoting a listprice of 125 for clinical CgA testing compared with 225for PST, although actual prices vary depending on testingvolume (ISI, Inglewood, CA, USA; unpublished communication, Interscience Institute Pricing, 2014).Limitations of this analysis include its retrospectivenature and that correlations were stronger in terms of PFSthan OS. This may be due to a low number of deaths, whichlimit our study’s power to detect differences in OS. The5-year survival rates for metastatic SBNETs and PNETs of76 and 71 % in this cohort compare favorably with resultsfrom Surveillance, Epidemiology, and End Results (5-yearsurvival of approximately 45 % in SBNETs and 25 % inPNETs with metastases).1 It is likely that longer follow-upand accumulation of more OS events will augment thesignificant correlation be
ORIGINAL ARTICLE - ENDOCRINE TUMORS Pancreastatin Predicts Survival in Neuroendocrine Tumors Scott K. Sherman, MD1, Jessica E. Maxwell, MD, MBA1, M. Sue O'Dorisio, MD, PhD2, Thomas M. O'Dorisio, MD3, and James R. Howe, MD1 1Department of Surgery, University of Iowa Carver College of Medicine, Iowa City, IA; 2Department of Pediatrics, University of Iowa Carver College of Medicine, Iowa .


![[ST] Survival Analysis - Stata](/img/33/st.jpg)