Transcription
IntroductionCensoringDescribing SurvivalComparing SurvivalModelling SurvivalSurvival AnalysisMark LuntCentre for Epidemiology Versus ArthritisUniversity of Manchester22/12/2020
IntroductionCensoringDescribing SurvivalComparing SurvivalModelling SurvivalIntroductionSurvival Analysis is concerned with the length of timebefore an event occurs.Initially, developed for events that can only occur once (e.g.death)Using time to event is more efficient that just whether ornot the event has occured.It may be inconvenient to wait until the event occurs in allsubjects.Need to include subjects whose time to event is not known(censored).
IntroductionCensoringDescribing SurvivalComparing SurvivalModelling SurvivalPlan of TalkCensoringDescribing SurvivalComparing SurvivalModelling Survival
IntroductionCensoringDescribing SurvivalComparing SurvivalModelling SurvivalCensoringExact time that event occured (or will occur) is unknown.Most commonly right-censored: we know the event has notoccured yet.Maybe because the subject is lost to follow-up, or study isover.Makes no difference provided loss to follow-up is unrelatedto outcome.
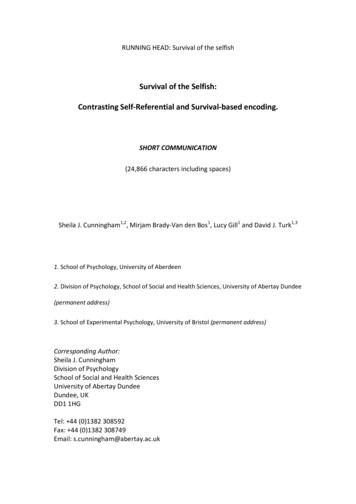
IntroductionCensoringDescribing SurvivalComparing SurvivalModelling SurvivalCensoring Examples: Chronological ccrualaObservation
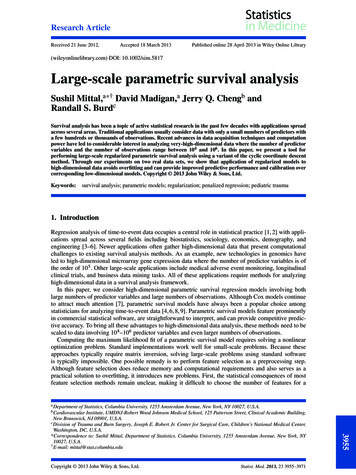
IntroductionCensoringDescribing SurvivalComparing SurvivalModelling SurvivalCensoring Examples: Followup TimeTime(months)06123a4710aaq89aq561812qaqFollowup Timea
IntroductionCensoringDescribing SurvivalComparing SurvivalModelling SurvivalOther types of censoringLeft Censoring:Event had already occured before the study started.Subject cannot be included in study.May lead to bias.Interval Censoring:We know event occured between two fixed times, but notexactly when.E.g. Radiological damage: only picked up when film istaken.
IntroductionCensoringDescribing SurvivalComparing SurvivalModelling SurvivalSurvivor functionStata CommandsDescribing Survival: Survival CurvesSurvivor function: S(t) probability of surviving to time t.If there are rk subjects at risk during the k th time-period, ofwhom fk fail, probability of surviving this time-period forthose who reach it isrk fkrkProbability of surviving the end of the k th time-period is theprobability of surviving to the end of the (k 1)thtime-period, times the probability of surviving the k thtime-period. i.eS(k ) S(k 1) rk fkrk
IntroductionCensoringDescribing SurvivalComparing SurvivalModelling SurvivalSurvivor functionStata CommandsMotion Sickness Study21 subjects put in a cabin on a hydraulic piston,Bounced up and down for 2 hours, or until they vomited,whichever occured first.Time to vomiting is our survival time.Two subjects insisted on ending the experiment early,although they had not vomited (censored).Is censoring independent of expected event time ?14 subjects completed the 2 hours without vomiting.5 subjects failed
IntroductionCensoringDescribing SurvivalComparing SurvivalModelling SurvivalSurvivor functionStata CommandsMotion Sickness Study )20/2119/20 S(30)19/19 S(50)17/18 S(50)17/17 S(51)15/16 S(66)14/15 S(82)14/14 S(92) 0.952 0.905 0.905 0.855 0.855 0.801 0.748 0.74821120Yes14014/14 S(92) 0.748
IntroductionCensoringDescribing SurvivalComparing SurvivalModelling SurvivalSurvivor functionStata CommandsKaplan Meier Survival CurvesPlot of S(t) against (t).Always start at (0, 1).Can only decrease.Drawn as a step function, with a downwards step at eachfailure time.
IntroductionCensoringDescribing SurvivalComparing SurvivalModelling SurvivalSurvivor functionStata CommandsStata commands for Survival Analysisstset: sets data as survivalTakes one variable: followup timeOption failure 1 if event occurred, 0 if censoredsts list: produces life tablests graph: produces Kaplan Meier plot
IntroductionCensoringDescribing SurvivalComparing SurvivalModelling SurvivalSurvivor functionStata CommandsStata Outputsts list if group 1failure d:analysis time tionError[95% Conf. ------------------------
IntroductionCensoringDescribing SurvivalComparing SurvivalModelling SurvivalSurvivor functionStata CommandsKaplan Meier Curve: example0.000.250.500.751.00Kaplan Meier survival estimate050100analysis time150
IntroductionCensoringDescribing SurvivalComparing SurvivalModelling SurvivalComparing Survivor FunctionsNull Hypothesis Survival in both groups is the sameAlternative Hypothesis12345Groups are differentOne group is consistently betterOne group is better at fixed time tGroups are the same until time t, one group is better afterOne group is worse up to time t, better afterwards.No test is equally powerful against all alternatives.
IntroductionCensoringDescribing SurvivalComparing SurvivalModelling SurvivalComparing Survivor FunctionsCan useLogrank testMost powerful against consistent differenceModified Wilcoxon TestMost powerful against early differencesRegressionShould decide which one to use beforehand.
IntroductionCensoringDescribing SurvivalComparing SurvivalModelling SurvivalMotion Sickness RevisitedLess than 1/3 of subjects experienced an endpoint in firststudy.Further 28 subjects recruitedFreqency and amplitude of vibration both doubledIntention was to induce vomiting soonerWere they successful ?
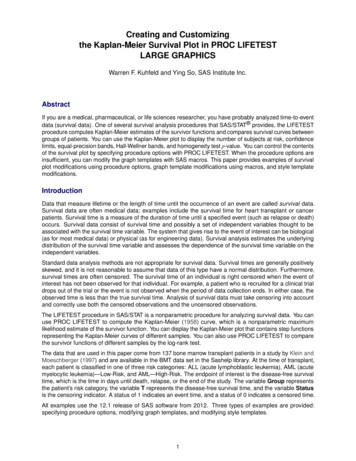
IntroductionCensoringDescribing SurvivalComparing SurvivalModelling SurvivalComparing Survival Curves0.000.250.500.751.00Kaplan Meier survival estimates, by group050100analysis timegroup 1group 2150
IntroductionCensoringDescribing SurvivalComparing SurvivalModelling SurvivalComparison of Survivor Functionssts test group gives logrank test for differencesbetween groupssts test group, wilcoxon gives Wilcoxon testTestLogrankWilcoxonχ23.213.18p0.0730.075
IntroductionCensoringDescribing SurvivalComparing SurvivalModelling SurvivalWhat to avoidCompare mean survival in each group.Censoring makes this meaninglessOverinterpret the tail of a survival curve.There are generally few subjects in tailsCompare proportion surviving in each group at a fixedtime.Depends on arbitrary choice of timeLacks power compared to survival analysisFine for description, not for hypothesis testing
IntroductionCensoringDescribing SurvivalComparing SurvivalModelling SurvivalThe hazard functionCox RegressionProportional Hazards AssumptionModelling SurvivalCannot often simply compare groups, must adjust for otherprognostic factors.Predicting survival function S is tricky.Easier to predict the hazard function.Hazard function h(t) is the risk of dying at time t, given thatyou’ve survived until then.Can be calculated from the survival function.Survival function can be calculated from the hazardfunction.Hazard function easier to model
IntroductionCensoringDescribing SurvivalComparing SurvivalModelling SurvivalThe hazard functionCox RegressionProportional Hazards AssumptionThe Hazard FunctionHazard for all cause mortality for time since birth
IntroductionCensoringDescribing SurvivalComparing SurvivalModelling SurvivalThe hazard functionCox RegressionProportional Hazards AssumptionOptions for Modelling Hazard FunctionParametric ModelSemi-parametric modelsCox Regression (unrestricted baseline hazard)Smoothed baseline hazard
IntroductionCensoringDescribing SurvivalComparing SurvivalModelling SurvivalThe hazard functionCox RegressionProportional Hazards AssumptionComparing Hazard Functions43210012345Log Logistic Distribution5Exponential treated243210012345Non constant Hazard Ratio5Unknown Baseline meUntreated1.5Treated2
IntroductionCensoringDescribing SurvivalComparing SurvivalModelling SurvivalThe hazard functionCox RegressionProportional Hazards AssumptionParametric RegressionAssumes that the shape of the hazard function is known.Estimates parameters that define the hazard function.Need to test that the hazard function is the correct shape.Was only option at one time.Now that semi-parametric regression is available, not usedunless there are strong a priori grounds to assume aparticular distribution.More powerful than semi-parametric if distribution is known
IntroductionCensoringDescribing SurvivalComparing SurvivalModelling SurvivalThe hazard functionCox RegressionProportional Hazards AssumptionCox (Proportional Hazards) RegressionAssumes shape of hazard function is unknownGiven covariates x, assumes that the hazard at time t,h(t, x) h0 (t) Ψ(x)where Ψ exp(β1 x1 β2 x2 . . .).Semi-parametric: h0 is non-parametric, Ψ is parametric.t affects h0 , not Ψx affects Ψ, not h0
IntroductionCensoringDescribing SurvivalComparing SurvivalModelling SurvivalThe hazard functionCox RegressionProportional Hazards AssumptionCox Regression: InterpretationSuppose x1 increases from x0 to x0 1,h(t, x0 ) h0 (t) e(β1 x0 )h(t, x0 1) h0 (t) e(β1 (x0 1)) h0 (t) e(β1 x0 ) eβ1 h(t, x0 ) eβ1 h(t,x0 1)h(t,x0 )i.e. the Hazard Ratio is eβ1 eβ1
IntroductionCensoringDescribing SurvivalComparing SurvivalModelling SurvivalThe hazard functionCox RegressionProportional Hazards AssumptionResults may be presented as β or eββ 0 eβ 1 risk increasedβ 0 eβ 1 risk decreasedShould include a confidence interval.
IntroductionCensoringDescribing SurvivalComparing SurvivalModelling SurvivalThe hazard functionCox RegressionProportional Hazards AssumptionCox Regression: Testing AssumptionsWe assume hazard ratio is constant over time: should test.Possible tests:Plot observed and predicted survival curves: should besimilar.Plot log( log (S(t))) against log(t) for each group: shouldgive parallel lines.Formal statistical test:OverallEach variableMay need to fit interaction between time period andpredictor: assume constant hazard ratio on short intervals,not over entire period.
IntroductionCensoringDescribing SurvivalComparing SurvivalModelling SurvivalThe hazard functionCox RegressionProportional Hazards AssumptionCox Regression in Statastcox varlist performs regression using varlist aspredictorsOption nohr gives coefficients in place of hazard ratios
IntroductionCensoringDescribing SurvivalComparing SurvivalModelling SurvivalThe hazard functionCox RegressionProportional Hazards AssumptionTesting Proportional Hazardsstcoxkm produced plots of observed and predictedsurvival curvesstphplot produces log( log (S(t))) against log(t)(log-log plot)estat phtest gives overall test of proportional hazardsestat phtest, detail gives test of proportionalhazards for each variable.
IntroductionCensoringDescribing SurvivalComparing SurvivalModelling SurvivalThe hazard functionCox RegressionProportional Hazards AssumptionCox Regression: Example. stcox i.groupCox regression -- Breslow method for tiesNo. of subjects No. of failures Time at risk Log likelihood 49194457-67.296458Number of obs 49LR chi2(1)Prob chi2 ------------------------------------- t Haz. RatioStd. Err.zP z [95% Conf. Interval]------------- -------------2.group ------------------
IntroductionCensoringDescribing SurvivalComparing SurvivalModelling SurvivalThe hazard functionCox RegressionProportional Hazards Assumption0.50Survival Probability0.600.700.800.901.00Testing Assumptions: Kaplan-Meier Plot050100analysis timeObserved: group 1Predicted: group 1Observed: group 2Predicted: group 2150
IntroductionCensoringDescribing SurvivalComparing SurvivalModelling SurvivalThe hazard functionCox RegressionProportional Hazards Assumption0 ln[ ln(Survival Probability)]1234Testing Assumptions: log-log plot123ln(analysis time)group 14group 25
IntroductionCensoringDescribing SurvivalComparing SurvivalModelling SurvivalThe hazard functionCox RegressionProportional Hazards AssumptionTesting Assumptions: Formal Test. estat phtestTest of proportional hazards ----- chi2dfProb chi2------------ --------------------------------global test -------
IntroductionCensoringDescribing SurvivalComparing SurvivalModelling SurvivalThe hazard functionCox RegressionProportional Hazards AssumptionAllowing for Non-Proportional HazardsEffect of covariate varies with timeNeed to produce different estimates of effects at differenttimesUse stsplit to split one record per person into severalFit covariate of interest in each time period separately
IntroductionCensoringDescribing SurvivalComparing SurvivalModelling SurvivalThe hazard functionCox RegressionProportional Hazards Assumption0.000.20Survival Probability0.400.600.801.00Non-Proportional Hazards Example01020analysis timeObserved: treatment2 StandardPredicted: treatment2 Standard3040Observed: treatment2 Drug BPredicted: treatment2 Drug B
IntroductionCensoringDescribing SurvivalComparing SurvivalModelling SurvivalThe hazard functionCox RegressionProportional Hazards AssumptionNon-Proportional Hazards Example. stcox --------------------------------------- t Haz. RatioStd. Err.zP z [95% Conf. Interval]------------- -------------treatment2 -------------------. estat phtestTest of proportional hazards assumptionTime: ----------------- chi2dfProb chi2------------ global test --------------------------
IntroductionCensoringDescribing SurvivalComparing SurvivalModelling SurvivalThe hazard functionCox RegressionProportional Hazards AssumptionNon-Proportional Hazards Example: Fittingtime-varying effectstsplit period, at(10)gen t1 treatment2*(period 0)gen t2 treatment2*(period 10). stcox t1 ----------------------------- t Haz. RatioStd. Err.zP z [95% Conf. Interval]------------- -------------t1 1.836938.87374081.280.201.72313574.666262t2 -------------------. estat phtestTest of proportional hazards assumptionTime: ----------------- chi2dfProb chi2------------ global test -------------------------
IntroductionCensoringDescribing SurvivalComparing SurvivalModelling SurvivalThe hazard functionCox RegressionProportional Hazards Assumption1.000.000.200.20Survival Probability0.400.600.80Survival Probability0.400.600.801.00Non-Proportional Hazards Example01020analysis timeObserved: t1 0Predicted: t1 030Observed: t1 1Predicted: t1 14001020analysis timeObserved: t2 0Predicted: t2 030Observed: t2 1Predicted: t2 140
IntroductionCensoringDescribing SurvivalComparing SurvivalModelling SurvivalThe hazard functionCox RegressionProportional Hazards AssumptionTime varying covariatesNormally, survival predicted by baseline covariatesCovariates may change over timeCan have several records for each subject, with differentcovariatesEach record ends with a censoring event, unless the eventof interest occurred at that timeNeed to have unique identifier for each individual so thatstata knows which observations belong togetherOption tvc() is for variables that increase linearly withtime
Describing Survival Comparing Survival Modelling Survival Survivor function Stata Commands Describing Survival: Survival Curves Survivor function: S(t) probability of surviving to time t. If there are rk subjects at risk during the kth time-period, of whom fk fail, probability of surviving this time-period for those who reach it is rk fk rk
![[ST] Survival Analysis - Stata](/img/33/st.jpg)