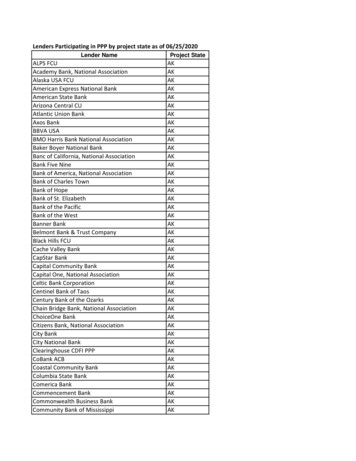
Transcription
29 March 2022
DisclaimerThis presentation and subsequent discussions may contain forward-looking statements thatinvolve risks and uncertainties. These statements are generally indicated by the use offorward-looking terminology such as believe, expect, anticipate, estimate, plan, project, target,may or will, or may be expressed as being the results of actions that may or are expected tooccur in the future. You should not place undue reliance on these forward-looking statements,which reflect our belief only as of the date of this presentation. These forward-lookingstatements are based on our own information and on information from other sources webelieve to be reliable. Our actual results may be materially less favorable than those expressedor implied by these forward-looking statements which could depress the market price of ourLevel 1 ADSs and local shares.2
Strategy ReviewFinancial &Business ResultsOutlook
Steady Business Progresswith Solid Financial IndicatorsProfit after TaxationTotal AssetsAnnual DPSHK 25.0bnHK 3.64tnHK 1.1307.7%0.7%52.0%ROEROAPayout Ratio5
Deepened Local Market Developmentto Consolidate Market LeadershipMid to high-end customers:AUM:Private Wealth customers:HK/Macao syndicated loans:for 17 consecutive yearsIPO receiving bank business:remainedAUM:BOC Life:Assets under custody:in SME Financing Guaranteein standard new premiumsin RMB insurancein the marketin cash pooling businessin new residential mortgage loansto launch green mortgages in HKRMB transaction volume for clients:Scheme (SFGS)BOCI Prudential:in MPF marketiGTB online transaction volume fortreasury business:IssuedHONIA-basedcertificate of deposit in HK BOCHK Asset Management:“RMB Manager in HK”- Asia Asset Management“Bank of the Year in Hong Kong” – The Banker (UK)6
Capturing Key Market of the Greater Bay Area throughEnhanced Cross-border Service Capabilitiesin Southbound and Northbound accountopeningsby number of customers andclearing amountsCumulative number of new accounts:Provided professional financing solutionsincluding mortgage loan, secured propertyfinancing and personal loanFirst bank to cooperate in social security service delivery,making customers’ lives and development in the GBA moreconvenientGBA corporate loans:Loans to innovative tech companies:“Best Chinese Bank for the Greater Bay Area” - Asiamoney7
Refining Regional Strategy toUnlock Southeast Asia’s Market PotentialLaosOfficially openedOfficially openedMyanmarThailandCambodiaCustomer DepositsCustomer LoansHK HK Philippinesbn 16.4%bn 2.1%VietnamNet Operating IncomeMalaysiaBruneiHK bn 8.3%IndonesiaNon-Performing LoansHK bnNPL ratio: 2.39%Remark: Customer deposits, customer loans and net operating income represent theconsolidated data for nine Southeast Asian entities which were prepared inaccordance with Hong Kong Financial Reporting Standards; NPL ratio was calculatedbased on their local regulatory requirements.8
Tapping Market Opportunities to Strengthen RMB Franchise27.7%21.5% 26.6%RMB depositsmarket share in HKRMB loansmarket share in HKRMB clearing valuegrowth* in HKEstablished aSupported theLaunchedto steerRMB businessdevelopment,serving �银行奖Best Cross-Border RMB Ser vices Award*Through RMB RTGS in Hong KongbetweenChina and Indonesia,with Jakarta Branchinrelated businessManila Branch officiallylaunched, andbecame atogether with BOCMalaysiacame onlineat BOC Malaysia andBOC Thailand,facilitating directexchange of RMB withdomestic currencies“Best Cross-Border RMB Services Award” – Treasury China9
Deepening Digital Transformation through Persistent InnovationEnhancing the Deployment ofDigital TechnologiesDeepening Scenario ConstructionMobile banking: CustomersTransaction volumein HK to use HKMA’s CommercialData Interchange throughout the entire SMEloan approval processLaunched “Refined scenarios for public services,transports, educations, property purchases,cross-border and wealth managementFirst bank to launch a mobile account openingservice using theapplication ofthe HKSAR GovernmentAverage daily usage of open API:Promoted process automation and enhancedefficiency of relevant processes byBoC Pay: CustomersTransaction volume” to facilitate SME growthTransaction value handled by trade financeblockchain platform:Property valuations using blockchain:Promoting Smart OperationsBoC Bill: Network coverageSettlement volumeCustomers of virtual bank LIVI:Nanning Regional Operation CentreAverage daily business handling volume:real-time monitoring of suspicioustransactions via electronic platformsEnhanced pre-warning capability forcybersecurity risksHong Kong's Best Digital Bank 2021 - Asiamoney10
Innovating Green Finance to Meet Customer NeedsGreen and Sustainable Loans 3.1XNew Green Deposits 3.5xESG Bond Underwriting Amount 1.7xLaunched HK’s 1st green mortgage scheme,1st green deposit scheme for personalcustomers, and 1st RMB ESG fundFirst bank to collaborate with HKQAA’s“Green Loan e-Assessment” platform,and introduced “SME Green FinancingIncentive Scheme”Issued “Sustainable and SmartLiving” themed green bonds11
Promoting BOC Values by Fulfilling Corporate ResponsibilitiesStrongly supported the financial relief programmesinitiated by the HKSAR Government and HKMAIntroducedprovidingSME customersnew financial support initiatives,of credit resources to assist localStood together with society to fight the virus, byimplementingmeasures, and makingcumulative charitable donations overOfficially became a signatory ofin May 2021Implemented–“The Chamber of HK Listed Companies”Organised-“Agency for Volunteer Service”Issued “Commemorative Banknote of the Beijing2022 Winter Olympic Games”, with all net proceedsdedicated to local charitable causescharitable projectsvolunteer activitiesNumber of volunteersVolunteer service hoursMSCI ESG Ratings - AAA12
Breakdown of Profit after TaxationHK m28,46824,9992020Profit afterTaxation(-9.4%)( 9.5%)(-42.6%)( 0.4%)(-20.8%)(-85.9%)NetInterestIncome*Net FeeIncomeOtherNonInterestIncome*Operating Impairment RevaluationExpenses AllowancesLoss ofInvestmentProperties(-2.4%)(-12.2%)Taxation& Others2021Profit afterTaxation* Including the funding income or cost of FX swap contracts14
Improvement in Deposit StructureCustomer Deposits up 6.8%Continual Increase in Market ShareHK m2,183,7092,331,155CASABalance: 4.3%XX%64.0%71.0%2020.12Time andOther DepositsMarket Share 15.25%up 0.25 pptDeposits Market Share2021.12Current and SavingDeposits (CASA)AverageCASA Ratio15
Balanced Growth in Customer LoansCustomer Loans up 6.8%Consistent Gains in Market ShareHK m581,799 7.8%Loans for Use in HK Corporate501,406 11.0%Loans for Use in HK IndividualsLoans for UseOutside HKMarket Share 14.18%up 0.42 ppt442,268 0.5%73,611 10.7%Trade FinancingLoans Market Share2020.122021.1216
Stabilising Net Interest MarginContinuous AIEA GrowthMargin*Fell in Line with Market Rates2021: 1.09%2020: 1.33%HK 11%2,737,7261.06% 10.1%1.0%36,37432,9440.5%0.0%1Q20 2Q20 3Q20 4Q20 1Q21 2Q21 3Q21 4Q21NIM*1M LIBOR1M HIBOR2020Net Interest Income*2021Average Interest-Earning Assets (AIEA)*Including the funding income or cost of FX swap contractsMarket data source: Bloomberg17
Resilient Net Fee Income GrowthNet淨利Fee息Income收 入 增up長9.5%X % YoYHK m10,84211,8722,7462,3105,736Broad-Based Income GrowthFunds Management 23.8%Bills Commissions 5.4%6,157Trust and CustodyServices 10.9%XX%5,46920205,900Insurance 20.2%OthersSecurities Brokerage 4.9%Loan Commissions 18.9%Credit Card Business 15.2%2021Net Fee and Commission IncomeCredit-Related Business: Loan CommissionsInvestment and Insurance-Related BusinessesNon-Credit Related Business: Traditional Fee Services18
Market-leading Cost EfficiencyStable Operating ExpensesMarket-Beating Cost-to-Income RatioHK m16,34781(3)(1)(17)16,40751.7% *46.8%33.5%30.0%2020Staff Premises &Costs EquipmentDepreciation& AmortisationOthers202120212020Market AverageBOCHKData source: Hong Kong Monetary Authority*3Q202119
Consistently Solid Asset QualitySteady and Sound NPL RatioSteady Decline in Credit CostHK 249XX%7548981,182(465)2020.12NPL Ratio2021.12NPL Coverage Ratio2020Credit cost2021Net Chargeof Impairment Allowances20- Advances and Other AccountsStage 1Stage 3Stage 220
Capital and Liquidity PositionsExceeded Regulatory RequirementsStable Capital LevelsTotalCapital RatioEnhanced Liquidity Ratios140.72%21.44%- 0.66ppt131.87%Tier 1Capital Ratio19.11%-0.56ppt126.44%120.31%CET 1Capital 21H21Average NSFR2H21Average LCR21
2022 OutlookRapidly Evolving International PoliticalLandscape & Lingering Pandemic SituationUneven Global Economic Recoverywith Weakening Growth MomentumSpill-over Risk from Monetary PolicyChanges of Major Developed EconomiesFurther Development of the GBA& Launch of Northern Metropolis BlueprintChallengesOpportunitiesWorld’s Largest Free Trade ZoneFormed as RCEP Takes EffectPositive Earning Outlook for Banks onthe Backdrop of Cyclical Rates Hike23
Bridge China and the World for the Common GoodBuilding a First-ClassRegional Banking GroupKey TasksMaintain stability while seeking progressCommitted to strict risk managementCapture market opportunitiesEnhance quality of development24
25
Income statement summary (HK m)20212020ChangeNet interest income*32,94436,374-9.4%Net fee and commission income11,87210,8429.5%Other non-interest income*4,1667,258-42.6%Net operating income before impairment ,57538,127-14.6%(2,145)(2,707)-20.8%Operating profit30,43035,420-14.1%Profit for the year24,99928,468-12.2%Profit attributable to equity holders of the Company22,97026,487-13.3%20212020ChangeBasic earnings per share2.17262.5052-13.3%Dividend per rating expensesPre-provision Operating Profit (PPoP)Net charge of impairment allowancesPer share (HK )Balance sheet summary (HK m)Total assetsAdvances to customersTotal liabilitiesDeposits from customersCapital and reserves attributable to equity holders* Including the funding income or cost of FX swap contracts26
(HK m) / %AssetsBalances and placements with banksand other financial institutionsDebt securities investments and other debt instruments20212020Average balanceAverage yieldAverage balanceAverage 1.76%1,600,4361.52%1,518,2462.08%Other interest-earning assets15,9130.75%18,5641.20%Total interest-earning assets3,015,2191.34%2,737,7261.82%Advances to customers and other accounts(HK m) / %LiabilitiesDeposits and balances from banks andother financial institutionsCurrent, savings and time deposits20212020Average balanceAverage rateAverage balanceAverage 40.65%--1,4525.51%Other interest- bearing liabilities19,8200.60%28,9171.27%Total interest-bearing d liabilitiesNet interest margin20212020Net interest margin1.06%1.27%Net interest margin (adjusted)*1.09%1.33%* Including the funding income or cost of FX swap contracts27
HK m20212020ChangeSecurities brokerage3,7433,5674.9%Loan commissions2,7462,31018.9%Credit card st and custody services76468910.9%Payment services7517401.5%Funds distribution724767-5.6%Bills commissions6235915.4%Safe deposit box306306-Funds management16113023.8%Currency exchange119226-47.3%Others1,1961,05813.0%Fees and commission income14,80313,5159.5%Fees and commission expense(2,931)(2,673)9.7%Net fee and commission income11,87210,8429.5%28
HK m20212020ChangeStaff costs9,5429,4610.9%Premises & equipment expenses1,2321,235-0.2%Depreciation and al operating 14,915-2.4%Full-time staff headcount29
HK m2021.122020.12ChangeTotal deposits from ,827724,44811.8%Demand deposits and current accountsSavings depositsTime, call and notice deposits30
HK m2021.122020.12ChangeLoans for use in Hong Kong - industrial, commercial and financial581,799539,6337.8%Property development166,208132,96625.0%Property investment78,12564,76820.6%Financial 4%Wholesale and retail 7.0%Transport and transport equipment62,00074,633-16.9%176198-11.1%Information 4%501,406451,82411.0%34,77627,80925.1%Loans for purchase of other residential properties349,645311,07012.4%Credit card rade financing73,61166,49710.7%Loans for use outside onal activitiesLoans for use in Hong Kong - individualsLoans for the purchase of flats in Home Ownership Scheme,Private Sector Participation Scheme and Tenants Purchase SchemeGross advances to customers31
HK m2021.122020.12Stage 1Stage 2Stage 3TotalStage 1Stage 2Stage 3TotalAdvances to ,872--4,3214,321--3,9943,994Trade --9,826Special mention--------Substandard or 898Special mention--------Substandard or 97,1941,476,81122,2631,3421,500,416Special mentionSubstandard or belowAdvances to banks andother financial institutionsPassGross advances and other accountsImpairment allowancesAdvances and other accounts32
On-balance sheet exposureHK mTotal loans and O/W: for use in Debt securitiesadvancesMainlandand othersSubtotalOff-balancesheet exposureTotalexposureCentral government, central government-ownedentities and their subsidiaries and joint cal governments, local government-ownedentities and their subsidiaries and joint ventures69,78137,4528,67778,45810,66989,127PRC nationals residing in Mainland or otherentities incorporated in Mainland and theirsubsidiaries and joint 897223,124123,584705,48179,061784,542With reference to the completion instructions for the HKMAreturn of Mainland activities (note 54 of Notes to the AnnualFinancial Information of 2021 Annual Report), as of 31December 2021, the total on-balance sheet non-bankMainland exposure was HK 705.5bn , up 8.9% from the end oflast year, accounting for 20.9% of total assetsOf which, total loans and advances was HK 581.9bn, upHK 27.1bn or 4.9% YTD. Asset quality was stable with NPL ratioof 0.12%. Loans for use in Mainland was HK 223.1bn,accounting for 14.0% of total loans of the Group.Analysis of the loans andadvances for use in Mainland17%36%CustomerStructure14%33%Central government, central government owned entities and theirsubsidiaries and joint venturesLocal governments, local government owned entities and theirsubsidiaries and joint venturesPRC nationals residing in Mainland or other entities incorporated inMainland and their subsidiaries and joint rty development & investmentElectricity and gasManufacturingTransport and transport equipmentHotel, Inn and food & beverageOthers33
As of 31 December 2021, customer loan exposure to industries (incl. trading, retail, aviation, tourism(incl. hospitality), F&B, entertainment) severelyaffected by COVID-19 amounted to HK 140.9bn, accounting for 8.81% of total loans, a decrease of HK 10.05bn and 1.27ppt from 31December 2020, respectively90.6% to large corporates; 9.4% to SMEsSpecial mention loans totalled HK 2.70bn, accounting for 1.91% of the relevant loan balances; non-performing loans wereHK 1.24bn, accounting for 0.88% of the relevant loan balances. Overall asset quality remained stableExposure by customer typeAsset qualitySpecialmention1.9%9.4%Pass97.2%90.6%Large corporatesNonperforming0.9%SMEsPassSpecial mentionNon-performing34
Private BankingMid to high-endcustomersPrivate WealthBOC Wealth Management 9.8% 7.8% 1% 5% 52% 35% 15% Customers20202021AUM2020202135
HK m20212020ChangeStandard new premiums10,28411,344-9.4%Profit before tax1,02385419.8%197,906179,86510.0%Total assets#3 in the life insurance market and remained #1 in RMB insuranceOverall market12.9%MOODY’SA1STANDARD&POOR’SALeading position maintained in e-channel and QDAP salesE-channel BOC Life’s standard new premiummarket share was 12.9% andE-channel* market share reached 36.6%, 36.6%*StatisticsRMB business78.7%BOC LifeOther InsuranceCompanies Continued to be #1 in RMB insurancewith a Further diversified distributionchannels, maintained leading marketposition in bancassurance sales, andproactively expanded tied agency andbroker channels. In 2021,from Insurance Authority: Direct Distribution Channelinclude online channel sales, direct mail and telesales withmajority coming from online channel salesQualifying Deferred Annuities**19.6%in the Qualifying DeferredAnnuity Policy (QDAP) market sincelaunch in 2019** AprilBOC LifeOther InsuranceCompanies2019 to December 202136
Resilient Net Fee Income Growth 2020 2021 XX% 5,469 5,900 5,736 6,157 2,310 2,746 Net Fee Income up 9.5% YoY 10,842 11,872 Net Fee and Commission Income Non-Credit Related Business: Traditional Fee Services Credit-Related Business: Loan Commissions Investment and Insurance-Related Businesses Insurance 20.2% Loan Commissions 18.9% Credit Card .