Transcription
PROJECT TIME PLANNINGProcess and Bar Chart Technique
Definition of Planning Planning is the process of thinking systematicallyabout the future in order to decide what our goals are, and how we are going to achieve them. Planningmeanslookingahead,makingpreparations, and deciding the best course ofaction.
Dimensions of PlanningPlanning can be viewed from following points: Subject:-Time Planning, Quality Planning, FinancialPlanning, Risk Planning, Product Planning, OrganizationalPlanning, . Organization:-Strategic Planning, Corporate Planning,Project Planning, Time:- Long-Rang Planning, Short-Range Planning, WeeklyPlanning, .
Why is Time Planning necessary?1) The increasing importance of timely completion.2) The continuous complexity and growth in the size of the projectgenerates the necessity for specialization. Specialization maylead to a breakdown of communications. Time planning must befound to facilitate communications.3) Planning is essential for resource management4) Planning is important for the efficient and maximum utilization ofresources.
Why is Time Planning necessary?5) Planning is basis for evaluating progress, controlling the workand making decisions.6) For achieving an increase in production.7) Financiers require a workable plan.8) Essential in projects when their is transfer of personnel.9) Minimum risk of the problems occurring.
Who Needs Time Planning? Customer/ Client/ Owner Designer/ Consultant Project management team (Manager, Engineers) Cost estimating department Planning and controlling department Supervisors, foremen, labors Supplier Financiers
Processes of Time Planning1. Visualize and define the activities.2. Sequence the activities (Job Logic).3. Estimate the activity duration.4. Schedule the project or phase.5. Allocate and balance resources.
1a) Visualize and define the activities1. An activityis a single work step (element)that has a recognizable beginning and end andrequires time for its accomplishment.Activity definition involves identifying anddocumenting the specific activities that mustbe performed to produce the deliverables andsub-deliverables.
1b) Visualize and define the activities2) The technique of decomposition(Work Breakdown)may be used in defining activities. Decompositioninvolves subdividing project work packages into smaller,more manageable components to provide bettermanagement control.3) The output from activity definition is the activity list.4) The Level of detail of the plan should be considered inthis phase.
1c) Visualize and define the activitiesCase Study: Install a new machineActivityCodeActivity DescriptionInspect the machine after installationHire the operatorInstall the new machineInspect and store the machine after deliveryHire labor to install the new machineTrain the operatorOrder and deliver the new machineDependsonLevelDuration(day)
2a) Sequence the activities1.Sequence the activities or job logic refers toidentifyinganddocumentinginteractivitylogical relationships,i.e. determined order in which the activities areto be accomplished in the project.
2b) Sequence the activities2. Job plan must reflect the practical restraints or limitationsthat apply to most job activities. The types of restraints are: Mandatory dependencies or hard logic (natural dependency),Preferred logic (Discretionary dependencies),External dependencies,Resource restraints andSafety restraints.3) Predecessor activities mean coming before, whilesuccessor activities mean coming after.4) Overlap the activities to reduce the project time.
2c) Sequence the activitiesCase Study: Install a new machineActivityCodeActivity Description100Inspect the machine after installation200Hire the operator300Install the new machine400Inspect and store the machine after delivery500Hire labor to install the new machine600Train the operator700Order and deliver the new machineDependsonLevel3004None1500, 40037002None1200, 3004None1Duration(day)
3a) Estimate the activity duration1. Select the time unit (week, day,.) to be used.2. Use one of the following tools and techniques forestimating the activity duration: Expert judgment Quantitatively based durations Duration of activity (D) Quantity of work / [Production rateof a crew or equipment * No. of crews].Where production rate Quantity produced in unit of time Duration of activity (D) Quantity of work * Unit rateproductivity of a crew or equipmentWhere unit rate productivity Time needs to produce one unit of output
3b) Estimate the activity durationCase Study: Install a new machineActivityCodeActivity Description100Inspect the machine after installation200Hire the operator300Install the new machine400Inspect and store the machine after delivery500Hire labor to install the new machine600Train the operator700Order and deliver the new machineDependsonLevelDuration(day)30041None125500, 4003270021None120200, 30043None130
4a) Schedule the Project or Phase Scheduling Defined It is process showing relationship of activitiesand determining of the project time and thetiming of the activities comprising the project. Inschedulingquestions: weconsiderthefollowinghow long the project is expected to take?when each activity may be scheduled (started andended)?How resources can be used more proper?What are the critical bottlenecks in the project?
4b) Schedule the Project or Phase Project Scheduling principles Project scheduling is carried out before a project begins. Itinvolves (1) identifying tasks, (2) estimating duration and (3)allocating resources. Once the project is underway, the schedule may need to berevised based on initial progress. This ensures (1) costestimates and (2) time constraints are maintained at a specific levelof quality and scope. The revision is done by creating milestones. Once theproject is underway, the schedule may need to be revisedbased on initial progress. This ensures (1) cost estimates and(2) time constraints are maintained at a specific level of quality andscope.
4c) Schedule the Project or Phase Remarks Practically every project is sufficiently complex that itsbreakdown and its inner relationships must berecorded on paper or other media, and not only in thehead of the planner. Therefore as a plan is formulated some type of "papermodel" of the project should be developed tocommunicate results of the plan to others and to serve asa basis for evaluating progress and controlling the work.
Time Planning Techniques To schedule the project, the planner needs a TimePlanning Technique. Bar Charts and Linked Bar Charts; Network Model (Analysis), either Activity on arrow (AOA), Activity on node (AON), Precedence Diagram Line of Balance; Time-location Diagram.
BAR CHART During World War 1, Henry Gantt developed theBar chart planning technique. A bar chart graphically describes a etion of which marks its end. An activity is a task whose performancecontributes to completion of the overall project.
BAR CHART All activities are listed in a column at the leftside of the diagram. A horizontal time scale extends to the right ofthe list. A bar presenting each activity is drawn betweenits corresponding scheduled start and finishtimes.
Case study: Install a new 00Activity Description100Inspect the machine after installation200Hire the operator300Install the new machine400Inspect and store the machine after delivery500Hire labor to install the new machine600Train the operator700Order and deliver the new machineDependsonLevelDuration(day)30041None125500, 4003270021None120200, 30043None1301 2 3 4 5 6 7 8 9 10 11 12 13 14 15 16 17 18 19 20 21 22 23 24 25 26 27 28 29 30 31 32 33 34 35 36
Case study: Install a new 00Activity Description100Inspect the machine after installation200Hire the operator300Install the new machine400Inspect and store the machine after delivery500Hire labor to install the new machine600Train the operator700Order and deliver the new machineDependsonLevelDuration(day)30041None125500, 4003270021None120200, 30043None1301 2 3 4 5 6 7 8 9 10 11 12 13 14 15 16 17 18 19 20 21 22 23 24 25 26 27 28 29 30 31 32 33 34 35 36
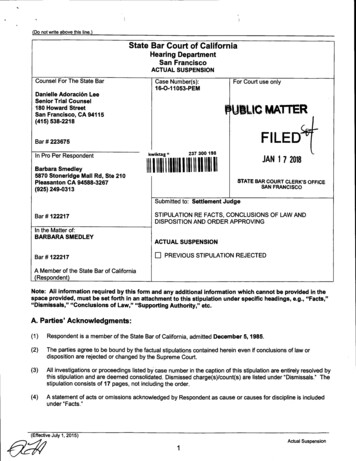
Case study: Building A bridge
Case study: Building a bridge
Preparing a Bar Chart
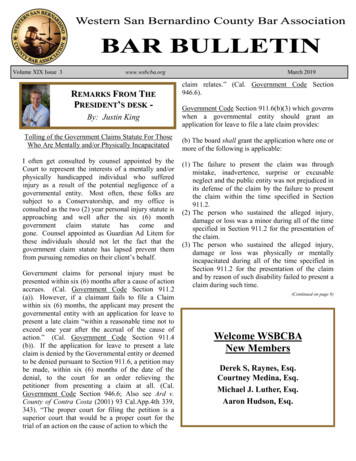
Gantt chart for Service For A Delta JetPassengersBaggageFuelingCargo and mailGalley servicingLavatory servicingDrinking waterCabin cleaningCargo and mailFlight servicesOperating crewBaggagePassengersDeplaningBaggage claimContainer offloadPumpingEngine injection waterContainer offloadMain cabin doorAft cabin doorAft, center, forwardLoadingFirst-class sectionEconomy sectionContainer/bulk loadingGalley/cabin checkReceive passengersAircraft checkLoadingBoarding0Figure 3.4 (From Heizer/Render; Operation Management1020Time, Minutes3040
Planning a custom-written computer projectStep 1. List all activities in the planTaskEarliest startLengthTypeA. High level analysisWeek 01 weekSequentialB. Selection of hardware platformWeek 11 daySequentialAWeek 1.22 weeksParallelBD. Detailed analysis of core modulesWeek 12 weeksSequentialAE. Detailed analysis of supporting modulesWeek 32 weeksSequentialDF. Programming of core modulesWeek 32 weeksSequentialDG. Programming of supporting modulesWeek 53 weeksSequentialEH. Quality assurance of core modulesWeek 51 weekSequentialFI. Quality assurance of supporting modulesWeek 81 weekSequentialGJ. Core module trainingWeek 61 dayParallelC,HK. Development and QA of accounting reportingWeek 51 weekParallelEL. Development and QA of management reportingWeek 51 weekParallelEM. Development of Management Information SystemWeek 61 weekSequentialLN. Detailed trainingWeek 91 weekSequentialI, J, K, MC. Installation and commissioning of hardwareDependent on.
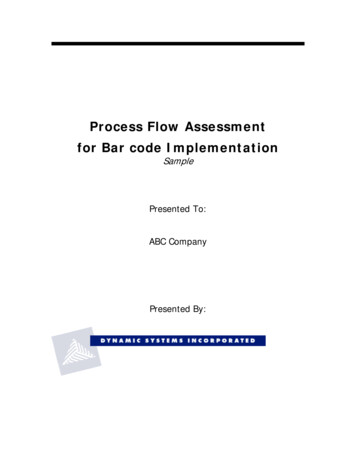
Planning a custom-written computer projectStep 2. Plot the tasks onto the graph paper
Planning a custom-written computer projectStep 3. Presenting the analysis
Planning a custom-written computer projectStep 4. Discuss the resultBy drawing this example Gantt Chart, you can see that: If all goes well, the project can be completed in 10 weeks. If you want to complete the task as rapidly as possible, you need:o 1 analyst for the first 5 weeks.o 1 programmer for 5 weeks starting week 4.o 1 programmer/QA expert for 3 weeks starting week 6. Note: Activities Land M have been moved back a week. This does not affect the criticalpath, but it does mean that a single programming/QA resource can carryout all three of activities K, L and M. Analysis, development and testing of supporting modules are essentialactivities that must be completed on time. Hardware installation and commissioning is not time-critical as long as it iscompleted before the Core Module Training starts.
Example: output of a software program
Example: output of a software program
Uses of Bar Chart Planning Technique Showing the order of the different activities Showing when operations should start and finish Checking what labor or equipment are needed and when Checking out delivery dates for materials Explaining to everyone concerned what and when is due tohappen Forecasting cash flow During execution, the chart used to control the work
Advantages of Bar Chart Simple graphical form Easy understood for all levels of management Good form of communication.
Limitations of Bar Chart Very cumbersome as the number of activities, increases Logic is not expressed in the diagram Difficult to use it for forecasting the effects of changes,It is therefore limited as control tool No indication where management attention should befocused Ineffective for project shortening
Logic is not represented in the Bar ChartABActivitiesCDEFGH01234567891011 1213 14Timedays
BAR CHART During World War 1, Henry Gantt developed the Bar chart planning technique. A bar chart graphically describes a project consisting of well-defined activities, the completion of which marks its end. An activity is a task whose performance contributes to completion of the overall project.