Transcription
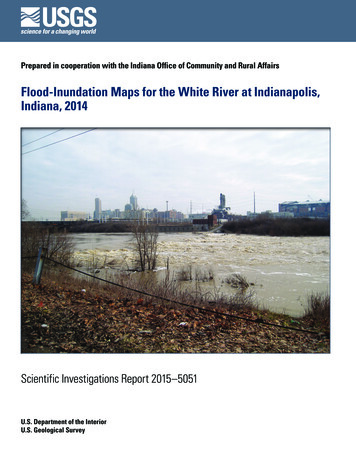
Prepared in cooperation with the Indiana Office of Community and Rural AffairsFlood-Inundation Maps for the White River at Indianapolis,Indiana, 2014Scientific Investigations Report 2015–5051U.S. Department of the InteriorU.S. Geological Survey
Cover. Photograph taken by U.S. Geological Survey hydrologic technician Ron Knapp during a floodmeasurement made on the White River at Indianapolis, Indiana, February 2008.
Flood-Inundation Maps for the White Riverat Indianapolis, Indiana, 2014By Elizabeth A. NystromPrepared in cooperation with the Indiana Office of Community and Rural AffairsScientific Investigations Report 2015–5051U.S. Department of the InteriorU.S. Geological Survey
U.S. Department of the InteriorSALLY JEWELL, SecretaryU.S. Geological SurveySuzette M. Kimball, Acting DirectorU.S. Geological Survey, Reston, Virginia: 2015For more information on the USGS—the Federal source for science about the Earth, its natural and living resources,natural hazards, and the environment—visit http://www.usgs.gov or call 1–888–ASK–USGS.For an overview of USGS information products, including maps, imagery, and publications, visit http://www.usgs.gov/pubprod/.Any use of trade, firm, or product names is for descriptive purposes only and does not imply endorsement by theU.S. Government.Although this information product, for the most part, is in the public domain, it also may contain copyrighted materialsas noted in the text. Permission to reproduce copyrighted items must be secured from the copyright owner.Suggested citation:Nystrom, E.A., 2015, Flood-inundation maps for the White River at Indianapolis, Indiana, 2014: U.S. Geological SurveyScientific Investigations Report 2015–5051, 12 p., http://dx.doi.org/10.3133/sir20155051.ISSN 2328-0328 (online)
n .1Purpose and Scope.2Study Area Description.4Previous Studies.4Creation of Flood-Inundation-Map Library.4Computation of Water-Surface Profiles.5Hydrologic Data.5Topographic and Bathymetric Data.5Hydraulic Structures.6Energy-Loss Factors.6Hydraulic Model.6Development of Water-Surface Profiles.8Development of Flood-Inundation Maps.8Flood-Inundation Map Delivery.8Disclaimer for Flood-Inundation Maps.10Uncertainties and Limitations Regarding Use of Flood-Inundation Maps .10Summary.10References Cited.11Figures1.Map showing location of the study reach for the White River at Indianapolis, Indiana,and location of U.S. Geological Survey (USGS) streamgages along the study reach.32. Flood-inundation map for the White River at Indianapolis, Indiana, correspondingto a stage of 20.00 feet at the USGS streamgage (station number 03353000).9Tables1.2.3.4.5.6.Information for U.S. Geological Survey streamgages along the study reach,White River, Indianapolis, Indiana.2Peak discharges for selected annual exceedance probabilities for White Riverat Indianapolis, Indiana.4Estimated discharges for corresponding stages and water-surface elevations atselected locations, used in the hydraulic model of the White River at Indianapolis,Indiana.5Calibration of model to target water-surface elevations at U.S. Geological Surveystreamgage on White River at Michigan Street at Indianapolis, Indiana.7Calibration of model to target water-surface elevations at U.S. Geological Surveystreamgage on White River at Indianapolis, Indiana (station number 03353000).7Calibration of model to target water-surface elevations at U.S. Geological Surveystreamgage on White River at Stout Generating Station at Indianapolis, Indiana.8
ivConversion FactorsInch/Pound to International System of UnitsMultiplyinch (in.)foot (ft)mile (mi)square mile (mi2)cubic foot per second (ft3/s)ByLength2.540.30481.609Area2.590Flow rate0.02832To obtaincentimeter (cm)meter (m)kilometer (km)square kilometer (km2)cubic meter per second (m3/s)DatumsVertical coordinate information is referenced to (1) stage, the height above an arbitrary datumestablished at a streamgage; and (2) elevation, the height above the North American VerticalDatum of 1988 (NAVD 88).Horizontal coordinate information is referenced to the North American Datum of 1983 (NAD 83).Elevation, as used in this report, is the distance above the vertical datum.AcknowledgmentsThe author wishes to thank the agencies that have cooperated in the funding for the operationand maintenance of the streamgages used for this study, including the Indiana Office of Community and Rural Affairs, the Indiana Department of Natural Resources, the city of Indianapolis,the Ohio River Valley Water Sanitation Commission, and Indiana University-Purdue UniversityIndianapolis (IUPUI). Tracey Humphrey from the Indianapolis Department of Public Works andRon Raney and Janie Marks from the Indiana Department of Transportation provided bridge andlevee data. Special thanks are given to the National Weather Service for their continued supportof the U.S. Geological Survey flood-inundation mapping program.
Flood-Inundation Maps for the White River at Indianapolis,Indiana, 2014By Elizabeth A. NystromAbstractIntroductionDigital flood-inundation maps for a 6.4-mile reach of theWhite River in Indianapolis, Indiana, from 0.3 miles upstreamof Michigan Street to the Harding Street Generating Stationdam (at the confluence with Lick Creek), were created by theU.S. Geological Survey (USGS) in cooperation with the Indiana Office of Community and Rural Affairs. The flood-inundation maps, which can be accessed through the USGS FloodInundation Mapping Science Web site at http://water.usgs.gov/osw/flood inundation/, depict estimates of the areal extentand depth of flooding corresponding to selected water levels(stages) at the USGS streamgage on the White River at Indianapolis, Ind. (station number 03353000). Near-real-time stagesat this streamgage may be obtained on the Internet from theUSGS National Water Information System at http://waterdata.usgs.gov/ or the National Weather Service (NWS) AdvancedHydrologic Prediction Service at http://water.weather.gov/ahps/, which also forecasts flood hydrographs at this site.Flood profiles were computed for the stream reach bymeans of a one-dimensional step-backwater model. The modelwas calibrated by using the current stage-discharge relations atthree USGS streamgages: the White River at Indianapolis (station number 03353000), the White River at Michigan Street atIndianapolis (station number 03352953), and the White Riverat Stout Generating Station at Indianapolis (station number03353611).The hydraulic model was then used to compute 11 watersurface profiles for flood stages at 1-foot (ft) intervals referenced to the White River at Indianapolis streamgage datumand ranging from 10 ft, or the NWS “action stage,” to 20 ft,which is the highest stage in the stage-discharge relation forthe streamgage and the NWS “moderate flood stage.”The simulated water-surface profiles were then combinedwith a geographic information system digital elevation model(derived from light detection and ranging [lidar] data having avertical 0.183-ft root mean squared error and 5.0-ft horizontalresolution) to delineate the area flooded at each water level.The availability of these maps, along with Internet information regarding current stage from the USGS streamgage andforecasted high-flow stages from the NWS, will provide emergency management personnel and residents with informationthat is critical for flood response activities such as evacuationsand road closures, as well as for postflood recovery efforts.The city of Indianapolis, in Marion County, Indiana(Ind.), is a large urban community, with a population of820,445 in 2010 (U.S. Census Bureau, 2010), and is theState capital and the seat of Marion County. The White Riverflows through Indianapolis from north to south, passing to thewest of downtown; several U.S. Geological Survey (USGS)streamgages are located within the city limits. A large portion of the city of Indianapolis (18 percent) is considered tobe part of a flood plain (City of Indianapolis, 2014); Indianapolis has experienced flooding from the White River andits tributaries numerous times, most significantly in 1913 andmore recently in 2003, 2005, and 2013. The flood of 1913inundated 6 square miles (mi2) in Indianapolis, destroyedbridges and levees, damaged or destroyed 4,000 homes, andkilled at least 5 people (Silver Jackets, 2013) with more damage statewide. In September 2003, more than 7 inches of rainfell in Indianapolis, causing the White River to rise 15 feet (ft)in 18 hours; the National Guard was activated to assist in emergency response (National Weather Service, 2009).Prior to this study, emergency responders in Indianapolisrelied on several information sources (all of which are available on the Internet) to make decisions on how to best alert thepublic and mitigate flood damages. One source is the FederalEmergency Management Agency (FEMA) flood insurancestudy (FIS) for Marion County, Ind., dated July 5, 2005 (Federal Emergency Management Agency, 2005). An updated, preliminary (as of 2014) version of the FIS (Federal EmergencyManagement Agency, 2014) also is available. A second sourceof information is the USGS streamgage 03353000, WhiteRiver at Indianapolis, Ind., from which current (U.S. Geological Survey, 2014a) and historical (with more than 85 yearsof daily discharge data and more than 100 years of peakstreamflow data since 1904; U.S. Geological Survey, 2014b)water levels and discharges, including annual peak flows,can be obtained. A third source of flood-related informationis the National Weather Service (NWS) Advanced Hydrologic Prediction Service (AHPS), which displays the USGSstage data, and issues forecasts of stage for the White Riverat Indianapolis (NWS station White River at Raymond Streetin Indianapolis, INDI3), (National Weather Service, 2014a).The NWS issues forecasts for the White River at Indianapolisroutinely year-round.
2 Flood-Inundation Maps for the White River at Indianapolis, Indiana, 2014Although the current stage at a USGS streamgage isparticularly useful for residents in the immediate vicinity of astreamgage, it is of limited use to residents farther upstreamor downstream because the water-surface elevation is notconstant along the entire stream reach. Knowledge of a waterlevel at a streamgage is difficult to translate into depth andareal extent of flooding at points distant from the streamgage.One way to address these informational gaps is to producea library of flood-inundation maps that are referenced to thestages recorded at the USGS streamgage. By referring tothe appropriate map, emergency responders can discern theseverity of flooding (depth of water and areal extent), identifyroads that are or will soon be flooded, and make plans fornotification or evacuation of residents in harm’s way for somedistance upstream and downstream from the streamgage.In addition, the capability to visualize the potential extent offlooding has been shown to motivate residents to take precautions and heed warnings that they previously might havedisregarded. In 2012–14, the USGS, in cooperation with theIndiana Office of Community and Rural Affairs, conducted aproject to produce a library of flood-inundation maps for theWhite River at Indianapolis, Ind.Purpose and ScopeThis report describes the development of a series of estimated flood-inundation maps for the White River at Indianapolis, Ind., and identifies where on the Internet the maps can befound and ancillary data (geographic information system [GIS]flood polygons and depth grids) can be downloaded. Theflood-inundation maps cover a 6.4-mile (mi) reach of theWhite River in central Indianapolis, from 0.3 mi upstreamof the Michigan Street bridge (and 0.1 mi downstream of theconfluence with Fall Creek) to the Harding Street GeneratingStation dam, at the confluence with Lick Creek (fig. 1). Themaps were produced for flood levels referenced to the stagerecorded at the USGS streamgage 03353000 on the WhiteRiver at Indianapolis (table 1), which is located approximatelymidway through the study reach. The maps cover a range instage from 10 to 20 ft, gage datum. The 10-ft stage is approximately bankfull and is defined by the NWS (2014b) as the“action stage” or that stage which, when reached by a risingstream, requires the NWS or a partner to take some type ofmitigation action in preparation for possible significant hydrologic activity. The 20-ft stage is the highest stage in the stagedischarge relation for the streamgage and the NWS “moderateflood stage.” This stage also exceeds that of the highest stagerecorded at the streamgage’s current (since 2000) site anddatum, that of 19.65 ft, which occurred on September 1, 2003.Two additional USGS streamgages are present in thestudy reach (table 1), 03352953, White River at MichiganStreet at Indianapolis, Ind. (3.1 mi upstream from the reference streamgage) and 03353611, White River at StoutGenerating Station at Indianapolis, Ind. (2.6 mi downstreamof the reference streamgage); stage-discharge relations fromthese streamgages were used in calibration of the hydraulicmodel, but the inundation maps are not referenced to thesestreamgages. The NWS does not forecast stages at these sites.Table 1. Information for U.S. Geological Survey streamgages along the study reach, White River, Indianapolis, Indiana.[Station locations are shown in figure 1; DA, drainage area; mi2, square miles; ft, feet; ft3/s, cubic feet per second]Maximumrecordedstage (ft) anddatePeriod ofpeak-flowrecordMaximumdischarge (ft3/s)and dateStationnumberDA(mi2)LatitudeLongitudeWhite River at Michigan Streetat Indianapolis033529531,62239 46'29"86 11'23"2005 to currentyear (2014)17.48,Jan. 6, 2005White River at Indianapolis033530001,63539 44'14"86 10'08"1904 to 1906and 1912 tocurrent year(2014)12White River at Stout GeneratingStation at Indianapolis033536111,89839 42'52"86 12'02"1992 to currentyear (2014)15.42,Sept. 1, 200351,500,Sept. 1, 2003Station name30.0,Mar. 26, 191337,000,Jan. 6, 200570,000,Mar. 26, 19131Stage recorded at different site and datum than current streamgage. Peak stage at current streamgage location 19.65 ft, Sept. 1, 2003; corresponding discharge 42,500 ft3/s.Estimated value.2
Introduction 386 13'86 11'86 9'Fall CreekINDIANAIndianapolisW. Michigan Street03352953W. New York Street39 46'StudyareaPedestrian BridgeW. Washington StreetRailroadJOHNSON COUNTYOliver AvenueKAv entuen ckue yLow-head damPogues Run (culverted)70Interstate 70W. Morris StreetRailroadEagle CreekRiv39 44'erS. Harding StreetW. Raymond XPLANATIONHarding Street Generating Station damLimits of study areaekLick CreFlow arrow—Indicates directionof water flow0335300039 42'70Projection: Transverse Mercator, NAD 83,State Plane Coordinate System, Indiana East, FIPS 1301Orthophotography from Indiana Spatial Data Portal,National Agriculture Imagery Program 2014, available at http://gis.iu.edu/000.50.5USGS streamgageand numberU.S. Route marker112 Miles2 KilometersFigure 1. Location of the study reach for the White River at Indianapolis, Indiana, and location of U.S. GeologicalSurvey (USGS) streamgages along the study reach.
4 Flood-Inundation Maps for the White River at Indianapolis, Indiana, 2014Study Area DescriptionPrevious StudiesThe White River originates in Randolf County, and flowsfrom northeast to southwest in central and southern Indianato join the Wabash River. The study reach is approximately6.4 mi long, has an average channel width of 340 ft, and islocated in Indianapolis, Marion County, in central Indiana.Land use within the study reach is predominantly urban andindustrial, with open and park space immediately adjacent tothe main channel through much of the reach, especially thenorthern part of the study reach.Several tributaries join the White River within the studyreach, including Pogues Run, Pleasant Run, Eagle Creek,and Lick Creek; the drainage area increases approximately18 percent through the study reach from 1,610 to 1,898 mi2.The drainage area of the White River at Indianapolisstreamgage 03353000 is 1,635 mi2. Fall Creek joins theWhite River just upstream of the study reach, and the Cityof Indianapolis Belmont Advanced Wastewater TreatmentFacility outfall is located just upstream of the Eagle Creekconfluence. Three major reservoirs are located upstream of thestudy reach, including Eagle Creek Reservoir, Geist Reservoir(located on Fall Creek), and Morse Reservoir (located onCicero Creek, a tributary of White River, north of Indianapolis). Eagle Creek Reservoir is used primarily as a flood-controlreservoir and secondarily for drinking water supply (FederalEmergency Management Agency, 2005; Citizens EnergyGroup, 2014), whereas Geist and Morse Reservoirs are usedprimarily for drinking water supply (Citizens Energy Group,2014). High flows and regulated releases in Eagle Creek cancause backwater in the White River (U.S. Geological Survey,2013); additionally, high flows in the White River can causebackwater in its tributaries, especially in areas along LickCreek (National Weather Service, 2014a). Variable backwatergenerated by and along tributaries is not considered in thisstudy.The study reach is traversed by 12 bridges, including 2 railroad bridges, 1 pedestrian bridge (the former WestWashington Street), and 9 roadways, including Interstate 70.Two broad-crested concrete and rock low-head dams are present in the study reach. Levees are present along much of thestudy reach, some of which are included in the National LeveeDatabase (U.S. Army Corps of Engineers, 2014). Many leveesin the study reach are maintained by the city of Indianapolis.The current FIS for Marion County (Federal EmergencyManagement Agency, 2005) is based on hydrologic andhydraulic analyses completed by the U.S. Army Corps of Engineers, Louisville District, in August 1979. The FIS presentsestimates of the peak discharges with 10, 2, 1, and 0.2 percentannual exceedance probabilities (table 2) and their associatedwater-surface elevations for the White River at the Marion/Johnson county line.A pilot flood-inundation mapping study for an 11-mireach of the White River in Indianapolis, approximately 3.8 miupstream of the study reach described in this report, was coordinated by the Indiana Silver Jackets hazard mitigation taskforce (Kim and others, 2011). The pilot study was conductedby the U.S. Geological Survey, the NWS, the Polis Center ofIndiana University-Purdue University Indianapolis, and Indiana University, in cooperation with the city of Indianapolis,the Indianapolis Museum of Art, the Indiana Department ofHomeland Security, and the Indiana Department of NaturalResources-Division of Water; it used a two-dimensionalhydraulic model to produce a library of static inundation mapsfor an 11-mi reach of the White River.Creation of Flood-Inundation-MapLibraryThe USGS has standardized the procedures forcreating flood-inundation maps for flood-prone communities (U.S. Geological Survey, 2014c) so that the processfollowed and products produced are similar regardless ofwhich USGS office is responsible for the work. Tasks specific to development of the flood maps for Indianapolis, Ind.,were (1) compilation of streamflow data from streamgages03352953, 03353000, and 03353611; (2) collection of bathymetric data for selected cross sections and geometric data forstructures and bridges along the study reach; (3) estimationof energy-loss factors (roughness coefficients) in the streamchannel and flood plain and determination of steady-flowdata; (4) computation of water-surface profiles using the U.S.Army Corps of Engineers’ HEC–RAS computer program(U.S. Army Corps of Engineers, 2010); (5) production ofTable 2. Peak discharges for selected annual exceedance probabilities for White River at Indianapolis, Indiana.[mi2, square miles; ft3/s, cubic feet per second; data from Federal Emergency Management Agency, 2005]Location on White RiverDrainagearea (mi2)Marion/Johnson county line1,950Estimated discharges (ft3/s) for indicated annual exceedance probabilities, in percent10210.238,00054,00062,00075,000
Creation of Flood-Inundation-Map Library 5estimated flood-inundation maps at various stream stagesusing the U.S. Army Corps of Engineers’ HEC-GeoRAScomputer program (U.S. Army Corps of Engineers, 2009)and a GIS; and (6) preparation of the maps, both as shapefilepolygons that depict the areal extent of flood inundation and asdepth grids that provide the depth of floodwaters, for displayon a USGS flood-inundation mapping application.Computation of Water-Surface ProfilesThe water-surface profiles used to produce the 11 floodinundation maps in this study were computed by using HEC–RAS, version 4.1.0 (U.S. Army Corps of Engineers, 2010).HEC–RAS is a one-dimensional step-backwater model forsimulation of water-surface profiles with steady-state (gradually varied) or unsteady-state flow computation options.to the North American Vertical Datum of 1988 (NAVD 88)by adding an offset; 669.56 ft at streamgage 03352953,661.76 ft at streamgage 03353000, and 662.96 ft at streamgage03353611. Continuous records of streamflow are computedfrom stage-discharge relations, which have been developed forthe streamgages, and are available through the USGS NWISWeb site.The peak flows used in the model simulations (table 3)were taken from the current stage-discharge relation forstreamgage 03353000 (number 52.0, effective September 1,2003) and corresponded with the target stages. Four tributaries—Pogues Run, Pleasant Run, Eagle Creek, and LickCreek—join the White River within the 6.4-mi study reach; thestreamgage-derived discharges were adjusted to account fortributary inflows (table 3). These adjustments were estimatedby applying a drainage-area ratio to the main-channel flows.Topographic and Bathymetric DataHydrologic DataThe study reach includes three streamgages (fig. 1;table 1), all of which were already in operation at the start ofthis study. Stage is measured every 15 minutes, transmittedhourly by a satellite radio in the streamgage, and made available on the Internet through the USGS National Water Information System (NWIS; U.S. Geological Survey, 2014b). Stagedata from these streamgages are referenced to a local datumbut can be converted to water-surface elevations referencedAll topographic data used in this study are referencedvertically to NAVD 88 and horizontally to the North American Datum of 1983 (NAD 83). Cross-section elevation datawere obtained from a digital elevation model (DEM) that wasderived from light detection and ranging (lidar) data that werecollected during December 2009, by Indianapolis Metropolitan Planning Organization (IndyMPO), Indianapolis Mappingand Geographic Infrastructure System (IMAGIS) (GreaterIndianapolis Area Aerial Lidar Survey, 2010) and subsequentlyTable 3. Estimated discharges for corresponding stages and water-surface elevations at selected locations, used in the hydraulicmodel of the White River at Indianapolis, Indiana.[ft, feet; NAVD 88, North American Vertical Datum of 1988]Estimated discharge at indicated location, in cubic feet per secondStage ofwater-surfaceprofile (ft)1Water-surfaceelevation(ft, NAVD 00044,61950,40151,046At upstreamend of studyreachDownstream from Downstream from Downstream from Downstream fromconfluence withconfluence withconfluence withconfluence withPogues RunPleasant RunEagle CreekLick CreekWater-surface profiles are 1-ft increments of stage, referenced to the gage datum of the U.S. Geological Survey streamgage, White River at Indianapolis,Indiana (station number 03353000).1
6 Flood-Inundation Maps for the White River at Indianapolis, Indiana, 2014incorporated into a 2011 Statewide lidar dataset by Woolpert,Inc. (2011). The lidar data have horizontal resolution of 5.0 ft(1.5 meters) and the original dataset has a vertical root meansquared error of 0.183 ft (5.6 centimeters). By using HEC–GeoRAS, a set of procedures, tools, and utilities for processinggeospatial data in ArcGIS, elevation data were extracted fromthe DEM for 80 cross sections and subsequently were inputto the HEC–RAS model. Because lidar data cannot provideground elevations below a stream’s water surface, channelcross sections were surveyed by USGS field crews during2012 and 2014. Cross-sectional depths were measured usingan echosounder at 49 locations. A differential global positioning system (DGPS) was used to derive horizontal locationsand the elevation of the water surface at each surveyed crosssection. Where possible, DEM-generated cross sections weremade to coincide with the locations of the within-channelfield-surveyed cross sections. In these cases, within-channeldata were directly merged with the DEM data. For all othercross sections, the within-channel data were interpolated fromthe closest field-surveyed cross section in the ArcMap application of ArcGIS (Esri, 2014), using a bathymetry mesh tool thatwas created by Merwade and others (2008). The density ofground elevations in the mesh was determined by two variables: (1) the number of parallel longitudinal profiles that wereevenly spaced across the channel and ran the length of thestudy reach and (2) the user-specified spacing between crosssections. Ground elevations were either extracted or interpolated from the field data at the intersections of 51 longitudinalprofiles and cross sections that were spaced 200 ft apart. Themesh elevations were subsequently added to the DEM dataof the synthetic cross sections before the data were exportedto HEC–RAS. Instructions for the bathymetry mesh tool arepresented by Merwade (2011).Hydraulic StructuresMany structures in and along the White River affect orhave the potential to affect water-surface elevations duringfloods, including bridges, dams, and levees. Twelve bridgescross the White River in the study reach, including nineroadways (W. Michigan St., W. New York St., W. WashingtonSt., Oliver Ave., Kentucky Ave., Interstate 70, W. Morris St.,W. Raymond St., and S. Harding Ave.), two railroad bridges,and a pedestrian bridge (the former W. Washington St., northof the current W. Washington St. bridge). Bridge-geometrydata were obtained from field surveys conducted by personnelfrom the USGS Indiana Water Science Center, the Indianapolis Department of Public Works (Tracey Humphrey, writtencommun., 2012 and 2013), the Indiana Department of Transportation (Ron Raney, written commun., 2012), and from aHEC–2 model (U.S. Army Corps of Engineers, 1991) thatwas used for the 2005 FIS (Federal Emergency ManagementAgency, 2005). Most of the bridges in the study reach havebeen partially reconstructed or altered since the HEC–2 modelwas developed for the FIS, and one bridge that was includedin the HEC–2 model has been removed. The most recent dataavailable was used for each bridge. Two broad-crested concrete and rock low-head dams are present in the study reach,one of which forms the
flows through Indianapolis from north to south, passing to the west of downtown; several U.S. Geological Survey (USGS) streamgages are located within the city limits. A large por-tion of the city of Indianapolis (18 percent) is considered to be part of a flood plain (City of Indianapolis, 2014); India-