Transcription
What InequalityMeans for ChildrenEvidence from Young LivesMartin Woodhead, Paul Dornan and Helen Murraywww.younglives.org.ukJANUARY 2013
What Inequality Means for Children:Evidence from Young LivesMartin Woodhead, Paul Dornan and Helen MurrayJanuary 2013Funded by
What Inequality Means for Children: Evidence from Young LivesMartin Woodhead, Paul Dornan and Helen MurrayFirst published by Young Lives in January 2013 Young Lives 2013ISBN: 978-1-909403-05-5A catalogue record for this publication is available from the British Library. All rights reserved.Reproduction, copy, transmission, or translation of any part of this publication may be made onlyunder the following conditions: with the prior permission of the publisher; or ith a licence from the Copyright Licensing Agency Ltd., 90 Tottenham Court Road, LondonwW1P 9HE, UK, or from another national licensing agency; or under the terms set out below.This publication is copyright, but may be reproduced by any method without fee for teachingor non-profit purposes, but not for resale. Formal permission is required for all such uses, butnormally will be granted immediately. For copying in any other circumstances, or for re-use inother publications, or for translation or adaptation, prior written permission must be obtained fromthe publisher and a fee may be payable.Available from:Young LivesDepartment of International DevelopmentUniversity of Oxford3 Mansfield RoadOxford OX1 3TB, UKTel: 44 (0)1865 281751E-mail: younglives@younglives.org.ukWeb: www.younglives.org.ukPrinted on FSC-certified paper from traceable and sustainable sources.
Evidence from Young LivesContentsThe age 1: Inequalities in children’s development originate in multipledisadvantages, with compounding effects on children’s long-termoutcomes10Message 2: Inequalities undermine the development of human potential:children from disadvantaged families quickly fall behind16Message 3: In Young Lives countries, gender differences become moresignificant as children get older, but boys are not always advantaged22Message 4: Early malnutrition has serious, long-term consequences,but there is also evidence that some children may recover28Message 5: Inequalities also open up during middle and later childhood 33Message 6: Children’s subjective well-being is both a major indicator of39inequality and also a channel for the transmission of povertyMessage 7: Education is regarded by adults and children as transformativebut doesn’t always compensate for background disadvantage and may45reinforce differencesMessage 8: Social protection programmes can reduce disadvantage, butimpacts are often complex, some may be unintended and they may not54always benefit childrenConclusions and policy e 3
Page 4What Inequality Means for ChildrenThe authorsMartin Woodhead is Professor of Childhood Studies at the Open University, UK andAssociate Research Director of Young Lives. He is a member of the Board of Trustees ofUNICEF UK. Paul Dornan is Senior Policy Officer for Young Lives. He was previously Headof Policy and Research for the Child Poverty Action Group in the UK. Helen Murray wasYoung Lives Policy Officer from 2008 to 2012. She has worked in both policy and researchroles in the fields of international development, education and conflict. Her current researchinterests include the role of higher education partnerships in social and political change.AcknowledgementsThis is an expanded version of a paper submitted to the UN Women/UNICEF globalthematic consultation on Addressing Inequalities: The Heart of the Post-2015 DevelopmentAgenda and the Future We Want For All (www.worldwewant2015.org/inequalities). We thankour research assistant, Maria José Ogando, for the careful analysis which contributed to thegraphs and figures presented here and Kirrily Pells for detailed work on the child profiles.We also wish to acknowledge the contribution of numerous Young Lives researchers whosework is summarised as well as well as the advice received on earlier drafts from colleaguesand members of the Young Lives International Advisory Board.Photo creditsThe children and their families who are participating in the Young Lives study willingly sharewith us a great deal of detailed personal information about their daily lives, and we have aresponsibility to protect their confidentiality and ensure their identities remain protected. Forthis reason, the children’s names have been changed in these profiles. The accompanyingphotos are of children living in similar situations to the children within our study sample.Ethiopia: Young Lives / Aida Ashenafi: p.21, p.43.India: Young Lives / Farhatullah Beig: p.37Peru: Young Lives / Sebastian Castañeda Vita: p.9; Raúl Egúsquiza Turriate: p.27.Vietnam: Young Lives / Pham Viet Anh: p.15, p. 53.About Young LivesYoung Lives is an international study of childhood poverty tracking 12,000 children’s lives over15 years in 4 developing countries – Ethiopia, India (in the state of Andhra Pradesh), Peru andVietnam. The pro-poor sample is drawn from 20 sites in each country, and includes two agecohorts (2,000 children who were born in 2001-02, and 1,000 children who were born in 199495 in each country). Three major survey rounds have been completed to date, in 2002 200607 and 2009, with further rounds due in 2013 and 2016.Young Lives is funded by UK aid from the Department for International Development (DFID)and co-funded from 2010 to 2014 by the Netherlands Ministry of Foreign Affairs.The views expressed are those of the authors. They are not necessarily those of, or endorsedby, Young Lives, the University of Oxford, DFID, or other funders.www.younglives.org.uk
Evidence from Young LivesSummaryUnderstanding how poverty and inequalities impact on children is the majorgoal of Young Lives, a unique longitudinal, mixed-methods research andpolicy study. We are tracking two cohorts of 12,000 children growing-up inEthiopia, the state of Andhra Pradesh (AP) India, Peru and Vietnam. In thispaper we offer eight key research messages, focusing on:1.How inequalities interact in their impact on children’s development, andthe vulnerability of the most disadvantaged households.2.The ways inequalities rapidly undermine the development of humanpotential.3.How gender differences interconnect with other inequalities, but do notalways advantage boys in Young Lives countries.4.The links between poverty, early stunting, and later outcomes, includingpsychosocial functioning, as well as emerging evidence that somechildren may recover.5.Inequalities that open up during the later years of childhood, linked totransitions around leaving school, working, and anticipating marriage etc.6.Children’s own perceptions of poverty and inequality, as these shapetheir well-being and long-term prospects.7.Evidence of the growing significance of education, including the waysschool systems can increase as well as reduce inequalities.8.The potential of social protection programmes in poverty alleviation.We conclude that since inequalities are multidimensional, so too must bethe response. Equitable growth policies, education and health services,underpinned by effective social protection, all have a role to play.www.younglives.org.ukPage 5
Page 6What Inequality Means for ChildrenIntroductionYoung Lives is a longitudinal child poverty study in Ethiopia, the state ofAndhra Pradesh (AP) in India, Peru and Vietnam. Although these countriesexperience distinct political and economic circumstances, they reflect manywider trends in low- and middle-income countries. This paper focuses on8 key messages from Young Lives research. It draws on findings from bothquantitative and qualitative data, and includes short profiles of 8 of the YoungLives children to illustrate the impact of inequality in their daily lives (seevan der Gaag, Knowles and Pells 2012). In the space available, the paper isinevitably highly selective in the topics covered and data reported, and moredetail can be found on the Young Lives website (www.younglives.org.uk),including an extensive resource of publications.Young Lives is uniquely positioned to contribute a stronger understandingof contemporary inequalities and their impact on children’s lives. As alongitudinal (or ‘panel’ study), with information on the same children at keymoments during their childhood, we are able to track changes over thelife-course, as well as looking for causes and consequences of events orcircumstances. Young Lives samples are broadly representative of a range ofgroups and children’s circumstances in each country but they were selectedto be pro-poor and exclude the very richest households. Consequently thedisparities documented below are likely to be an underestimate of the scaleof inequalities.Our starting point is that child poverty and inequalities are the expressionof political-economic-cultural forces that structure societies, and children’slives, in terms of distribution of resources and opportunities in ways thatalign to greater or lesser degree with ethnicity, caste, religion, urban/rurallocation, gender, generation etc. (Dornan and Boyden 2011). We understandthe concept of inequalities as covering a broad spectrum of differences inboth household circumstances and child outcomes, as these may be linkedto ethnicity, gender, rural-urban location, etc. Inequalities are typically aboutdisparities in resources and power and often link to social exclusion. We alsoemploy the concept of equity in relation to policies and services, in terms offor example, access to quality health care, education, and social protection.www.younglives.org.uk
Evidence from Young Lives“Our starting point is that child poverty andinequalities are the expression of political-economiccultural forces that structure societies, andchildren’s lives, in terms of distribution of resourcesand opportunities in ways that align to greateror lesser degree with ethnicity, caste, religion,urban/rural location, gender, generation etc.”We have organised this summary under eight key messages.Messages 1 and 2 highlight Young Lives evidence on the ways multipleinequalities interact in their impact on children’s development, includingevidence that the most disadvantaged households are most vulnerable toadversities and have least resources to overcome them. We also illustratethe ways inequalities undermine the development of human potential, withchildren from disadvantaged families quickly falling behind, in terms of earlylearning.Message 3 draws attention to the major impact of inequalities in children’shousehold circumstances on key developmental indicators during the earlyyears. Gender differences are much less apparent at this stage, they takedifferent forms within and between countries, and they are not always proboy in Young Lives contexts.Next we take a closer look at two life phases that are critical for inequalities.Message 4 reinforces the weight of evidence on the links between socioeconomic disadvantage, early stunting, and later developmental outcomes.A particular contribution is in demonstrating that these impacts extendto psychosocial functioning, including self-efficacy, self-esteem andeducational aspirations. Young Lives is also finding some evidence ofrecovery from early stunting for some children, which may also extend to theircognitive development.Message 5 looks at inequalities that open up during the later years ofchildhood, especially transitions around leaving school, working, anticipatingmarriage etc., as well as the impact of ill-health or becoming an orphan.Gender is a major focus, with evidence on the ways parents’ and children’schanging expectations interact with socio-economic opportunities andperceived long-terms risks and realistic prospects.www.younglives.org.ukPage 7
Page 8What Inequality Means for ChildrenMessage 6 draws attention to a neglected dimension within muchresearch on child poverty and inequalities. Children’s own perceptions andunderstanding of their situation and their well-being is not just an indicator ofinequalities. It is also a clue to some of the processes through which theseinequalities are transmitted, in so far as children’s subjectivity affects howthey cope with and try to improve their situation.Messages 7 and 8 are about the role of policies and services for children,specifically focusing on how far they are reducing (or increasing) inequalities.Message 7 begins by noting the growth in expectations for schooling, butalso the gulf between these expectations and the realities of access andquality, low attendance, grade repetition, early school leaving etc. Theresearch draws attention to the ways initial inequalities in children’s lives areall too often reinforced through inequitable access to pre-school services,and the resultant diverging trajectories. Educational systems in Young Livescountries vary, which is evident as we track children’s progress. For example,the growth of low-fee private schools in India appears to be increasinggender-linked decisions about choice of school for boys and girls. In thevery different context of Vietnam, Young Lives research demonstrates that aschool system focused on supporting all children can narrow achievementgaps.Finally, Message 8 reports on various social protection programmes withinour study countries. Overall, our data shows the potential of social protectionas a key way of underpinning pro-poor policies. But there are also lessonsfrom, for example, the Juntos programme in Peru, the Productive Safety NetProgramme in Ethiopia and Mahatma Gandhi National Rural EmploymentGuarantee Scheme in India. In particular, Message 8 draws attention to thelimitations of narrow targeting as well as the risks of unintended (and possiblyadverse) consequences for children from poorly designed or implementedschemes.www.younglives.org.uk
Evidence from Young Liveswww.younglives.org.ukPage 9
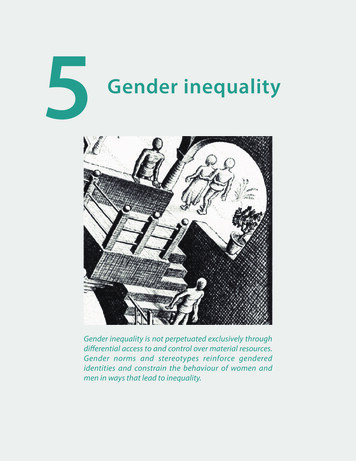
Page 10What Inequality Means for ChildrenMessage 1: Inequalities inchildren’s development originatein multiple disadvantages,with compounding effects onchildren’s long-term outcomesMultiple inequalitiesThe most marked inequalities among Young Lives children relate tohousehold wealth, urban-rural location, belonging to an ethnic/languageminority or low-caste group, and level of parental education. A typical patternis shown in Figure 1 for the percentage of children in Peru who were stunted.1When these different inequalities are combined, the negative impacts maybe compounded. Specifically, Figure 1 draws attention to the risks of onlyfocusing on one dimension of inequality, for example, urban versus rural.Thus, child stunting in Peru is lower in urban than in rural areas, but poorerchildren in urban areas are four times more likely to be stunted than childrenfrom the least poor quintile in urban areas.“Inequalities combine to produce negative impacts.Many children are subject to ‘multiple disadvantage’in both their household circumstances and theirlong-term prospects, pointing to the importanceof a holistic approach to policy and services.”1Stunting is a common measure of malnutrition defined as having a height-for-age of more than 2 standard deviations belowthe mean height of an age- and gender-adjusted reference group population. See Message 4 for more extensive evidence onstunting.www.younglives.org.uk
Evidence from Young LivesFigure 1. High levels of stunting are linked to multiple disadvantages (Peru,Younger Cohort, age 8 in 2009)8070% of childrenn stunted605040302010m Leot ahe str i posh oig r quhl iny e tidu leca anLete dasdtpoorquintLeileasan t pod orur qba uin ntiar leLeeaasan t pod orru qLra uile easl a ntss t pre ileed ooa*uc r qat uied ntm ileChot anhe dildr*'sfirstlis anSp guan agSais ehmpleaveragePoan ored stur qba uin ntiar leeaPoorestquintPilean oored stru qra uiChl a ntildre ilea*'sfiris stno lat S ngpa uani gesh0Note: The sample is divided into five ‘quintiles’ in order to identify ‘least poor quintile’ and ‘poorestquintile’, using a Young Lives wealth index which is based on housing quality (number of roomsrelative to household size, wall/roof and floor material); service quality (drinking water, electricity,fuel and sanitation); and consumer durables (radio, refrigerator, bicycle, mobile phone etc).Highly educated means the mother has completed some post-school education (including highereducation). Less educated means the mother has incomplete primary education level.* indicates fewer than 20 cases.Gender is also a source of inequalities, but the effects are less marked andmore variable across Young Lives countries (see Messages 3 and 5).Multiple impacts on developmentInequalities combine to produce negative impacts: children with lowparental education levels, in rural areas, poor, ethnic minority householdsare consistently over represented among low scorers across a range ofindicators (Cueto, Leon and Muñoz 2011). For example, among our sampleof 15 year olds in Peru, 59.4% of low scorers on a combined measure ofpoor health or learning came from rural areas, even though only 23.5% ofthe sample is rural. In the same way, 25.4% of these same 15 year olds withpoor health or learning outcomes were from ethnic minority households,www.younglives.org.ukPage 11
Page 12What Inequality Means for Childrenalthough these comprised only 17.3% of the sample. Finally, 26.4% with theworst health and learning outcomes came from the poorest 20% households(Pells 2011b). These children are subject to ‘multiple disadvantage’ in boththeir household circumstances and their long-term prospects, pointing to theimportance of a holistic approach to policy and services.Inequalities in vulnerabilityAnalysis of Young Lives data reveals some of the processes through whichinequalities impact progressively on households and, in turn, on children duringcritical phases of their lives. Children and families living in poverty are: (i) mostat risk of experiencing adverse events such as economic or environmentalshocks, illness or death; and (ii) they have fewer resources to cope with theseadverse events. Dividing the sample into five groups (referred to as ‘quintiles’)reveals the different levels of risk experienced by the ‘poorest’ compared withthe ‘least poor’ quintile. Ninety per cent of the poorest households of OlderCohort children in Ethiopia experienced at least one risk between 2002 and2006. Many reported multiple risks, with an average of 4.2 types of risk perhousehold. By contrast, 78% of the least poor quintile, experienced at least onerisk and the average was 2.1 types of risk per household. In short, the pooresthouseholds were exposed to a larger number and a wider range of types ofshocks or adverse events than were wealthier households (Boyden 2009).For example, Figure 2 illustrates major differences in the numbers of reportedshocks across the communities data is collected on in Ethiopia. Multipleshocks were concentrated among poor rural communities, which weremost affected by crop failures due to pests and disease or climatic events,and death of livestock, which was frequently compounded by high levels ofillness/death among household members.Families’ responses to shocks include the household eating less, reductionof household assets, and debt accumulation, all of which are likely to havelong-term consequences for children’s development. It is often the samehouseholds who suffer multiple shocks over time. For example, in Ethiopiaabout 71% of those households reporting an environmental shock in 2006also reported an environmental shock in 2009 (Dornan 2010). Children’svulnerability is further emphasised by research in Andhra Pradesh, wherechildren in households reporting at least one environmental shock werehalf as likely to have a healthy height-for-age, compared with children inhouseholds with no shocks reported (Pells 2011b).www.younglives.org.uk
Evidence from Young LivesFigure 2. Large differences in the numbers of shocks and adverse events,especially comparing rural versus urban communities (Ethiopia, families ofYounger Cohort children, age 8 in 2009)Urban800RuralTotal number of shocks70060050040030020010001234567891011 12 1314151617181920212223 2425Community ID numberThese findings draw attention to the multiple factors that progressivelyundermine children’s development. Policy formulation tends, however, to focuson one dimension of inequality through the targeting of particular groups,such as girls or orphans. Young Lives evidence points to the importance ofalso addressing broader structural inequalities (Crivello and Chuta 2012).Summary Inequalities originate in multiple disadvantages. The children who aremost at risk come from the poorest households, in rural locations, belongto an ethnic/language minority or low-caste group and have low levels ofmaternal (and paternal) education. Inequalities are also about greater vulnerability to the effects of adversity.Households most at risk generally have fewer resources to cope withadverse events. Summary statistics can be misleading: in Peru, although child stunting islower in urban than rural areas, poorer children in urban areas are fourtimes more likely to be stunted than children from the least poor quintilein urban areas.www.younglives.org.ukPage 13
Page 14What Inequality Means for ChildrenExperiencing multiple disadvantages: Y Sinh’s storyY Sinh is 9 years old but looks much younger. He lives with his mother andlittle sister in rural Vietnam, in a small house on stilts. The family comesfrom the H’Roi ethnic minority and speaks a minority language. Childrenlike Y Sinh, are more likely to be poor and less educated, less likely to haveaccess to safe drinking water and improved sanitation, and more likely to beunderweight or small for their age than children from the ethnic majority.The Young Lives interviewer noticed that: “people here mostly use waterfrom the public well. They wash their clothes and bathe in the stream. Themajority of the families don’t have toilets and bathrooms.” For Y Sinh povertycombines with other disadvantages, including being taught in a secondlanguage (Vietnamese) at school.Y Sinh’s family situation is also difficult. His father left home when Y Sinhwas very young and his mother said after that she had to work whereveranyone hired her. When Y Sinh was around 2 years old, his mother marriedher current husband. He treated her badly, had affairs with other women anddrank. He also beat her and her children. Her second husband’s family thenthrew her out and she had to seek help from her own relatives. Her husbandcontinues to be violent and rarely comes home.Y Sinh’s mother says she doesn’t know what she would do without her son,and that he earns money to feed the family. The older he grows, the closerthey are. She says:“I rely on Y Sinh. If I didn’t have him, I would die. When I was tiredand could not cut more canes I was sick he took a sickle andwent to cut sugar cane He cut 69 bundles of sugar cane in twodays.”Y Sinh’s mother worries about what will become of her children if she dies.She says that although she is not very old, her life is over.“I think about their future because I am already on the other side of thehill; there is no need to think about my future any more. In the futurewhen he grows up, he can go to work for others to earn money.”She says she wants her children to have an easier life than she has had.www.younglives.org.uk
Evidence from Young Liveswww.younglives.org.ukPage 15
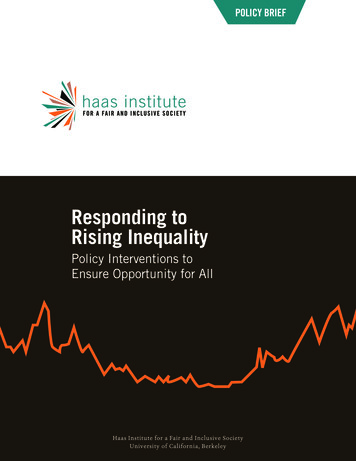
Page 16What Inequality Means for ChildrenMessage 2: Inequalitiesundermine the development ofhuman potential: children fromdisadvantaged families quicklyfall behindEarly inequalities in children’s learningLearning outcomes are a key indicator of growing inequalities. AnalysingYoung Lives Younger Cohort data across the four study countries, Cueto,Leon and Muñoz (2011) identified factors that accounted for the largestdifferences already emerging by age 8 in scores on vocabulary, readingand maths tests, as well as the variation across the four countries. Levelof parental education was linked to gaps in children’s learning outcomesin all countries. Urban-rural divisions were also important across the fourcountries, particularly for Ethiopia. Household wealth represented similarlylarge achievement gaps across all countries, though was less important inAndhra Pradesh.“Inequalities in household circumstances rapidlytranslate into inequalities in learning and poorerchildren are most at risk of falling behind.”Figure 3 illustrates for Peru, the strong impact of low maternal education, andminority language at home on children’s achievement scores in vocabulary,maths, and reading. Note the impact of gender is relatively small at this age.www.younglives.org.uk
Evidence from Young LivesFigure 3. Achievement gap (standard deviations) for cognitive measures(Peru, Younger Cohort, age 8 in 2009)PPVT (n 1,388)Maths (n 1,543)EGRA (n 1,312)0.10*FemaleBy gender(male/female)Male0.12*-0.06Mother's education:some secondary or moreMother's education:complete primary or less0.86*By mother'seducation(some secondaryor more/Complete primaryor less)0.76*0.61*IndigenousSpanish0.69*By languageat 0.40-0.200.000.200.400.600.801.00Standard deviationsSource: Cueto, Leon and Muñoz (2013, forthcoming)Note: The Early Grade Reading Assessment (EGRA) and the Peabody Picture Vocabulary Test(PPVT) include only the children who took these tests in Spanish.* The gap between groups is significant at 95% level on a t-test for independent samples.Poor children quickly fall behindFigures 4 and 5 highlight the ways initial inequalities in householdcircumstances rapidly translate into inequalities in learning between 5 and8 years old, based on illustrative data from Ethiopia and Peru. In each case,four groups were defined on measurements at the age of 5: (i) childrenfrom poor households with high cognitive test scores; (ii) children from poorhouseholds with low scores; (iii) children from better-off households withhigh scores; and (iv) children from better-off households with low scores.The graph shows their diverging trajectories through to age 8. The patternsare very similar across the four countries, and on several measures. At age5, poorer children were already under-represented among the high scoringgroup; but even for those who did well on the test at 5, by age 8 backgrounddisadvantage was undermining children’s test performance. Conversely, lesswww.younglives.org.ukPage 17
What Inequality Means for Childrenable children from better-off families made rapid progress and within threeyears they had caught up or overtaken their less advantaged (even thoughinitially better scoring) peers. Note that gender was not associated withchildren falling further behind at this stage (girls in Andhra Pradesh are at adisadvantage at both 5 and 8 years old). Multiple factors no doubt explainthese growing inequalities, including the resources for learning in children’shome environment, as well as differential access to quality early educationand primary school in a country still working towards Education For All goals(Woodhead et al. 2009).Figure 4. Learning trajectories (in cognitive tests) between 5 and 8 years(Ethiopia, Younger Cohort, 2009)100Higher wealth, high initial test scoreHigher wealth, low initial test scoreLower wealth, high initial test scoreLower wealth, low initial test score80Average rank of groupPage 18604020058Child ageNote: Children were tested at age 5 on their understanding of concepts of quantity via theCognitive Development Assessment (CDA), in order to identify the highest 20% and lowest 20%of test scorers. These groups were further subdivided using the wealth index referred to in Noteto Figure 1). Figure 4 plots the changes in test scores for all four groups through a follow-up testof problem-solving and arithmetic at age 8. Some convergence to the mean is expected withinthis type of analysis which could affect the results. This regression to the mean could affect thepattern (if high-scoring poor children are more likely than better-off children to be there becauseof luck at age 5). Sensitivity testing changes the pattern slightly but reinforces the conclusion ofpoorer children falling behind.With three rounds of data, Young Lives researchers have analysed howthese inequalities in cognitive and school achievement measures haveevolved over time. As is evident from the data presented so far, significantgaps open up already by the earlier years of schooling, but these ‘plateau’ inmiddle childhood when most children are in school (Cueto, Leon and Muñoz2011). For example, while gaps in education outcomes relate to householdwww.younglives.org.uk
Evidence from Young Liveswealth in all four countries, determinants of additional differences at theage of 12 were better explained by previous test scores at age 8 (with noadditional negative effect of wealth at that point) (Rolleston and James 2011).This suggests some compensatory potential/effect of schooling, but alsothat early gaps were predictive of lower later performance. The same studyfound that the inequalities in education outcomes widened again duringthe later years of schooling, when pressures to discontinue school rise,especially because of rising costs (including opportunity costs of labour)(See also Messages 5 and 7).Figure 5. Learning trajectories (in vocabulary tests) between 5 and 8 years(Peru, Younger Cohort, 2009)100Higher wealth, high initial test scoreHigher wealth, low initial test scoreLower wealth, high initial test scoreLower wealth, low initial test scoreAverage rank of group80604020058Child ageNote: The vocabulary test was an adapted version of the Peabody Picture Vocabulary Test(PPVT), administered at 5 and again at 8 years old. (See also notes to Figure 4, above.)Summary In
Vietnam. The pro-poor sample is drawn from 20 sites in each country, and includes two age cohorts (2,000 children who were born in 2001-02, and 1,000 children who were born in 1994-95 in each country). Three major survey rounds have been completed to date, in 2002 2006-07 and 2009, with further rounds due in 2013 and 2016.