Transcription
5Gender inequalityGender inequality is not perpetuated exclusively throughdifferential access to and control over material resources.Gender norms and stereotypes reinforce genderedidentities and constrain the behaviour of women andmen in ways that lead to inequality.
Gender inequality5.1.IntroductionGender is a primary marker of social and economic stratification and, as a result, of exclusion. Regardless ofone’s socioeconomic class, there are systematic gender differences in material well-being, although the degreeof inequality varies across countries and over time. As a result, gender inequality is a characteristic of mostsocieties, with males on average better positioned in social, economic, and political hierarchies. For more thantwo decades, the goal of reducing gender inequality has held a prominent place in international organizationsand in national strategy statements. Millennium Development Goal 3 reflects the global attention to the issueof gender inequality and has been providing the impetus for governments to eliminate gender inequality inprimary and secondary education by 2005 and in all levels by 2015.Where do we stand today with regard to gender parity in well-being? This paper explores that question. Thereis growing recognition that well-being is a multi-dimensional concept and, as noted in chapter 2, goes beyondincome, educational attainment and health (the material dimensions) to include agency and empowermentas well as subjective well-being. That framework is reflected in the following gender analysis that evaluatesgender differences in three key domains: capabilities, livelihoods, and agency.1 The first of these categories —capabilities — is of intrinsic value and it also generates the preconditions for securing one’s economic wellbeing via engagement in production and economic decision-making.The second domain — livelihoods — is comprised of conditions thatWell-being is a multi-dimensionalenable individuals to adequately provide for themselves and theirconcept and, as noted in chapter 2,families and includes access to work, wages, access to credit and assetgoes beyond income, educationalownership.2 The third domain — agency (or empowerment) — canbe understood as the ability of individuals and the groups to whichattainment and health (thethey belong to shape their environment. Thus, gender equality inmaterial dimensions) to includethis domain would imply that women are equally agentic as men.3agency and empowerment as wellWomen’s share of managerial positions and trade union membershipas subjective well-being.and of leadership positions in cooperatives, businesses and governingbodies are useful indicators in this domain.This framework for analysing global trends in inequality is based on the following premises. Equality ofcapabilities — that is, that women and men be on equal footing in terms of core functionings (education,health, and nutrition) — is a key condition for gender equality in other domains. Further, in order to achieveeconomic equality, women should be on par with men in their ability to convert capabilities into the abilityto generate livelihoods, that is, there should be progress towards gender equity in economic well-being.While we lack gender-disaggregated data on income, we should be able to assess equality in this domainvia data on gender gaps in access to jobs, credit and property ownership rights. The third domain, agency,is related to empowerment and voice in decision-making in the major sites of resource allocation in society:the household, the workplace and in governing bodies. With voice in these arenas, women might be able toinfluence the factors that lead to inequality in the capabilities or livelihoods domain. Unequal investments ingirls’ education at the household level, for example, can be rectified with increased voice that ensures thatgovernment resources are allocated to improve girls’ access to schooling.These three domains, therefore, are interrelated. Progress in one domain can leverage change in another.Further, progress in any one of these domains without progress in the others is inadequate to achieving theoverall goal of gender equality.162 Humanity Divided: Confronting Inequality in Developing Countries
Gender inequalityGender inequality is not perpetuated exclusively through differential access to and control over materialresources. Gender norms and stereotypes reinforce gendered identities and constrain the behaviour ofwomen and men in ways that lead to inequality (Ridgeway, 2011). We therefore also explore trends in somekey indicators of gender inequality in norms, using data from four waves of the World Values Survey.Any approach to analysing global trends in gender equality must be cognizant of the fact that not all genderdisparities favour men. For example, trends in educational attainment in recent years indicate gender reversalsin some countries, with women’s educational attainment exceeding men’s. Evidence of male disadvantageis important to identify for intrinsic reasons and also because declines in men’s absolute well-being couldlead to resistance to policies that promote gender equality. Inpromoting greater equality, whether by class, race or gender, theAny approach to analysing globalmost politically feasible strategy is to achieve this goal withouttrends in gender equality must belowering the standard of living of the dominant (i.e., male) group.cognizant of the fact that not allThis suggests that, in evaluating gender trends in inequality,we also want to know whether greater gender equality hasgender disparities favour men. Foroccurred in an environment of stagnating, declining or risingexample, trends in educationalmale well-being. As noted in the consultation on the Post-2015attainment in recent years indicateDevelopment Agenda, “gender equality is not about transferringgender reversals in some countries,opportunities from men to women, but about realizing the rightswith women’s educational attainmentof everyone, and creating conditions where both all have theright and ability to realise their full human potential” (UNICEF andexceeding men’s.UN Women, 2013:35).5.2.Trends in gender equality of capabilitiesThe capabilities domain captures gender differences in the preconditions necessary for living a good life.Intergroup gender differences in capabilities condition the probabilities that females and males at the individuallevel will achieve particular levels of economic well-being. Here we focus on two indicators of capabilities —education and health — both considered essential prerequisites to well-being, laying the foundation for theability to provision for self and family and thus to achieve economic security.Intergroup inequality in capabilities is important beyond the individual impacts that it embodies. That is thecase because intergroup inequality contributes to the formation and perpetuation of norms and stereotypesthat influence access to resources, livelihoods and agency. Underinvestment in female education, for example,contributes to stereotypes about women’s relative intelligence and skills, regardless of those possessed by theindividual woman. A large time-series of global data is available to examine trends in three variables in thecapabilities domain: 1) total years of education of those 15 and older, 2) gross secondary school enrolmentrates, and 3) life expectancy (relative to the maximum achievable by gender).4Average total years of education is a stock variable that captures the cumulative societal effect of genderinequality in education. In contrast, (gross) secondary school enrolment rates are a flow variable, indicative ofgender differences in the particular year in which the data are measured. This contrasts with previous studies that emphasize gender differences in literacy and primary school enrolment rates. This paper focuses onsecondary school enrolment rates for two reasons. First, substantial progress has been made in closing gendergaps in literacy and primary education, making it useful to shift focus to higher levels of education. Second,Humanity Divided: Confronting Inequality in Developing Countries 163
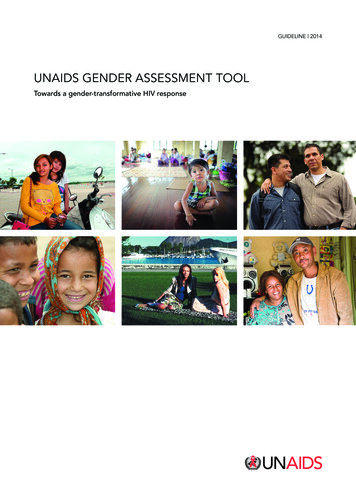
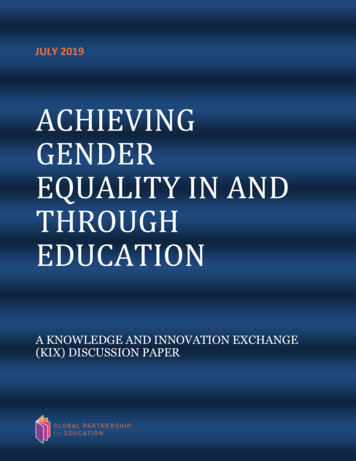
Gender inequalityFigure 5.1. Trends in female and male averagetotal years of education, 1990 and 2010Panel A. Distributions of F/M ratiosas economies change and move up theindustrial ladder, secondary education ismore likely than primary education to determine ability to participate in the paideconomy rather than in earlier stages ofeconomic development.With regard to the health domain, genderdifferences in life expectancy reveal information about physical well-being andduration of life. Although some studiesalso examine data on maternal mortalityrates, this analysis maintains a focus onvariables that explicitly measure gendergaps (Permanyer, 2013).5.2a.Panel B. Change in F/M ratio and initial F/M ratio total average years educationPanel C. Regional trends in F/M educational attainment ratios, 1990 to 2010Source: Author’s calculations based on Barro and Lee (2010) dataset.164 Humanity Divided: Confronting Inequality in Developing CountriesEducationThis section examines total years ofeducation of those 15 and older as a broadmeasure of educational achievement,using data from Barro and Lee (2010) for1990 to 2010. It also examines genderdifferences in gross secondary enrolmentrates for the same time period.The data in Figure 5.1 exhibit trends inthe ratio of average total years of femaleto-male education for those 15 and olderfrom 1990 to 2010 for 146 countries. Thisvariable reflects the cumulative effect ofeducational inequality in a society. PanelA plots the distribution of the ratio offemale-to-male (F/M) total years of education using a kernel density estimationprocedure.5 The x-axis represents the F/Mratio of total average years of educationin a country while the y-axis indicates thenumber of countries with a particular F/Mratio. As Panel A demonstrates, genderdisparities in average total years of education have diminished over the past 20years. The entire distribution has movedto the right, indicating that the average(at the country level) F/M ratio has risen.
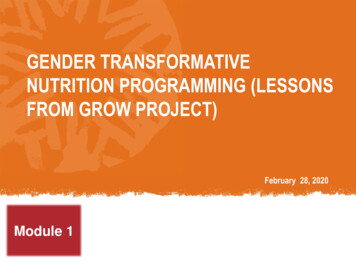
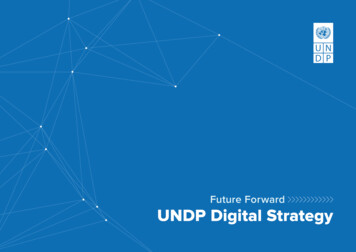
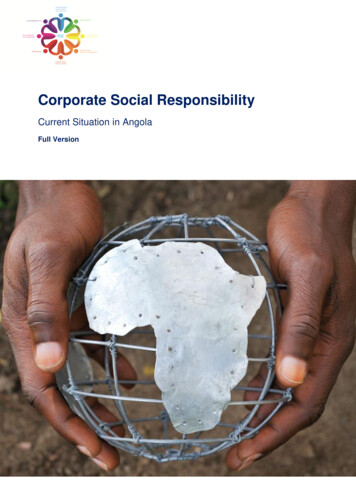
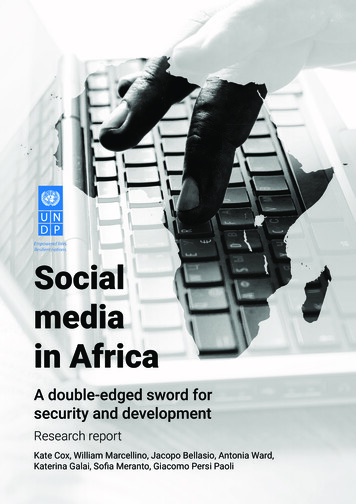
Gender inequalityThe average F/M ratio of total years of education increased from 82 percent in 1990 to 91 percent in 2010. Theshare of countries with F/M ratios at or above 95 percent has risen from 33 percent in 1990 to 52 percent in2010. Further, a large number of countries have achieved or are close to parity (countries are clustered arounda value of 1, indicating equality in total years of education). At the other extreme, the percentage of countriesin which the F/M ratio exceeds 1 has fallen. Overall, it is visually apparent that global gender inequality in totalyears of education is not only falling, but that we are moving toward global convergence with a large numberof countries at or close to parity.Panel B plots the change in the F/M ratio of total years of education from 1990 to 2010 against the 1990 ratio.The negative correlation of these two variables shows that the greatest gains in narrowing educational gapsare countries that started out with the widest gaps. This can be seen clearly in Panel C. The two regions withthe lowest F/M ratios in 1990 — the Africa and Arab regions — have made the largest advances toward genderequality in total educational attainment. Figure 5.2 shows gross secondary enrolment rates with acomparison of gender trends from 1990 to 2010 for the 107countries for which data are available. Panel A in Figure 5.2 showsthe shift in the distribution of the F/M ratio of gross secondaryenrolment rates from 1990 to 2010. The left tail has shifted tothe right, indicating progress in the more unequal countries.Also, countries where the ratio had been greater than one in1990 (in favour of females) have reverted to more gender equaloutcomes (the right tail has shifted left). In fact, a large numberof countries (almost 75 percent, compared to 60 percent in1990) are now centred on a ratio of 1, indicating much greaterglobal equality in secondary educational attainment.There is both greater gender equalityin secondary school enrolmentrates within countries and a globalconvergence of gender equality insecondary school enrolment rates of0.99 in 2010, up from 0.93 in 1990. Thisis good news and reflects solid progressas we move beyond parity in literacyand primary education.Panel B describes in more detail the unevenness with which countries at the lower end of the distributionhave improved gender outcomes. It is noteworthy that cases of retrogression (declines in the F/M ratio) areconcentrated among countries that started out with ratios close to or greater than 1 in 1990.6 In sum, just aswith total years of education, there is both greater gender equality in secondary school enrolment rates withincountries and a global convergence of gender equality in secondary school enrolment rates of 0.99 in 2010,up from 0.93 in 1990. This is good news and reflects solid progress as we move beyond parity in literacy andprimary education. As with total educational attainment, regional gains (shown in Panel C) are greatest forthose that had the lowest ratios in 1990.5.2b.Health outcomesMeasurements of gender gaps in health should control for biological differences so as to isolate the effect ofsocietal influences on gender inequality. To that end, life expectancy measures used here reflect how far away acountry is from the female and male ‘goalposts’ as reflected by the gender-specific maximum life expectanciesachieved in a given year among the countries in the sample.7Data for 185 countries are presented in Figure 5.3 for 1990 and 2010. Panel A presents the global distributionsfor each of these years and indicates a modest improvement in gender ratios at the low end of the distribution(the left tail moves right). For example, in Afghanistan, the ratio rose from 0.49 to 0.53 from 1990 to 2010. TheHumanity Divided: Confronting Inequality in Developing Countries 165
Gender inequalityFigure 5.2. Female and male gross secondary school enrolment rates, 1990 and 2010Panel A. Distributions of F/M ratiosPanel B. Countries ranked by 1990 F/M ratioPanel C. Regional trends in F/M secondary enrolmentNote: 1990 and 2010 represent averages for 1989-91 and 2009-11,respectively.Source: World Bank (2013).166 Humanity Divided: Confronting Inequality in Developing Countries
Gender inequalityFigure 5.3. Trends in female and male life expectancy,1990 to 2010Panel A. Distributions of F/M life expectancyPanel B. Regional trends in F/M life ratios expectancy, 1990 to 2010Source: World Bank (2013).global mean of the life expectancy ratio is 1.002 in 2010, virtually unchanged from 1990 to 2010. Further, theglobal mean obscures significant country-level regional differences. For instance, in 33 countries, the F/M lifeexpectancy ratio was below 95 percent in 1990 and there was no decrease in that number by 2010.Panel B plots regional F/M life expectancy ratios for 1990 and 2010 to the change in the F/M ratio over the timeperiod 1990 to 2010 (see the right axis). The greatest improvements are observable in the Arab region and inAsia and the Pacific, although these changes are very modest, with the ratio below gender parity even by 2010.Humanity Divided: Confronting Inequality in Developing Countries 167
Gender inequalityIn sum, the analysis shows mixed results with regard to global trends in gender equality in capabilities.Educational gaps are closing and there appears to be global convergence in gender educational equality.Results are less positive in the area of health, with life expectancy ratios making uneven progress anddemonstrating greater global divergence.5.3.Gender trends in livelihoodsGender inequality in livelihoods can contribute to inequality in other domains (Collins et al., 1993; Seguino,2013b). Women’s lower incomes and more limited access to other resources required to secure a livelihood suchas land, credit and assets reduce bargaining power within households. As such, women experience restrictedability to exercise their preferences in the gender division of unpaid/paid labour, the allocation of householdincome and their ability to exit harmful relationships.Numerous studies find that employment is a key mechanism for promoting gender equity and that genderequality in this domain can leverage change in other domains (Seguino, 2007; Ridgeway, 2011; Kabeer etal., 2013). Of course, it is not just access to employment or livelihoods, but also the relative quality of jobsthat matters for economic empowerment. Segregation of women in low-wage insecure jobs will do little toimprove their bargaining power if male household members have disproportionate control over good jobs.Data are, however, too sparse to precisely measure women’s access to and control over material resources.Wage data tend to be available primarily for higher-income countriesand there is little globally comparable time-series data on the qualityResults are less positive in the areaand security of employment. Moreover, ownership and control overof health, with life expectancyassets influence bargaining power, but accurate time-series genderratios making uneven progressdisaggregated measures of wealth and other assets are even lesswidely available than employment data. And, despite advances madeand demonstrating greater globalin measuring time use that could shed some light on the householddivergence.division of labour and leisure, we are a long way from having a globaltime-series on this variable.Therefore, the bulk of the analysis is confined to an examination of gender differences in four variables:1) employment-to-population ratios, 15 and older; 2) unemployment rates; 3) wages; and 4) shares of femalesand males employed in the industrial sector to capture gender job segregation in the productive sector ofthe economy.8 Most data extend from 1990 to 2009 or 2010, but unemployment data are available as a globaldataset only up to 2007. This is not deeply problematic, since this date precedes the onset of the most recentfinancial crisis, avoiding a distortion in the assessment of long-term trends.5.3a.Labour force participation and employment ratiosLabour force participation rates measure the proportion of a country’s working-age population that is active inthe productive sphere9 of the economy, either by working or looking for work. Because the desire for paid workis not always fulfilled, it is useful to consider employment-to-population ratios for those 15 and older. Cautionshould be used in making inferences about well-being from these data, since the definition of employment isbroad. Specifically, persons who have performed any work at all in the reference period for pay (of any kind)or profit, or who were temporarily absent from a job for reasons of illness, parental leave, holiday, training orindustrial dispute, are counted as employed. This implies that the economic effect of employment in terms of168 Humanity Divided: Confronting Inequality in Developing Countries
Gender inequalityaccess to a livelihood varies widely, depending on pay, hours of work,volatility of income and other forms of non-wage compensation.Figure 5.4 provides data on F/M employment-to-population ratios for177 countries for 1991 to 2010. As the data in Figure 5.4 demonstrate,gender gaps are closing. The global ratio of F/M employment ratesrose from 0.62 in 1990 to 0.70 in 2010. In Panel A, the left tail of thedistribution of the ratio of F/M employment rates has shifted to theright, that is, the lowest F/M employment ratio in 1990 was a mere9.8 percent (in Jordan). By 2010, the lowest ratio was 14.8 percent (inSyria). That being said, in the overwhelming majority of countries,this ratio was still well below parity in 2010. Only four countries hadreached parity by 2010: Malawi, Rwanda, Burundi, and Mozambique.Most gains have been made in countries that started out with lowratios, which suggests that progress has stalled in countries thatalready had greater gender equality in employment in 1991.Very few countries have achievedparity in employment in contrastto the concentration of mostsecondar y education ratiosaround 1 (where the global meanin 2010 was 0.976 compared to0.693 for F/M employment ratios).Clearly, educational equality is notsufficient for securing gender parityin employment.It is useful to know whether gains in the F/M ratio come at the cost of male employment, an outcome that canbe gender-conflictive at the household level and society-wide. Panel B plots changes in the F/M employmentrate ratio against changes in male employment rates for 1991 to 2010. In 70 percent of the 140 countries inwhich the F/M employment ratios have risen over this period of time, male employment rates have fallen. Thiscan be observed in the northwest quadrant of Panel B, which identifies countries in which male rates havefallen and female-to-male ratios have risen.There are important reasons to be concerned about this phenomenon as an impediment to gender equality.Research indicates that, in recessions, male job loss triggers increased incidence of domestic violence (Manheimand Manheim, 2012).10 Duvvury et al. (2012) have demonstrated the non-trivial cost of domestic violence inViet Nam for individuals and as a share of GDP. Out-of-pocket costs (such as earnings and medical and legalcosts) amounted to 1.4 percent of GDP in 2010, while productivity losses (abused women earn 35 percent lessthan women who do not experience partner violence) totalled 1.78 percent of GDP in that same year. It wouldtherefore be hard to characterize the higher F/M ratios in those countries in which male employment rates havedeclined as an unqualified success or movement toward gender equality. To the extent that such trends arein fact gender-conflictive, they are unsustainable, at least in the medium term and until norms of masculinityabout male breadwinner roles change and adapt.It is clear that gender equality in livelihoods, as measured by employment rates, substantially lags achievementsin education. Figure 5.4, Panel C, plots the distribution of the F/M ratio of secondary school enrolment ratesin 2010 and compares that with the F/M ratio of employment rates for the same year. Very few countries haveachieved parity in employment in contrast to the concentration of most secondary education ratios around 1(where the global mean in 2010 was 0.976 compared to 0.693 for F/M employment ratios). Clearly, educationalequality is not sufficient for securing gender parity in employment. This is confirmed in Panel D, which plotscountries’ change in the F/M ratio of secondary enrolment against the change in the F/M employment rate.There is no evidence of a positive correlation between greater gender equality in education and employment.In fact, as the trend line in Panel D shows, there is a (weak) negative relationship. Humanity Divided: Confronting Inequality in Developing Countries 169
Gender inequalityFigure 5.4. Trends in F/M ratio of employment-to-population ratios, 1991 to 2010Panel A. Distributions of F/M ratiosPanel B. Change in female-to-male and male employmentrates, 1991 to 2010Panel C. A Comparison of capabilities and livelihoods equality:female/male gross secondary enrolment and employment, 2010Panel D. Changes in F/M employment and secondaryenrolmentSource: World Bank (2013).5.3b.Unemployment ratesUnemployment rates are measured relative to the size of the labour force (while employment rates aremeasured relative to the population above a certain age). A person is defined as unemployed if out of work,available for work and actively seeking work in the past period. Gendered trends in unemployment rates aremeasured as the male-to-female (M/F) ratio of unemployment, such that a higher ratio indicates greater genderequality (in favour of women). This is done for consistency with other indicators in this study where increasesin variables can also be interpreted as greater gender equality.170 Humanity Divided: Confronting Inequality in Developing Countries
Gender inequalityGender-disaggregated data areavailable for only 67 countriesfor the period 1990 to 2007.11 Themean global ratio of M/F unemployment rates was 0.861 in 1990,compared to 0.808 in 2007. Panel Aof Figure 5.5 compares each country’s M/F unemployment ratio in1990 to the ratio in 2007. Despitesome progress in countries withalready high M/F unemploymentratios, the majority of countrieshave ratios below 1, indicatingpersistent gender inequality inaccess to work. Moreover, in thosecountries with greater genderequality in M/F unemploymentrates in 1990, there is evidenceof reduced gender equality inmost of these countries by 2007.Panel B examines the percentagepoint change in female and maleunemployment rates and the M/Fratio by region. (The Africa regionis excluded because data for 1997and 2007 are available for onlyone country, Namibia). The Asiaregion stands out as making themost progress in reducing gender gaps in unemployment rates.In Arab countries, the male andfemale rates have fallen proportionately so that there is virtuallyno change in the M/F ratio. Femaleunemployment rates are higherin the ECIS region in 2007 thanin 1990, although the increase inmale unemployment has beengreater so that the M/F ratio hasfallen. In Latin America and theCaribbean, men and women havelower unemployment rates, butmen’s rates have fallen more thanwomen’s, reducing the M/F ratio.12Figure 5.5. Trends in M/F unemployment ratesPanel A. Countries ranked by 1990 F/M ratioSource: Author’s calculations using World Bank (2013).Humanity Divided: Confronting Inequality in Developing Countries 171
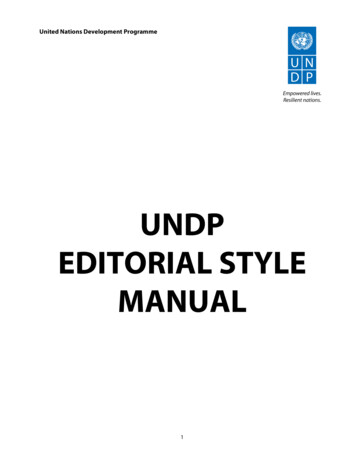
Gender inequalityFigure 5.5. Trends in M/F unemployment rates (contd.)Panel B. Change in male and female unemployment rates from 1990 to 2007Note: In Panel B, the change in the M/F Ratio is shown on the right axis.Source: Author’s calculations World Bank (2013).5.3c.Gender wage differentialsIncome is perhaps one of the most basic indicators of gender inequality. Household bargaining over the allocationof resources, for example, tends to favour the preferences of the adult with the strongest fallback position(that is, the best range of options available to an adult, should the household dissolve). Fallback positions areinfluenced by a person’s income, ownership of assets, and education, among other factors (Doss, 2013).Despite the importance of wage data in assessing gender inequality, the data available is often not comparableacross countries and trend data are severely lacking. Some gender-disaggregated income estimates arepublished in Human Development Reports, but the availability of wage data is a limiting factor in thesecalculations. Because wages are such a key factor in gender equality and mirror societal differences in thevaluation of men and women, we report here available data on gender wage gaps for the most recent year aswell as trend data on gender gaps in median wages of full-time workers for 21 OECD countries, using one ofthe few sources of comparable cross-country earnings data.We report raw gender wage differentials, that is, the simple ratio of average female and male earnings. Rawwage gaps are sometimes criticized because they do not control for ‘productivity’ as measured by job tenureand education, for example, where the residual is a measure of gender pay discrimination originating withinlabour markets. However, there is a broader goal in comparing raw wage gaps. Rather than focusing onlyon whether employers fairly pay employees, raw wage gaps offer an estimate of the structural barriers togender equality in paid labour, via pre-market discrimination in education and training, as well as within labourmarkets via job segregation and wage discrimination.13Panel A in Figure 5.6 shows the economy-wide gender earnings gap in percent for the most recent yearfor 54 countries.14 The narrowest gap (2.9 percent) is found in Slovenia, while the widest gap is in Zambia(45.6 percent). It should be noted, however, that cross-country gaps are not strictly comparable, since wagedata may be for hourly or monthly earnings or may be restricted to just full-time workers. These data are simply172 Humanity Divided: Confronting Inequality in Developing Countries
Gender inequalityFigure 5.6. Trends in gender wage gaps in OECD countriesPanel A. Economy-wide gender wage gaps for mostrecent year, various measuresPanel B. Regional gender wage gapsRegionAfricaArab StatesA&PECISLACDeveloped CountriesNo. ofcountriesGenderwage gap322873236.1%27.5%15.3%21.1%14.3%16.4%Source: See Annex 5.BPanel C. Annual average change in the gender wage gap, 1980 to 2010Note: The data in Panels A and B are for 2009 or closest year. The change in the gender gap in Panel C is the percentage points by which femaleearnings have improved relative to female earnings, from 1980 to 2010, or nearest year. The number of years to eliminate the gap is estimated,based on the annual average decline in the gender wage gap for the period 1980 to 2010 for which there are data. To arrive at an estimateof the years to eliminate the gap, the growth rate of the gender wage gap is calculated and, from this, an estimate of the years to reach wageparity is estimated. Because Portugal and Poland experienced wider gender earnings gaps, the years to eliminate the gap were not calculated.Source: Author’s calculations from data sources listed in Annex 5.A.Humanity Divided: Confronting Inequality in Developing Countries 173
Gender inequalityillustrative of the persistence of gender wage gaps, despite the declines we observe in educational inequality.In the majority of the countries shown here, male wages exceed women’s by more than 15 percent.As the data in Panel B show, the widest gender wage gaps are found in the Africa region (36.1 percent), whilethe narrowest are in Latin America and the Caribbean (14.3 percent). These
one's socioeconomic class, there are systematic gender differences in material well-being, although the degree of inequality varies across countries and over time. As a result, gender inequality is a characteristic of most societies, with males on average better positioned in social, economic, and political hierarchies. For more than