Transcription
CIT UpdateMay / June 2013
Important Notices1
ContentsSlide # CIT OVERVIEW PRIORITIES BUSINESS UPDATES Corporate Finance Trade Finance7-89-1011-12 Transportation Finance13-15 Vendor FinanceBUSINESS UPDATES CONT.CIT BANK16-171819 PRIORITIES & PROGRESS FINANCIAL TRENDS CAPITAL32 KEY MESSAGES33 APPENDIX CONTACTS3-562021-3134-37382
Positioned for GrowthWe Are Well PositionedKey Focus Areas Strong commercial franchises Strategic milestones achieved Completed high cost debt redemption Earning asset growth Internet deposits approaching 6BReduce ExpensesStrong financial position Grow Earning AssetsLiquidity, reserves and capitalProfitability metrics advancing towardtargetsExpand CIT Bank Assetsand FundingIndustry Challenges Slow growth economy Low interest rate environment Regulatory mattersOverviewContinue Progress TowardsProfitability Targets3
CIT – A Unique Franchise and Investment OpportunityBank Holding Company with 100 Years ExperienceCommercial Lending & Leasing SpecialistFocus on Small and Mid-Sized BusinessesGenerate Assets with Strong YieldsStrong Servicing CapabilitiesSolid Capital and Liquidity ProfileOverview4
Significant Progress Over the Past Three YearsHire & RetainKey PersonnelRestructure and RefineBusiness Model Executive Team Build-Out Sold 10B of Non-Core Assets Commercial Asset Growth – 6 Consecutive Quarters Strengthened Core Franchises with New InitiativesDevelop and Implement Planto Reduce Funding Costs Refinanced over 31B of High Cost Debt Reduced Funding Costs from 6.0% to 3.1%Advance Risk Management,Compliance & Control Significant Investment in Infrastructure C&D Removed from CIT Bank Enhanced Stress Testing ProcessExpand CIT BankOverview Commercial Assets 10B Internet Deposit Launch - Online Deposits 5.5B5
2013 Priorities1Prudently Grow Assets2Execute on Expense Initiatives3Continue to Expand CIT Bank4Continue Progress Towards Profitability TargetsPriorities6
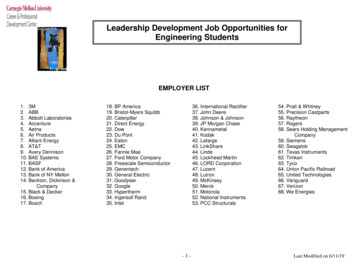
Providing Financial Solutions to Small and Middle Market nFinanceVendorFinanceConsumer(1)Lending, leasing, advisory and otherfinancial services to small and middlemarket companiesFinancing and Leasing Assets(1)Total 35 BillionFactoring, lending, receivablesmanagement and trade finance tocompanies in retail supply chainLending, leasing and advisory services tothe transportation industry, principallycommercial aerospace ( 9B) andrail ( 4B)Trade TradeFinanceFinance 3 2VendorVendorFinanceFinance 6CorporateCorporateCorporateFinanceFinanceFinance 9ConsumerConsumer 4Financing and leasing solutions tomanufacturers and distributors aroundthe globeTransportationTransportationFinanceFinance 14Liquidating pool of governmentguaranteed student loansFinancing and Leasing assets include loans, operating lease equipment and assets held for sale; data as of 3/31/13.Business Updates7
Keys to Success in the Middle MarketConsistencyMaintain long-term customer relationshipsKnowledgeDeep understanding of our customers’ business and industrySolutionsResponsivenessServiceBusiness UpdatesAddress complex financing needs with product expertiseDeliver on commitments and in a timely mannerHigh quality servicing / asset management expertise8
Corporate FinanceValue Proposition Focused on key industries Industry specialization and product expertise Deep relationships with sponsors and clients High quality servicing / portfolio management teamBusiness PrioritiesBusiness Updates Utilize multichannel model to source business and drive sustainable growth Expand lead agency roles to drive fee revenue opportunity Grow assets in CIT Bank Expand our Equipment Finance and Real Estate Finance businesses Continue to evaluate portfolio opportunities that fit our risk / return hurdles9
Focused on Industries in Which We Have Significant ExpertiseIndustrialsCommunications,Information Services& TechnologyBusiness UpdatesEnergyRetail &RestaurantsEntertainment,Sports, and GamingHealthcareCommercialReal Estate10
Trade FinanceValue Proposition Leading Factor Experienced management team with deep industry relationships Provides clients with insight about their retail customers Extensive retail credit database, knowledge and underwriting expertise Located where our clients are locatedBusiness PrioritiesBusiness Updates Grow traditional factoring business in core markets Expand into non-apparel segments Client retention, win new deals Capture international trade flows11
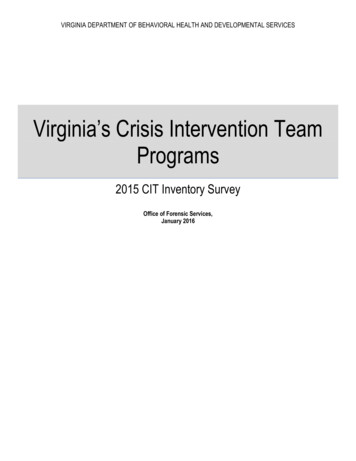
Factoring Volume by Industry2012: 25 billion in Factored VolumeConsumerProducts*12%Footwear7%Furniture,Home Furnishings8%Apparel52%Refactoring9%Textiles12%* Includes carpets, housewares, health & beauty, electronics, luggage, toys, seafood, sporting goods and retail general productsBusiness Updates12
Transportation FinanceValue Proposition Leading aircraft and rail lessor Diverse, modern and well-maintained equipment Strong customer, manufacturer and industry relationships Asset management expertise Proven ability to execute through multiple market cyclesBusiness Priorities Maintain utilization through geographic, customer and equipmentdiversification Acquire in-demand assets at prudent values Growth opportunities beyond the order books: Transportation Lending,Business Air, Maritime Finance Business UpdatesLeverage CIT Bank capabilities13
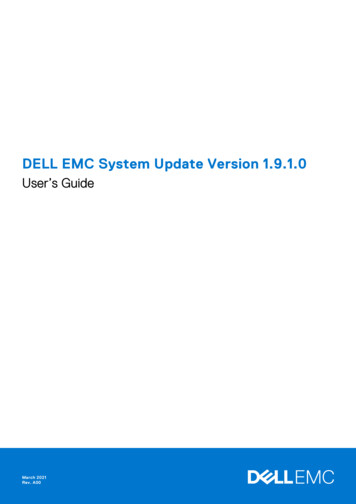
Commercial Air – Consistent Strong Performance Equipment utilization at 100%Equipment Utilization Rates Strong residual realization Net gains on dispositions / sales100%99%98% Attractive order book 100% 100% 100%100%100%100%100%100%Placed all but one of our scheduleddeliveries over the next 12 months2001 New business terms are attractive 99% 99%Typical Yield: 10-15%Typical Term:- Deliveries 7-10 years-200320052007200920111Q'13Note: Utilization rates include committments(1)AnnualOrderOrderBookBook( Billions)2.0Renewals 4-6 620172018*Represents 2Q-4QData as of or for period ended 3/31/13Business UpdatesNote: Amounts listed represent purchase commitments and deposits14
Rail – Improving Business Trends Utilization remains solid at 97%Equipment Utilization Rates Strong residual realization Proceeds well in excess of carryingvalue99%97%98%99%93%95%98%Order typically placed 6-18 months inadvance New business terms are attractive New car deliveries- Typical term: 5 years- 97%95%90% Strategic order book 98% 97%94%2001200320052007200920111Q13Note: Utilization rates include commitmentsAnnual Order Book( Billions)Gross yields: 10%Rental rates remain attractive and havegenerally stabilized at the higher levels0.50.40.12013*20142015*Represents 2Q-4QData as of or for period ended 3/31/13Business Updates15
Vendor FinanceValue Proposition A market leader Long standing relationships Scalable operations Extensive expertise with ability to provide standard or customized products Asset management expertise provides flexibility for end of lease activityBusiness Priorities Target select countries for scalable growth and improved operatingleverage Exiting select countries in Latin America and Asia while evaluatingEuropean platformBusiness Updates Improve margins leveraging CIT Bank Enhance managed services offering and introduce other new products16
Building on a Proven Business ModelVendor utors /Resellers /DealersCommercialCustomers(End Users) Focused on providing small businesses and middle market companies equipmentleasing and value-added services Tailored equipment financing and leasing programs for manufacturers, distributorsand equipment resellers Equipment financing and value-added services throughout the equipment life cyclefrom invoicing to asset dispositionBusiness Updates17
Increasing New Business Volume and Commercial PortfolioCommercial Volume* and Financing and Leasing Assets( Billions)40.03.53.13.02.9Commercial .01.10.91.010.00.55.0-Q1 '10Q2 '10Q3 '10Q4 '10Bank 2.01.7Funded Volume35.0Q1 '11Q2 '11All OtherQ3 '11Q4 '11Aircraft DeliveriesQ1 '12Q2 '12Q3 '12Q4 '12Q1 '13Commercial PortfolioCommercial portfolio grew for the sixth consecutive quarter; 11% increase from a year ago.* Excludes Factoring VolumeBusiness Updates18
Growth Driven by Increased Penetration and ExpansionA Solid Path to Achieve Diverse Deposit FundingBrokered ntBenefitsChannel Broad broker distribution Stable, cost efficient funding Ability to issue longer term CDsenhances ALM matching Diverse and growing market Stable funding source withattractive funding costs Promotes brand recognition Expand touch points withexisting customers New relationships with smallbusinesses Direct access to retail deposits Ability to serve small and midsize businesses Fully integrated Expanding product offering Adding features to drivecustomer retention Requires developingtransactional services(i.e. cash management, letter ofcredit, etc.)Evaluating a “thin” network offinancial centers in strategiclocationsPotential opportunitiesCIT Bank19
Near-term Priorities Provide Additional OpportunityGrow Earning AssetsReduce Expenses Equipment Finance & Real Estate Finance Maritime Financing Investments in Air and Rail Assets Operational efficiencies Professional fees Employee costs Virtually all U.S. loan and lease volumeExpand CIT BankAssets And Funding Expand online deposit products Bank branch strategy NFM at the high end of the rangeContinue Progress TowardsProfitability TargetsPriorities & Progress Targeted expense reductions Pre-tax ROA in-line with target20
Financial Trends
Summary Financial Metrics1Q1320122011Total Assets 44.6 B 44.0 B 45.3 BCommercial Financing & Leasing Assets 31.5 B 30.2 B 27.9 BCash & Short Term Investments 6.9 B 7.6 B 8.4 B20%22%23%Allowance For Loan Losses (ALL) 386 M 379 M 408 MALL to Commercial Finance Receivables2.08%2.21%2.68%Total Equity 8.5 B 8.3 B 8.9 BTangible Book Value Per Share 40.35 39.61 42.23Total Capital17.1%17.0%19.7%Tier 1 Capital Ratio16.4%16.3%18.8%For the period ended:Total Liquidity (1) / Total Assets(1)Liquidity cash (including restricted cash) short term investments unused portion of Bank RevolverFinancial Trends22
Financial Results Reflect Strategic Priorities1Q ‘13Pre-tax Income / (Loss)( 175(43)(200)(400)(412)(600)1H '102H '101H '112H '111H '122H '12Excluding Accelerated Debt FSA, OID and Debt Related Transaction Costs (1)(1)1Q '13GAAPPre-tax income excluding accelerated debt FSA, OID and debt related transaction costs is a non-GAAP measure.See our 1Q13 10-Q for reconciliation of non-GAAP to GAAP financial information.Financial Trends23
Profitability Targets Transitioned to GAAPTargetsAs a % of AEA(GAAP Basis)Net FinanceMarginCreditProvision3.50% - 4.50%4.64% (1) Margin Portfolio and funding mixBenefit from suspended depreciationon assets held for sale Credit(0.50%) - (0.75%)(0.24%) Currently at cycle lows Other IncomeOtherIncomeOperatingExpense1Q13Actuals1.00% - 1.50%0.85%(2.00%) - (2.50%)(2.85%) Pre-TaxIncomeEarningAssetsFees, factoring commissions andgain on sale of leasing equipment“Other” non-spread event driven Operating Expenses2.00% - 2.50%2.19% Impact of restructuring costs Targeted expense reductions Earnings Assets 40B 34B Focus on core businesses Expand through growth initiativesReported 181M Pre-Tax Income in 1Q13(1)Adjusted for debt redemption chargesFinancial Trends24
Net Finance Margin Within Target Range4.43%5.0%3.86%4.41%2.5%4.88%4.64%Q4 '12Q1 '13% of AEA(1)4.03%2.97%1.13%0.0%Q1 '12Q3 '12-1.60%-2.5%-5.0%Q2 '12-4.25%Adjusted NFM Margin (2)GAAP NFM Margin First quarter 2013 net finance margin was 4.43%. Excluding the impact of debt redemptions, adjusted net finance margin was 4.64%, down from4.88% in 4Q12 and up from 2.97% in 1Q12. The sequential quarter decrease reflects lower portfolio yields partially offset by lower fundingcosts.(1)AEA is Post-FSA.Adjusted for impact of accelerated FSA and OID associated with debt redemptions. Adjusted net finance margin is a non-GAAP measure; please see thenon-GAAP disclosures in our first quarter press release for a reconciliation of non-GAAP to GAAP financial information.(2)Financial Trends25
Lower Funding Costs Offset Decline in Portfolio Yields14.0%13.1%12.0%% of AEA .8%3.5%4.0%4.6%4.5%3.5%3.3%Q4 '12Q1 '132.0%Q1 '12Q2 '12Portfolio Yield (1)(2)Q3 '12Cost of FundsAdj Cost of Funds (2)The sequential quarter decrease in portfolio yields reflects: Lower FSA loan accretion Lower rental income Higher Depreciation expenseExcluding the impact of debt redemptions, the sequential quarter decline in funding costsreflects a greater proportion of deposit funding.AEA is Post-FSA.Adjusted for impact of accelerated FSA and OID associated with debt redemptions.Financial Trends26
Extended Liquidity Horizon and Improved Debt Composition( Billions)( Billions)9876543210BHC Maturity: 12/31/2009 (1)BHC Maturity: 3/31/2013 (1)98Revolver*Unsecured1st Lien Term LoanSeries ASeries BOther Debt765432102010 2011 2012 2013 2014 2015 2016 2017 2018 2019 2020 2013 2014 2015 2016 2017 2018 2019 2020 2021 2022 2023 *Denotes total commitment amount under the RevolverCIT Funding Mix: 3/31/2013CIT Funding Mix: 12/31/200910%14%Unsecured1st Lien Term LoanSeries A33%37%Series B30%Other Debt41%Securitizations & OtherAsset-Based Borrowings30%Deposits1%4%Weighted Average Interest Rate (2) 5.97%(1)(2)Weighted Average Interest Rate (2) 3.13%BHC maturity profiles exclude securitizations and secured debt that is primarily repaid with pledged collateral cash flows.Excludes all FSA adjustments and amortization of fees and expenses on long-term debt.Financial Trends27
Strong Credit Metrics With Reserves 2% of Commercial Finance Receivables5001.0%Non-accrual Loans & Net 00.0%Q1 '12Q2 '12Non-accrual LoansAllowance for Loan Losses0.6%Q3 '12Q4 '12Q1 '13Net Charge-offs % to Average Finance ReceivablesAllowance for Loan %1.5%2001.0%1501000.5%5000.0%Q1 '12Q2 '12Allowance for Loan LossesFinancial TrendsQ3 '12Q4 '12Allowance for Loan Losses% to Commercial FRNon – accrual Loans600Net Charge-offs % to AFR( Millions)Q1 '13Allowance for Loan Losses % to Commercial Finance Receivables28
Non-spread Revenue( 89%1.00%100500.50%Q1 '12Q2 '12Q3 '12Q4 '12Q1 '13(50)0.00%Factoring CommissionsGains on sales of leasing equipmentCore NSR (1) as % of AEANon-spread Revenue Item(1)(2)Core NSR as % of AEANon-spread Revenue250Fee IncomeAll Other (2)DriversFactoring CommissionsVolume and Commission RatesFee IncomePortfolio Growth and Market PricingGains on Sale of Leasing EquipmentResidual Realization andPortfolio ManagementCore Non-spread Revenue includes Factoring Commissions, Fee Income and Gain on Sales of Leasing Equipment.All other includes restructuring related items or items that are episodic in nature including: Gain/(loss) on loan and portfolio sales, counterparty receivable accretion,recoveries of loans charged off pre-emergence and loans charged off prior to transfer to held for sale, gain/(loss) on investment sales, gain/(loss) on derivatives andforeign currency exchange, impairment on assets held for sale and other revenues.Financial Trends2929
Operating Expenses( Millions)300.03.0%250.0Operating 0.021422021322150.01.0%0.5%0.00.0%Q1 '12All Other OpexQ2 '12Deposit RelatedQ3 '12Restructuring ChargesQ4 '12Q1 '13% to AEA ex. Restructuring Charges Headcount down from 4Q12 by 70 and 140 since 3Q12. 1Q13 operating expense included impact of seasonal compensation-related items. 4Q12 included a benefit of 10M related to a loan workout-related settlement.Financial Trends30
Expense Initiatives to Reduce Run RateReported Expense CategoryInitiativesCompensation& BenefitsBack Office Synergies & Process Enhancements Address Sub-scale Offices and Product Lines Reduce External Resources for Capital Planning &Risk InfrastructureModified benefit plans Consolidated some offices Exiting small countries in Asia and LatinAmerica Evaluating European Vendor platformFinancial Trends Actions Taken Vendor Management & OutsourcingReduced headcount by 140 since Sept2012Other Benefit Plan Modifications ProfessionalFees2013 Focus Targeted actions phased in over 2013 Achieve operating leverage as earningassets grow Selective investments in growth initiatives3131
Framework for Capital ActionsTotal Risk Based Capital 8.4 BillionRegulatoryCapitalRequired(13%)Prospective Capital ActionsCapital Deployment Inorganic/organic growth Asset mixPotentialExcessCapital Generation Reported earningsCapital Return Share repurchase DividendFinancing & Leasing Assets 35BRWA 49BRWA Factor1.41xLong TermOptimize Capital CompositionData as of or for period ended 3/31/13Potential excess includes impact of accelerated FSA on debt redemptionCapital32
Positioned for GrowthWe Are Well PositionedKey Focus Areas Strong commercial franchises Strategic milestones achieved Completed high cost debt redemption Earning asset growth Internet deposits approaching 6BReduce ExpensesStrong financial position Grow Earning AssetsLiquidity, reserves and capitalProfitability metrics advancing towardtargetsExpand CIT Bank Assetsand FundingIndustry Challenges Slow growth economy Low interest rate environment Regulatory mattersKey MessagesContinue Progress TowardsProfitability Targets33
Appendix34
Consistent Access to Bond MarketSeries C and Unsecured Debt Issuance Summary( 0%201712-Aug1,2505.000%2022Total11,7505.111%2011 Weighted Average Coupon - 5.73% / Weighted Average Maturity – 4.4 years2012 Weighted Average Coupon – 4.98% / Weighted Average Maturity – 6.1 yearsAppendix35
Capital Position is Strong Capital ratios well above regulatory commitments and economic requirementsCIT (1)CIT Bank (1)Peers (2)Tier 1 Capital16.4%20.0%10-14%Total Capital17.1%21.3%13-16%Leverage Ratio18.4%19.4%7-12% Economic capital allocation framework Implemented January 2011 Holistic view of risk:Capital Allocations by SegmentCorporate Finance Asset Model Credit Operational Interest Rate FX & other “Excess” capital held at corporate Ongoing review/refinement of modelsTrade Finance(3) 11% 9%Transportation Finance 15%Vendor Finance 10%ConsumerTotal Requirement (inc Corporate)Memo: Regulatory Commitment 2% 12%13%(1)As of 3/31/13Peers consist of a mix of regional banks, BHC’s and specialty finance companies sourced from publically available filings and Bloomberg as of 3/31/2013.(3) Capital expressed as a percentage of lending and leasing assets plus off balance sheet RWA for business segments and is subject to change. Totalrequirement and regulatory commitment expressed as a % of RWA.(2)Appendix36
Path to Improving Credit RatingsS&P RatingsDBRS RatingsMoody's RatingsCounterparty Ratings (long-term/short-term)BB-BB / R-4Ba3Bank Credit FacilityBB-BBB (low)Ba3Outlook/TrendPositivePositiveStableFOCUS AREAS:PROGRESS / STATUSProfitability Financial Flexibility Franchise remains strong: asset growth, competitive positioning and agency rolesSuccessful execution of newer initiatives such as real estate finance, equipmentfinance and maritime financeStrong net finance margin driven by significant reduction in borrowing costsOngoing initiatives to reduce operating expenses to align with target range Demonstrated access to cost efficient funding through multiple markets andgeographiesBalance sheet mostly unencumberedReplaced restrictive debt covenants with investment grade style covenantsStrong liquidity runway with smoothed out debt maturity stacksAsset Quality Non-accrual loans and net charge-offs at historical and cyclical lowsAchieving growth while maintaining a balanced risk appetiteRole of Bank Nearly all of CIT’s U.S. lending and leasing volume being originated in CIT BankCommercial assets of 10 billionStrong growth in deposits which now account for 33% of CIT’s total fundingContinuing to expand online deposit product offeringsResolution of the WrittenAgreement with FRBNY Management believes it has satisfied the requirements of the Written Agreementand continues to communicate closely with the FRBNYAppendix37
CIT Investor Relations – Key ContactsKen BrauseExecutive Vice President212-771-9650ken.brause@cit.comBarbara CallahanSenior Vice n ShahDirector973-597-2603bhavin.shah@cit.com38
Expand lead agency roles to drive fee revenue opportunity Grow assets in CIT Bank Expand our Equipment Finance and Real Estate Finance businesses Continue to evaluate portfolio opportunities that fit our risk / return hurdles Business Updates . 10 Focused on Industries in Which We Have Significant Expertise Communications, Information Services & Technology Energy Healthcare Entertainment .