Transcription
MORTGAGE MONITORJULY 2018 REPORT
MORTGAGE MONITORJULY 2018 OVERVIEWMORTGAGE MONITORCONTENTS3JULY FIRST LOOK RELEASE4THE REPERFORMING LOAN MARKET11Q2 EQUITY UPDATE16Q2 MORTGAGE ORIGINATIONS20APPENDIX23DISCLOSURESConfidential, Proprietary and/or Trade Secret TM SM Trademark(s) of Black Knight IP Holding Company, LLC,and/or an affiliate. 2018 Black Knight Financial Technology Solutions, LLC. All Rights Reserved.Each month, the Black Knight Mortgage Monitor looks at a variety of issues related to the mortgagefinance and housing industries.This month, as always, we begin with a review of some of the high-level mortgage performancestatistics reported in the company’s most recent First Look report, with an update on delinquency,foreclosure and prepayment trends. We then revisit the reperforming loan (RPL) market, examiningits make-up and performance, while taking a closer look at how modification characteristics canimpact re-default and prepayment risk among this population.Next, leveraging our loan-level mortgage data alongside the Black Knight Home Price Index,we take a look at the current equity landscape, breaking down the slowing rate of equity growthin Q2. In addition, we refresh our analysis of how rising interest rates are impacting how, andif, borrowers tap into available equity. Finally, we undertake an analysis of Q2 2018 first lienmortgage originations with a focus on both purchase origination lending and the changingmake-up of the refinance market.In producing the Mortgage Monitor, Black Knight’s Data & Analytics division aggregates, analyzesand reports upon the most recently available mortgage performance data from the company’sMcDash loan-level database. For more information on McDash or Black Knight Data & Analytics ingeneral, please call 844-474-2537 or email mortgage.monitor@bkfs.com.JULY 2018 2
MORTGAGE MONITORJULY 2018 FIRST LOOK RELEASEHere we have an overview of findings from Black Knight’s ‘First Look’ at July mortgage performance data. This informationhas been compiled from Black Knight’s McDash loan-level mortgage performance database. You may click on each chart tosee its contents in high-resolution.JULY OVERVIEW STATS-3.4%11%0.73%CHANGE INDELINQUENCY RATETOTAL FORECLOSURESTARTSACTIVEFORECLOSURESAt 3.6%, July’s delinquency rate wasthe lowest in 12 yearsWhile it seems large, July’s spike inforeclosure starts is coming off a17-year low in JulyIncreased starts and fewer completionsresulted in a slight uptick in the numberof loans in active foreclosureCures of mortgages past due asa result of last year’s hurricaneshelped drive the declineStarts were still down 9.4% fromlast yearJuly’s increase was just the secondmonthly rise in 3 yearsConfidential, Proprietary and/or Trade Secret TM SM Trademark(s) of Black Knight IP Holding Company, LLC,and/or an affiliate. 2018 Black Knight Financial Technology Solutions, LLC. All Rights Reserved.July’s 64K decline in delinquenciesmore than offset a 2K increasein foreclosures, dropping the totalnumber of noncurrent loans to a12-year low.JULY 2018 3
JULY 2018 THE REPERFORMING LOAN MARKETMORTGAGE MONITORHere, we examine the make-up and performance of the reperforming loan (RPL) market, while taking a closer look at howmodification characteristics can impact re-default and prepayment risk among this population. This information has beencompiled from Black Knight’s McDash loan-level mortgage performance database. You may click on each chart to see itscontents in DING REPERFORMINGREPERFORMING LOANBYREPERFORMINGBY MONTHSMONTHS REPERFORMING4-5 Mos6-11 Mos12-23 Mos»» The RPL market remains strong, with nearly 1.84M borrowers nowcurrent on their mortgages who have been at least 120 days pastdue at some point, representing 306B in outstanding debt24 Mos2,000,000»» The population is nearly 30K larger than at the start of 2018,as delinquencies due to the 2017 hurricane season havebegun to reperform1,500,000»» Some 60% of RPLs have been reperforming for more than24 months, a volume that’s held relatively steady over thepast 3.5 years at just over 1.1M 3M.3M.3M.2M1.1M»» 475K ( 25%) of existing RPLs have been current for the past5 years, while nearly half have been reperforming for at least3 6As of Month»» The average RPL has been reperforming for 39 monthsRPLs that have been reperforming for morethan 24 months are nearly 75% less likely todefault in coming months than those that justbecame reperformingConfidential, Proprietary and/or Trade Secret TM SM Trademark(s) of Black Knight IP Holding Company, LLC,and/or an affiliate. 2018 Black Knight Financial Technology Solutions, LLC. All Rights Reserved.JULY 2018 4
JULY 2018 THE REPERFORMING LOAN MARKETMORTGAGE MONITORDISTRIBUTIONDISTRIBUTION OFOF INATIONYEARBY ORIGINATION DOWNOFOF REPERFORMINGREPERFORMING ,000250,000100,000»» Very few RPLs were originated after the financial crisis, with just 11% from 2010 orlater vintages»» Two-thirds of existing RPLs were originated from 2004-2008, with over half originatedin 2004, 2005 or 2006Confidential, Proprietary and/or Trade Secret TM SM Trademark(s) of Black Knight IP Holding Company, LLC,and/or an affiliate. 2018 Black Knight Financial Technology Solutions, LLC. All Rights 0062005200420032002200120000 200050,0000PLS/OtherFHA/VAGSEPortfolio»» The largest share of RPLs (550K ) reside in legacy private labeled securities (PLS)»» FHA/VA RPLs follow, with GSE loans a close third; relatively few RPLs are heldin portfoliosJULY 2018 5
JULY 2018 THE REPERFORMING LOAN MARKETMORTGAGE MONITORDISTRIBUTION OFOF REPERFORMINGREPERFORMING LOAN MARKETDISTRIBUTIONMARKET BYBY CURECURE TYPETYPENot ModifiedModified OnceModified Multiple Times75% of RPLs have been modified at least once, with18% having been modified multiple times50%40%»» 45% of RPLs are operating under proprietary modifications,while 30% are HAMP mods30%»» 25% of reperforming loans became reperforming without theloan terms being modified»» Such distinctions are noteworthy due to performancevariations among these different segments of the RPL market20%10%0%ProprietaryHAMPConfidential, Proprietary and/or Trade Secret TM SM Trademark(s) of Black Knight IP Holding Company, LLC,and/or an affiliate. 2018 Black Knight Financial Technology Solutions, LLC. All Rights Reserved.Not ModifiedJULY 2018 6
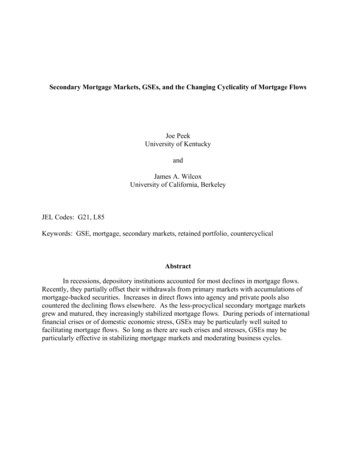
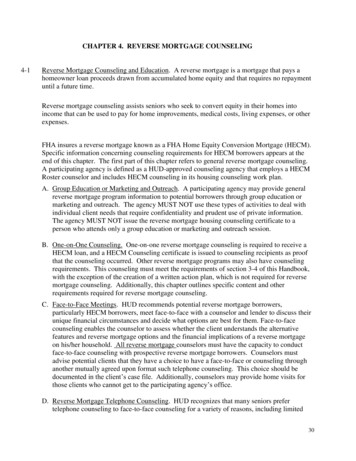
JULY 2018 THE REPERFORMING LOAN MARKETMORTGAGE MONITORSTATICOF REPERFORMINGREPERFORMINGLOANSSTATIC POOLPOOL COMPARISONCOMPARISON 122013-122014-122015-12RPL performance has remained noticeablystable over the past 3 years, suggesting that2016-12the market has become more predictable in its14%re-default patterns12%Re-Default Rate10%»» A static pool analysis of RPL re-default rates shows that as theRPL market matured, overall re-default rates declined8%6%»» The waves seen in the chart reflect impacts to the RPL marketfrom the 2017 hurricane season4%»» Due to different starting points for these static pool analyses, thehurricane impact hits each cohort in 12-month differences2%0%0612182430364248Number of MonthsAbove: Static pool comparison of the active RPL market entering each of the past 5 years.Re-defaults are considered to be any loans that became seriously delinquent, involuntarily liquidated or needed to be re-modified. The analysis tracked cumulativere-default activity within the 48-month period following each pool's creation.Confidential, Proprietary and/or Trade Secret TM SM Trademark(s) of Black Knight IP Holding Company, LLC,and/or an affiliate. 2018 Black Knight Financial Technology Solutions, LLC. All Rights Reserved.JULY 2018 7
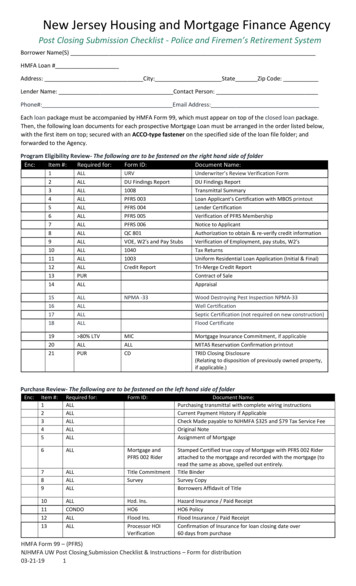
JULY 2018 THE REPERFORMING LOAN MARKETMORTGAGE MONITORREPERFORMINGLOANLOAN RE-DEFAULTRE-DEFAULT AR)(STATICPOOLANALYSISOFOFREPERFORMINGREPERFORMING LOANS2017CALENDARYEAR)RPL - HAMP ModifiedRPL - Non ModifiedRPL - Proprietary ModAs a whole, RPLs still exhibit higher default ratesthan the traditional loan market; in fact, our 2016-Non-RPL12 static pool analysis showed approximately 7X4.5%higher RPL re-default rates4.0%3.5%3.0%»» Levels of RPL re-default activity between HAMP and proprietarymodifications have normalized to some degree2.5%2.0%»» Modified RPLs in general still have a much higher re-default riskthan non-modified RPLs1.5%1.0%»» The converging of performance is noteworthy, as mostearly analyses showed HAMP modifications significantlyoutperforming proprietary modifications0.5%0.0%012345678910Number of MonthsConfidential, Proprietary and/or Trade Secret TM SM Trademark(s) of Black Knight IP Holding Company, LLC,and/or an affiliate. 2018 Black Knight Financial Technology Solutions, LLC. All Rights Reserved.1112131415161718»» The convergence is likely due to a number of factors, includingearly recidivism/poor performance among proprietarymodifications, with later stage performance becoming moreclosely aligned with HAMP mods, along with reduced benefitsper capita among more recent HAMP modsJULY 2018 8
JULY 2018 THE REPERFORMING LOAN MARKETMORTGAGE MONITORPREPAYMENT RATERATE (SMM) BYTYPEPREPAYMENTBY REPERFORMINGREPERFORMINGLOANLOANTYPENon-RPLRPL – HAMP ModifiedRPL – Non Modified2.5%RPL – Proprietary Mod»» In 2012, traditional loans prepaid at over 7X the rate of RPLs,due to factors such as equity positions, credit qualifications andmodified RPL rates eliminating interest rate incentive to refinance»» That gap has since narrowed significantly; in 2018 a traditionalloan is just 40% more likely to prepay than an RPL – down from740% 5 years ago2.0%»» Historically, non-modified RPLs were more likely to prepay andHAMP-modified RPLs least likely1.5%»» That delta has also narrowed as interest rate step-ups broughtHAMP RPL interest rate incentive more in line with proprietarymods and non-modified mortgages1.0%»» Improving equity positions and credit quality along with interestrate step ups are likely contributors to rising RPL prepays,while rising interest rates have had the opposite effect on thetraditional loan market0.5%0.0%As of QuarterOverall RPL prepayment speeds have increasedabout 60% from 5 years ago, while prepaysamong non-RPL loans have been cut by morethan halfConfidential, Proprietary and/or Trade Secret TM SM Trademark(s) of Black Knight IP Holding Company, LLC,and/or an affiliate. 2018 Black Knight Financial Technology Solutions, LLC. All Rights Reserved.JULY 2018 9
JULY 2018 THE REPERFORMING LOAN MARKETMORTGAGE MONITORPREPAYMENTREPERFORMINGPREPAYMENT RATERATE (SMM) BYBY YEARSYEARS REPERFORMINGNon-RPL 1 Year1Year2-3 Years2.5%4Years5 Years»» When breaking down the RPL market by the number of monthsa loan has been reperforming, it's clear that RPL length impactsprepayment probability»» Borrowers who have been reperforming for less than a year areleast likely to prepay, while those who have been prepaying for1-4 years have very similar prepayment speeds2.0%1.5%RPLs that have been reperforming for more than 5years have been prepaying at nearly an identical1.0%rate to the non-RPL market over the past 12 months0.5%0.0%As of QuarterConfidential, Proprietary and/or Trade Secret TM SM Trademark(s) of Black Knight IP Holding Company, LLC,and/or an affiliate. 2018 Black Knight Financial Technology Solutions, LLC. All Rights Reserved.JULY 2018 10
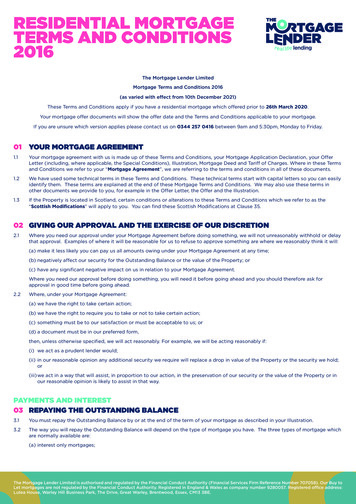
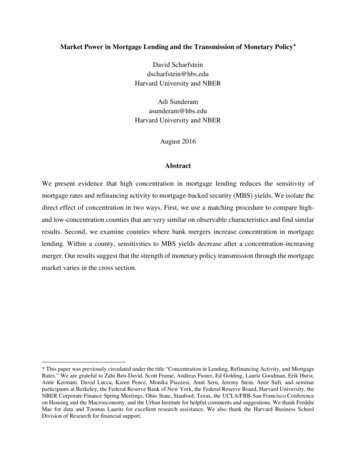
MORTGAGE MONITORJULY 2018 Q2 EQUITY UPDATEHere, leveraging the latest home price data, we take a look at the current equity landscape, breaking down the slowing rateof equity growth in Q2. In addition, we refresh our analysis of at how rising interest rates are impacting how, and if, borrowerstap into available equity. This information has been compiled from the Black Knight Home Price Index and the company’sMcDash loan-level mortgage performance database. You may click on each chart to see its contents in high-resolution.TAPPABLEU.S. MORTGAGEMORTGAGEHOLDERSHOLDERSTAPPABLEEQUITYEQUITY OFOF U.S. 7,00044M homeowners now have equity to tapvia cash-out refinances or HELOCs while stillretaining at least 20% equity in their homes 5,000 6,061»» Despite slower home price growth, tappable equity surpassed 6 trillion for the first time in Q2 2018»» There is now 2.7X as much tappable equity as at the bottom ofthe housing market in 2012 and 21% more than at the pre-crisispeak in 20062018-06 5,4252017-12 4,6902016-12 4,1222015-12 3,5572014-12 3,123 2,2342011-122013-12 2,3702010-12 2,557 2,6032009-122012-12 2,8302007-122006-122005-12 2004-12 1,0002008-12 3,755 2,000 4,627 3,000 4,914 4,000 4,285Tappable Equity in Billions 6,000Equity available on mortgaged residential properties before reaching a current CLTV of 80%.Confidential, Proprietary and/or Trade Secret TM SM Trademark(s) of Black Knight IP Holding Company, LLC,and/or an affiliate. 2018 Black Knight Financial Technology Solutions, LLC. All Rights Reserved.JULY 2018 11
JULY 2018 Q2 EQUITY UPDATEMORTGAGE MONITORTAPPABLEQUARTERTAPPABLEEQUITYEQUITY GROWTHGROWTH BYBY QUARTERTappable equity grew by 256B in the second 400Bquarter, bringing total growth for the year to 636B 256B 350B 300B»» 2018’s YTD growth in tappable equity is slightly ahead ofthe 628B seen in the first half of 2017 250B 200B»» Q1 and Q2 are historically responsible for the majority ofa given year's tappable equity growth, corresponding toseasonal increases in home values 150B»» Despite Q2's 256B growth in tappable equity being the 4thstrongest quarterly gain since the housing recovery began,comparing Q1 and Q2 of 2018 to historical years reveals astrong, unseasonal slowing in Q2 2018 100B 50B onfidential, Proprietary and/or Trade Secret TM SM Trademark(s) of Black Knight IP Holding Company, LLC,and/or an affiliate. 2018 Black Knight Financial Technology Solutions, LLC. All Rights Reserved.Q1Q2Q32016Q4Q1Q2Q32017Q4Q1Q2Q3Q42018JULY 2018 12
JULY 2018 Q2 EQUITY UPDATEMORTGAGE MONITORTAPPABLEEQUITYBY BYMSATAPPABLEEQUITYMSAAfter seeing home prices rise by 2.5% in Q1 2018 –the highest first quarter rate in 5 years – the market 206Bshifted noticeably in Q2 81B 140B 161B 401B 120B 171B 575B 811B 131B»» U.S. home prices rose 2.7% in Q2 2018, which marked thelowest second quarter gain in the past 5 years»» This is despite Q2's historical role as the leading quarter forhome price growth 106B»» Though the West continues to lead the nation in terms oftappable equity, California stands out here 96B 122BConfidential, Proprietary and/or Trade Secret TM SM Trademark(s) of Black Knight IP Holding Company, LLC,and/or an affiliate. 2018 Black Knight Financial Technology Solutions, LLC. All Rights Reserved.»» Nationally, the annual rate of home price appreciation hasslowed from 6.7% Y/Y in February 2018 to 6.1% as of June»» Whereas home price gains nationally were higher in Q2 thanQ1, in California, the average home price gain was actuallydown 43% in what is typically the highest growth quarter ofthe yearJULY 2018 13
JULY 2018 Q2 EQUITY UPDATEMORTGAGE MONITORQUARTERLYQUARTERLY GROWTHGROWTH ININ AVERAGEAVERAGE HOME UITY)LARGESTVOLUMEVOLUME OFEQUITY)Q1 2018Slowing price gains in the nation’s most equity-richmarkets drove the overall decline in equity growthQ2 2018Los Angeles, CASan Francisco, CA»» The top 10 markets accounted for 60% of equity growth inQ1, but due to slowing home price gains, they made up just33% of Q2 growthNew York, NYSan Jose, CASeattle, WA»» Even more noteworthy than California's overall decline in homeprice growth (down 43% Q/Q) was the more than 80% drop inaverage home price gains in the highest-priced areas of thestate (top 20% of homes by price)Washington, DCSan Diego, CAChicago, ILBoston, MADallas, TX - 10,000 20,000 30,000 40,000 50,000Confidential, Proprietary and/or Trade Secret TM SM Trademark(s) of Black Knight IP Holding Company, LLC,and/or an affiliate. 2018 Black Knight Financial Technology Solutions, LLC. All Rights Reserved. 60,000 70,000 80,000 90,000 100,000»» Seattle saw a 60% drop in the average home price increasefrom Q1 to Q2 in one of the nation's most expensivemarkets, likely due at least in part to rising interest rates andtightening affordabilityJULY 2018 14
JULY 2018 Q2 EQUITY UPDATEMORTGAGE MONITOREQUITYTAPPEDTAPPEDBYBY QUARTERQUARTEREQUITY 80Equity Tapped via HELOC ( B)Equity Tapped via Cash-out Refi ( B)% of Available Equity Tapped2.0% 70At just 1.13%, Q2’s 65B was the lowest shareof available equity withdrawn since Q1 2014,another period of rising rates 601.5% 50 401.0% 30 200.5% 10 00.0%Source: HELOC volumes sourced from Equifax Credit Trends report. ‘Equity Tapped via HELOC ( B)’ estimated by applying refi blend of HELOC originations observed in McDashHome Equity loan level database.»» The 65B in equity withdrawn via cash-out refinances orHELOCs – while up seasonally from Q1 – was down by morethan 3.0% from last year»» Withdrawals via new HELOCs were up 20% Q/Q (a typicalseasonal shift) in Q2, coming in at an estimated 42B, butwere down 4.0% from the same time last year»» Cash-out refinance withdrawals dropped 14% Q/Q to 25.6B,the lowest such quarterly total in 2 years»» From Q1 to Q2, interest rates on 30-year mortgages increasedby more than 0.25% while the average rate on a HELOCincreased by 0.30%»» At this time last year, 1.36% of available equity was beingtapped, suggesting rising interest rates may be suppressingequity utilization by approximately 17%»» As a result, homeowners tapped into an estimated 13 billionless equity than they might have otherwise, including 8B inwould-be HELOC originations and 5B fewer cash-outrefinances in Q2 2018 aloneConfidential, Proprietary and/or Trade Secret TM SM Trademark(s) of Black Knight IP Holding Company, LLC,and/or an affiliate. 2018 Black Knight Financial Technology Solutions, LLC. All Rights Reserved.JULY 2018 15
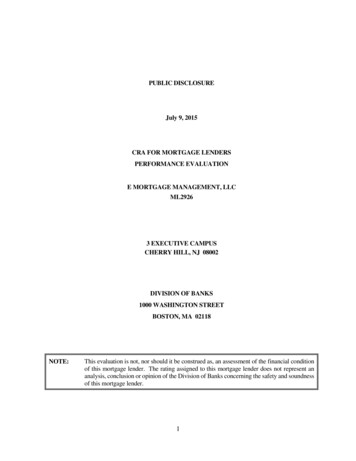
Here, we undertake an analysis of Q2 2018 first lien mortgage originations with a focus on both purchase origination lendingand the changing make-up of the refinance market. This information has been compiled from Black Knight’s McDash loanlevel mortgage performance database. You may click on each chart to see its contents in high-resolution.44%30%34%40% 400.020% 200.0»» First lien mortgage originations rose 20% from Q1 due to seasonal growth in purchaselending, but were down 7% from Q2 2017 by dollar volume»» Refinance originations dropped to 117B for the lowest quarterly total since Q1 2014,and at 484K, Q2 saw the fewest refinance loans originated in more than 17 years»» Purchase lending saw a slightly lower-than-average 49% seasonal increase from the firstquarter and remained relatively flat from one year ago»» Refinance loans made up just 25% of Q2 originations by volume, the lowest suchshare in 18 006Q22005Q22004Q20%2000Q210% 100.0 0.017%30% 300.025%61%2013Q243%60%50%47%67%50% 500.02008Q250%51% 600.02007Q260%46% 700.02006Q270%45% 800.070%80%2005Q2Refinance44%Purchase 900.051% 1000.02012Q2REFINANCE SHARESHARE OFOF MORTGAGEMORTGAGE RTERCOMPARISONCOMPARISON SINCESINCE TURNTURN OF CENTURY)CENTURY)(SECONDFIRST LIENLIEN MORTGAGEMORTGAGE ORIGINATIONSORIGINATIONSININ BILLIONS BILLIONS52%MORTGAGE MONITORJULY 2018 Q2 ORIGINATIONS»» The number of purchase originations rose 2.0% year-over-year, and purchase lendingwas up marginally by volume as wellConfidential, Proprietary and/or Trade Secret TM SM Trademark(s) of Black Knight IP Holding Company, LLC,and/or an affiliate. 2018 Black Knight Financial Technology Solutions, LLC. All Rights Reserved.JULY 2018 16
JULY 2018 Q2 ORIGINATIONSMORTGAGE MONITORFIRSTACTIVITYFIRST LIENLIEN REFINANCEREFINANCE ACTIVITYCash-out Refi Originations (left axis)Rate/Term Refi OriginationsCHANGEORIGINATIONS–– BYBYCOUNTCOUNTCHANGE ININ REFINANCEREFINANCE ORIGINATIONSCash-out Share of First Lien Refis (right 1201220132014201520162017»» Rate/term refinances fell 43% from Q1 and 62% from last year; the 106K suchoriginations in Q2 2018 is the lowest quarterly total on record and 33% below theprevious low in Q3 2008, in the midst of the financial crisis»» In comparison, cash-outs fell a much more modest -11% Q/Q and -21% Y/Y, which limitedoverall refinance origination decline to -21% Q/Q and -26% Y/YConfidential, Proprietary and/or Trade Secret TM SM Trademark(s) of Black Knight IP Holding Company, LLC,and/or an affiliate. 2018 Black Knight Financial Technology Solutions, LLC. All Rights Reserved.Change from Q1 2018Change from Q4 2017All Refinance OriginationsRate/Term Refis-11%-21%-21%-26%-43%0%2018»» After steadily increasing in recent years, the cash-out share of refinance originationsnow stands at 78%Cash-out Share of First Lien Refis (By Count)78%1.50.0Cash-out 2Q3Q4Q1Q2Q3Q4Q1Q2Q3First Lien Refinance Originations in Millions2.0-62%»» The average loan age prior to a cash-out increased from 77 to 83 months, with anaverage 68K pulled out ( 2200 less than in Q1 2018) via cash-out refi»» The average resulting LTV post-cash-out was 66.1%, while the average credit scoredropped from 742 to 736»» The average borrower had to increase their interest rate by 0.1% to access theequity in their home, the first time the average borrower needed to increase theirrate since 2006JULY 2018 17
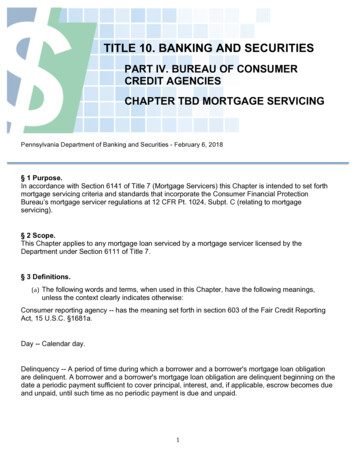
JULY 2018 Q2 ORIGINATIONSMORTGAGE MONITORBORROWERSINCENTIVE TOTO REFINANCEREFINANCEBORROWERS WITHWITH 75BPS75BPSOFOF INTERESTINTEREST RATERATE INCENTIVENUMBER(IN MILLIONS)NUMBEROFOFREFINANCEREFINANCE CANDIDATESCANDIDATES (INRefinance Candidates (left axis)(BY CREDIT SCORE BUCKET)(BY CREDIT SCORE BUCKET)FHLMC 30-Year Fixed Interest Rate (right 3M0.022M0.011M0M912K654K801K790K680-720720-7590 620620-679760 »» Flattening interest rates toward the tail end of Q2 have been enough to hold refinanceincentive in the market relatively steady»» Another 2.3M borrowers have interest rate incentive to refinance with credit scoresbelow 720, roughly 800K of whom have scores between 680 and 720»» An estimated 2.3M potential refinance candidates remain, near a 10-year low forthis population»» Given a shrinking refi market, the prevalence of these mid-level, "borderline" creditborrowers and the economic benefits associated with rate/term refinances, we maysee more willingness to loosen the credit boxConfidential, Proprietary and/or Trade Secret TM SM Trademark(s) of Black Knight IP Holding Company, LLC,and/or an affiliate. 2018 Black Knight Financial Technology Solutions, LLC. All Rights Reserved.JULY 2018 18
JULY 2018 Q2 ORIGINATIONSMORTGAGE ash-out RefisRate/Term RefisServicers' customer retention challenges30-Year Interest 10%3.5%0%3.0%continue to be magnified by rising interest ratesFHLMC 30-Year Fixed RateServicer Retention RateOverall Retention Rate»» The overall retention rate (share of borrowers/clients retainedby servicers through refinance) fell 5% from late 2017 throughMay 2018 alongside a sharp rise in 30-year interest rates»» Among borrowers taking out new rate/term refinance loans,retention rates fell by over 10% during that same span, withservicers now only retaining 20% of such borrowers, thelowest share in nearly 11 years»» Perhaps more noteworthy is the lackluster retentionrates among borrowers cashing in on equity, which havebeen roughly half that of rate/term refinances over the pastfew years»» With the cash-out share of refinance activity nearing 80%,it's crucial for banks and non-banks alike to start sourcingorigination leads from their own pool of serviced loansConfidential, Proprietary and/or Trade Secret TM SM Trademark(s) of Black Knight IP Holding Company, LLC,and/or an affiliate. 2018 Black Knight Financial Technology Solutions, LLC. All Rights Reserved.JULY 2018 19
JULY 2018 APPENDIXMORTGAGE MONITORJULY 2018 DATA SUMMARYSummary 57%0.73%-13.61%-27.32%Foreclosure Starts48,30011.03%-22.47%-9.38%Seriously Delinquent (90 )or in Foreclosure1.59%-2.21%-21.91%-14.99%New Originations(data as of 76%0.78%Foreclosure ,50047,80050,20045,20054,70053,300Seriously Delinquent (90 )or in .71%4.55%4.44%4.40%3.93%3.90%Confidential, Proprietary and/or Trade Secret TM SM Trademark(s) of Black Knight IP Holding Company, LLC,and/or an affiliate. 2018 Black Knight Financial Technology Solutions, LLC. All Rights Reserved.562KNEW ORIGINATIONSTOTAL DELINQUENCIES562KNew OriginationsJULY 2018 20
JULY 2018 APPENDIXMORTGAGE MONITORLOAN COUNTS AND AVERAGE DAYS DELINQUENTMonthTOTAL ACTIVECOUNT30 DAYS60 DAYS90 366527,919Confidential, Proprietary and/or Trade Secret TM SM Trademark(s) of Black Knight IP Holding Company, LLC,and/or an affiliate. 2018 Black Knight Financial Technology Solutions, LLC. All Rights Reserved.FCTotalNon-CurrentFC linquent Delinquentfor 90 for 35925Ratio of 90 to ULY 2018 21
JULY 2018 APPENDIXMORTGAGE MONITORSTATE-BY-STATE RANKINGS BY NON-CURRENT LOAN POPULATIONStateDel %FC %NC %Year/YearChange in NC%StateDel %FC %NC %Year/YearChange in NC%StateDel %FC %NC %Year/YearChange in * - Indicates Judicial StateConfidential, Proprietary and/or Trade Secret TM SM Trademark(s) of Black Knight IP Holding Company, LLC,and/or an affiliate. 2018 Black Knight Financial Technology Solutions, LLC. All Rights Reserved.JULY 2018 22
JULY 2018 DISCLOSURESMORTGAGE loads/2018/09/BKI MM-Disclosures.pdfYou
» A static pool analysis of RPL re-default rates shows that as the RPL market matured, overall re-default rates declined » The waves seen in the chart reflect impacts to the RPL market from the 2017 hurricane season » Due to different starting points for these static pool analyses, the hurricane impact hits each cohort in 12-month .