Transcription
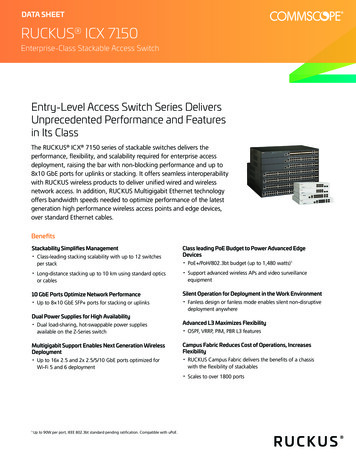
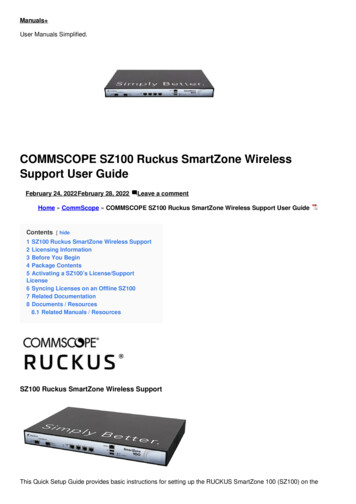
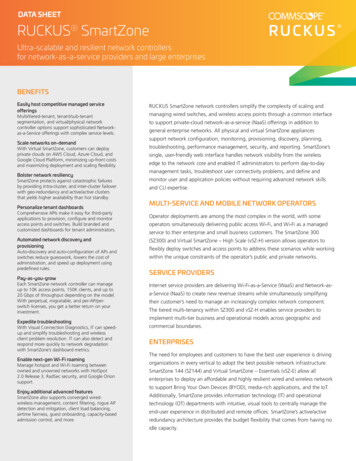
DATA SHEETRUCKUS AnalyticsNetwork analytics and assurance for RUCKUS enterprise networksIT teams often lack the tools to ensure required network service levels inan environment of ever-increasing user connectivity demands and networkcomplexity. Helpdesk tickets from user connectivity issues pile up while ITstruggles to glean insight from network data. When service issues affect userBENEFITS Accelerates network and clienttroubleshooting action to fix the problem.Provides comprehensive visibility intonetwork operations experience, IT often lacks a way to identify root causes and define a course ofIdentifies, prioritizes and recommendsRUCKUS Analytics from CommScope is a cloud service for network analyticsand assurance. Powered by machine learning (ML) and artificial intelligence(AI), it helps you get the most from your RUCKUS network. The service gives ITcomprehensive visibility into network operations. It accelerates troubleshootingand helps IT teams meet their network service level agreements (SLAs).remediation steps for service issues Helps IT teams improve the userexperienceThe service identifies network assurance incidents, classifies them by severity,Works with your RUCKUS network toautomatically validate service levelsautomatically monitors network health relative to configurable thresholds.traces root causes and makes specific recommendations for remediation. ItAdvanced client troubleshooting and incident analytics give IT teams the powerto address service issues for individual users and devices. RUCKUS Analytics workswith your RUCKUS network to allow it to self-validate—without the need foroverlay sensors. You can identify and address many service issues before they evenaffect users.The service also delivers robust reporting and informative dashboards. Createcustom dashboards and data visualizations with the Data Explorer tool—andflexibly explore your network data warehouse with drag-and-drop ease.This detail from the maindashboard shows a circlepacking chart. It provides agraphical representation ofthe network hierarchy, withcolor coding that indicateswhere network incidents haveoccurred. You can easily zoom infor a closer view by clicking onan area of the chart.
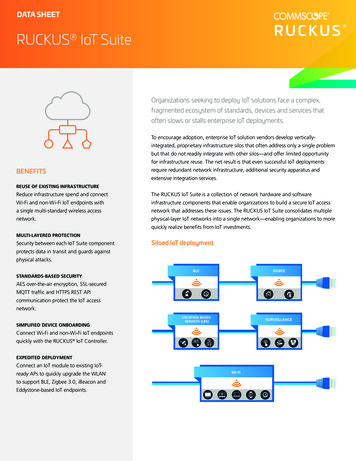
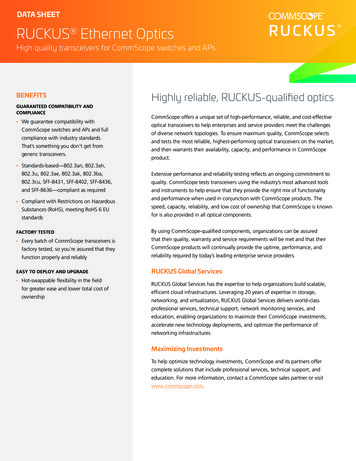
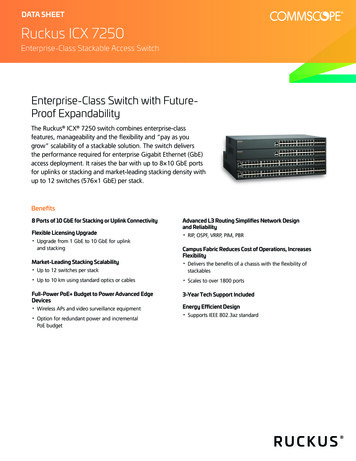
Customer premisesSmartZoneclusterRUCKUS AnalyticsCompute Fast re bi-directionaltelemetry and controlRUCKUS Analytics aggregates raw data and automaticallytransforms it into deep insight into network operations. This MLand AI-powered analytics service frees you from a wide variety ofmanual tasks associated with network assurance. Comprehensivenetwork intelligence helps you deliver on network SLAs in supportof users, devices and applications.RUCKUS Analytics automatically measures the impact ofSmartZone configuration changes on network performance.You can observe the effects of each change on a portion of thenetwork before rolling it out more broadly. This helps to avoidStreaming telemetry with a modern data stack foradvanced analyticsRUCKUS Analytics is designed for the unique data profilegenerated by network devices. On-premises controllers securelyconnect to the cloud and stream lightweight health KPIs andtelemetry. The high-performance data stack ingests and processesthe data to serve as the basis for queries, reports and baselinemetrics.Network health monitoringfully rolling out changes that might have an adverse effect onThe service automatically monitors network health, with annetwork performance.overview tab that provides a high-level summary view. Selectother health monitoring tabs to view metrics in specific healthIt scales to support the largest deployments—expanding capacitycategories: connection, performance and infrastructure. Networktransparently to meet your requirements. RUCKUS Analyticshealth monitoring gives you instant visibility into metrics like APsupports two control and management architectures: SmartZone*service uptime, time to connect, connection success rate, clientfor on-premises and private cloud/data center deployments, andthroughput and more. You define the service levels you want toRUCKUS Cloud for cloud-managed deployments.measure against. For example, you might want to set the “timeRUCKUS Analytics has an industry-unique combination ofto connect” goal at five seconds—RUCKUS Analytics will tell youattributes:what percentage of the time the network meets that goal. The Automated data baselining and insights driven by ML and AI Health and SLA monitoring Powerful, holistic troubleshooting Automatic classification of incident severity Service validation without the need for an on-site data collectoror overlay sensors service lets you readily demonstrate to others in your organizationperformance to SLAs.Incident analytics powered by machine learning andartificial intelligenceRUCKUS Analytics enables machine-assisted proactive networkingfor your RUCKUS deployment. It automatically establishes anormal range of behavior for each network element, withoutGranular access to raw data with deep exploration and customrequiring any input from IT. Then it uses machine learning todashboardsautomatically identify service incidents related to connectivity,12 months of storage with flexible data reportingperformance and infrastructure that affect user experience. It usesartificial intelligence to classify service incidents by severity—soyou can address the highest-priority issues first.* SmartZone 5.1.2 or higher is required.2RUCKUS ANALYTICS Network analytics and assurance for RUCKUS enterprise networks
The system provides details for each incident, including:Automatic service validation Root cause and recommended actionRUCKUS Analytics works with your RUCKUS network to Affected areas (client operating system types, access pointautomatically validate service levels without the need for overlaymodels, firmware versions, WLANs and more)sensors. Access points act as virtual clients to identify possible Other impact details, including severity, client impact andduration List of impacted clients Presentation of the underlying data that drives the incidentRUCKUS Analytics dramatically reduces mean time to resolutionfor service incidents. It can eliminate some helpdesk tickets byletting you address issues before they affect users. By addressingthe root cause for one incident, you can avoid other incidents thatmight arise from that cause. Service providers can realize instantbusiness value when level 1/2 helpdesk personnel can remediatecomplex network problems using RUCKUS Analytics.Powerful client troubleshootingWith simple and flexible search and a holistic clienttroubleshooting page, RUCKUS Analytics gives you a completepicture of client experience for easy connectivity and userexperience diagnostics, including:service disruptions, often before they affect users. The system canperform a variety of tests, including: WLAN, LAN and WAN connectivity EAP, RADIUS, DHCP and DNS Ping, traceroute and speed test (upload/download)Melissa—your own AI-powered virtual networkassistantRUCKUS Analytics includes a powerful AI-powered virtual networkassistant called Melissa. Combining an intuitive interface withadvanced natural language processing, Melissa determines theadministrator’s intent in posing a wide variety of inquiries anddelivers highly insightful responses. IT teams save valuable timewith ready access to information that helps them manage networkoperations—without the need for any coding.IT service management integrationRUCKUS Analytics integrates closely with leading IT servicemanagement (ITSM) products from ServiceNow and Salesforce to Successful, slow and failed connections Disconnect events Roaming events and failed roamsit is flagged for the helpdesk to address. Without such a system in Connection quality (RSSI, MCS, client throughput)place many issues that affect user experience go unreported. Network incidents affecting users, with links to see incidentPrepackaged reports and dashboardsdetailsinitiate helpdesk tickets automatically and let IT get a head startin resolving them. This ensures that, when a service issue occurs,A wide variety of standardized reports provides visibility intoClient troubleshooting is a powerful tool that helps younetwork performance, traffic patterns, application usage andunderstand and address issues affecting specific clients on themore. Summary views provide high-level information, and younetwork.can drill down to the level of individual network components anddevices. Examples of standardized reports include: Network—traffic and client trends, top devices, top SSIDs,traffic distribution and more Client—reports by OS and device manufacturer, top clients byusage, client trends, session details and more3RUCKUS ANALYTICS Network analytics and assurance for RUCKUS enterprise networks
Inventory—AP, switch and controller count, models, firmware,status and more Cloud deployment for scalability and expandabilityAs a hosted service, RUCKUS Analytics relieves you of the burdenApplication—top apps and their usage trends, top app groupsof managing an in-house network analytics platform. Because theand usage, top ports and moresystem stores data in the cloud, capacity is virtually limitless andDevice-specific reports—complete visibility and usage reportsexpands instantly as your network environment generates morefor clients, APs and switchesdata. You don’t have to worry about running out of capacity,forecasting disk utilization or figuring out when to add resources.The service lets you download reports as raw data, a PDF file or aRUCKUS Analytics does that for you transparently using containersCSV file. Forward the results to stakeholders inside or outside theand microservice orchestration. The software does not require anorganization.on-site data collector. Cloud deployment enables the machinelearning algorithms embedded in RUCKUS Analytics to provideData Explorer—custom dashboards, datavisualizations and moreThe RUCKUS Analytics Data Explorer tool lets you create customdashboards to dissect and analyze data from your networkecosystem. Drag-and-drop dashboard creation makes it easy todesign views tailored to your needs. You can easily position andreposition dashboard tiles, edit tiles at will and toggle betweenmaximum insight.Customers can designate a third party—such as a RUCKUSnetworking solution provider—to administer their account.Managed service providers (MSPs) can manage multiple endcustomer RUCKUS Analytics accounts from within their ownaccount.different views.Analyze and filter data by dozens of dimensions—including time,device type, traffic type, application, AP group, controller, accesspoint, band, SSID and more. Use multiple visualization methodsto view your data, including pivot tables, line charts, bar charts,sunbursts, Sankey diagrams, stacked charts and heat maps. DataExplorer puts your full network data warehouse at your fingertipsso you can answer any number of network questions.4RUCKUS ANALYTICS Network analytics and assurance for RUCKUS enterprise networks
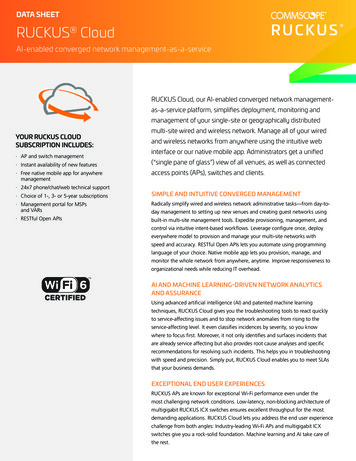
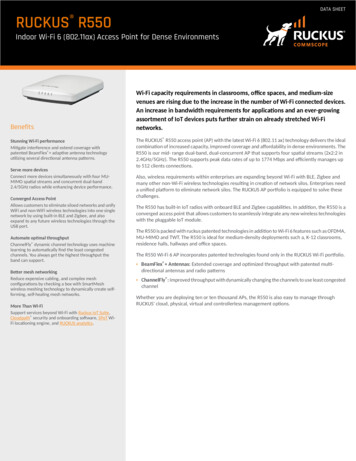
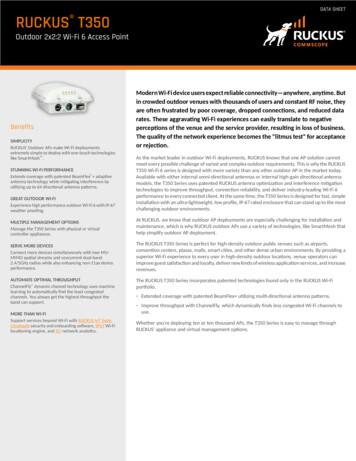
Health Monitoring RUCKUS Analytics automatically monitors network health across a variety of metrics in three areas:connection, performance and infrastructure.Incident Analytics RUCKUS Analytics provides a root cause analysis of each service incident with specific recommendationsfor how to resolve the issue.5RUCKUS ANALYTICS Network analytics and assurance for RUCKUS enterprise networks
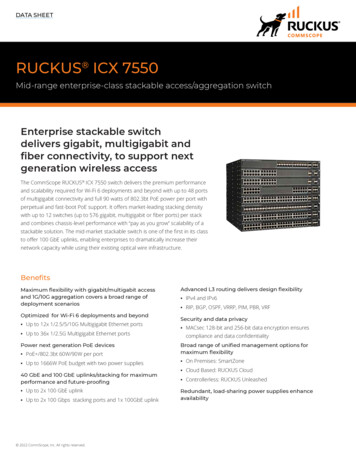
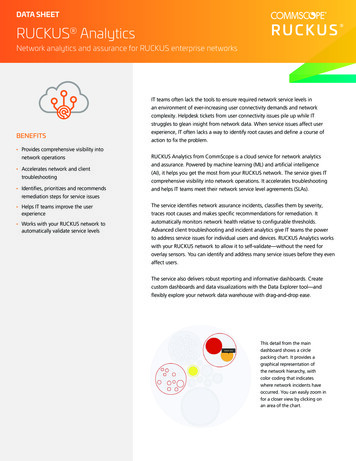
Advanced Client Troubleshooting Lets you investigate and resolve issues that have impacted a specific client on the network.Data Explorer The Data Explorer tool in RUCKUS Analytics lets you create custom dashboards with drag-and-drop ease.6RUCKUS ANALYTICS Network analytics and assurance for RUCKUS enterprise networks
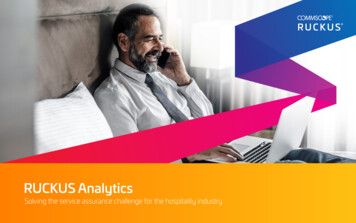
Service Validation RUCKUS Analytics works with your RUCKUS network to allow the network to automatically validatenetwork service levels.Reporting RUCKUS Analytics includes a wide variety of pre-packaged reports. This report shows metrics related to theRUCKUS switches in the network.7RUCKUS ANALYTICS Network analytics and assurance for RUCKUS enterprise networks
SpecificationsSecurity, privacyand dataprotection All traffic to and from the cloud is encryptedOnly AP, switch, and client management traffic are sent to the cloudClient data traffic stays local (broken out to local LAN and sent through existing firewall)All data stored in RUCKUS Cloud is encrypted at restRUCKUS offers EU-located data centers for European customersLatest security patches are automatically updatedRole-based access control is provided for administrative privilegesAdmin can grantand revoke access topartners and RUCKUSsupportAbility to choose thehosting region for yourservice (USA, EU orAsia)Cloud datacenter Hosted in USA, Europe and Asia on world-class IAAS provider with:– ISO 27001 information security certification– SSAE-16, SOC 1, SOC 2 and SOC 3 certifications– Stringent physical, data access and data disposal security measures– Per-tenant migration capabilities– Green carbon-neutral facilities– Dedicated inter-DC fiber connectivitySLA 99.9 percent network availability (does not include planned maintenance, includingperiodic software upgrades and other pre-announced activities)Support 24x7 chat/web/phone support included for the term of the subscriptionPart numbers CLD-ANAP-1001– RUCKUS Analytics one-year subscription for one Cloud- or SmartZone-managed AP orICX switchCLD-ANAP-3001– RUCKUS Analytics three-year subscription for one Cloud- or SmartZone-managed APor ICX switchCLD-ANAP-5001– RUCKUS Analytics five-year subscription for one Cloud- or SmartZone-managed AP orICX switchCLR-ANAP-1001– RUCKUS Analytics one-year renewal for one Cloud- or SmartZone-managed AP or ICXswitchCLR-ANAP-3001– RUCKUS Analytics three-year renewal for one Cloud- or SmartZone-managed AP orICX switchCLR-ANAP-5001– RUCKUS Analytics five-year renewal for one Cloud- or SmartZone-managed AP or ICXswitch View RUCKUS Cloudprivacy policycommscope.comVisit our website or contact your local CommScope representative for more information. 2021 CommScope, Inc. All rights reserved.Unless otherwise noted, all trademarks identified by or are registered trademarks, respectively, of CommScope, Inc. This document is for planning purposes only and is not intended tomodify or supplement any specifications or warranties relating to CommScope products or services. CommScope is committed to the highest standards of business integrity and environmentalsustainability with a number of CommScope’s facilities across the globe certified in accordance with international standards, including ISO 9001, TL 9000, and ISO 14001.Further information regarding CommScope’s commitment can be found at y-and-Sustainability.PA-114203.3-EN (05/21)
for on-premises and private cloud/data center deployments, and RUCKUS Cloud for cloud-managed deployments. RUCKUS Analytics has an industry-unique combination of attributes: Automated data baselining and insights driven by ML and AI Health and SLA monitoring Powerful, holistic troubleshooting