Transcription
Higher Education Politics & EconomicsPeer-Reviewed Article Higher Education Politics & EconomicsVolume 7, Issue 1 (2021), pp. 1-32ISSN: 2162-3104 (Print), 2166-3750 (Online)doi: 10.32674/hepe.v7i1.3688ojed.org/hepeTHE RELATIONSHIP BETWEEN STATEFUNDED MERIT SCHOLARSHIPS ANDSTUDENT LOAN DEBTMary BorgUniversity of North FloridaMary BealUniversity of North FloridaHarriet StranahanUniversity of North FloridaABSTRACTThis article uses a sample of 13,643 students attending a 4-year state university inFlorida to estimate a selection-bias corrected quantile regression of loan debt atgraduation. The study investigates whether the debt levels of students who receivedthe Florida Bright Futures (FBF) scholarship are significantly different from the debtlevels of students who did not receive the scholarship. The empirical results showthat FBF recipients accumulate higher debt, on average, than similar students whodid not receive the award. However, for students from the lowest income householdsand with the highest levels of debt, the FBF scholarship award does reduce the overallamount of debt they accumulate.Keywords: student debt; merit-based scholarships; public financeOver the last few decades there has been a dramatic shift in the way higher educationhas been financed in the US. Since 2000, most state and local governments havesignificantly reduced funding for higher education resulting in significant tuitioninflation and an explosion of federally subsidized student loan debt that has generatedconcern across many sectors (Federal Reserve Bank, 2019). Multiple states, includingFlorida, have further shifted the funding formula for undergraduate student aid toward1
Higher Education Politics & Economicsmerit-based scholarships for high performing graduating seniors (Lederman, 2018).Not surprisingly, research suggests this pronounced shift from need-based to meritbased funding benefits higher socioeconomic families (Heller & Marin, 2004).The phenomenon of rising student debt has been highly publicized by the media.In 2020, Americans owed over 1.64 trillion in student loan debt, an amount that isapproximately 587 billion more than credit card debt (Studentloanhero.com, 2020).The Pew Research Center reported that student loan originations increased by 326%between 1990 and 2014 (Fry, 2014). During roughly the same time, forty-one statesand the District of Columbia instituted merit-based scholarships for collegeundergraduate students beginning with the Georgia Helping Outstanding PupilsEducationally (HOPE) scholarship in 1993. In 2018, 15 states and the District ofColumbia awarded a larger amount of money in merit-based scholarships than inneed-based scholarships, and Georgia awarded no need-based scholarships at all. Itis interesting to note that these states, except Alaska, Utah, and the District ofColumbia, rank in the bottom half of the median household income distribution forUS states and territories in 2018. They are as follows (with their rank in the incomedistribution shown in parentheses): Alaska (9), Arkansas (50), Florida (38), Georgia(29), Kentucky (45), Louisiana (48), Mississippi (51), Montana (39), Nevada (30),New Mexico (49), South Carolina (43), South Dakota (33), Tennessee (42), Utah(13), West Virginia (52), and the District of Columbia (1) (Inside HigherEd, 2018).It seems ironic that the states with the greatest financial need are the most likely toaward more merit-based aid than need-based aid.Using a sample from a large public university where 50% of students qualify forFlorida Bright Futures (FBF) merit-based scholarships and 50% do not, our studyexplores whether college graduates who did not qualify for the merit scholarship inhigh school accrue significantly more debt during college. For students who doqualify for FBF scholarships, we examine which groups of students are more likelyto use the scholarship funds to avoid debt.LITERATURE REVIEWWe could find very little previous research that examined the relationship betweenstudent debt burdens and merit-based scholarships, but we did find plenty of researchon the two subjects separately. Therefore, we discuss the topics separately and thenmake some conjectures about how the two might be related.Several studies examine how student loan debt affects the behavior of studentswhile they are in college. Poplaski et al. (2019) found that students who had studentdebt were more likely to report being financially stressed during college, and theywere also more likely to report that the stress was affecting their overall health. Theauthors hypothesize that this may be part of the reason that several researchers (Grosset al., 2013; Jackson & Reynolds, 2013, Letkiewicz et al., 2015; Robb et al., 2012,Robb, 2017) have found that students with high debt burdens take longer to finishtheir degrees and are more likely to drop-out before finishing.The consequences of student debt for recent college graduates are not any better.Baum and Saunders (1998) found that the students with the highest levels of debt2
Higher Education Politics & Economicswere less likely to go to graduate or professional school after graduation. Researchalso shows that highly indebted students were more likely to live with their parentsafter graduation and were not able to move to other cities to further their education orfind better employment (Millet, 2003; Houle & Warner, 2017). Several studies foundthat graduates who took out more debt were also less likely to be married, less likelyto have a child, and were more likely to have a negative net worth (Aldo et al., 2019;Min & Taylor, 2018; Velez et al., 2019). Research has also shown that heavilyindebted students were not as likely to buy homes as their less-indebted counterparts(Anderson et al., 2021; Baum & O’Malley, 2002; Mezza et al., 2020). Despard et al.(2016) found that debtors from low- and moderate-income households had a 51%higher probability of experiencing material hardships, a 19% higher probability ofexperiencing medical hardships and a 27% higher probability of experiencingfinancial difficulty after graduation than their counterparts without student debt.These studies conclusively show that graduating with a substantial amount of studentdebt causes financial hardships that affect the most important life decisions of youngadults.There are also several studies that show racial and ethnic differences in thedistribution of student debt. Several recent studies show that Black students are morelikely to take on debt and take on heavier debt burdens when they do acquire debtthan their counterparts from other races (Goldrick-Rab et al., 2014; Grinstein-Weisset al., 2016; Houle, 2014; Jackson & Reynolds, 2013; Kim et al., 2016; Jimenez &Glater, 2020; Price, 2004;). In fact, Jackson and Reynolds (2013) found that Blackstudents disproportionately have higher student debt loads, are more likely to acquiredebt and not finish college and are more likely to default on their loans. GrinsteinWeiss et al. (2016) found that the average amount of debt held by Black students intheir sample of low- and moderate-income students was 7721 more than the debt ofthe non-Black students. A study by Elliot and Lewis (2015) found that 77% ofHispanic college graduates had student debt compared to 64% of White graduates and59% of Asian graduates. Only Black students surpassed them, with 82% havingstudent debt upon graduation (Elliot & Lewis, 2015). Beal et al. (2019) found racialand ethnic differences in both the decision to borrow and the amount of the studentloan when the student did borrow. Asian students were significantly less likely to takeout student loans, but if they did take out a loan, there was no difference in the amountof loans they acquired. Hispanic students were as likely to take out a loan as otherstudents, but when they did, the loan was significantly smaller. Blacks weresignificantly more likely to take out a loan, but when they did, it was also significantlysmaller.The socio-economic status (SES) of the student’s household, which includes bothincome and parents’ education, affects a student’s probability of attending collegeand the probability of acquiring student debt during that process. As expected, thereis an inverse relationship between parents’ income and the amount of student debtthat their children acquire (Houle, 2014). This is because higher income householdshave been shown to provide more money for their children’s education, to save morefor their children’s college education, and to spend more for the room and board andsocial activities of their college-age children (Choy & Berker, 2003; Flaster, 2018;3
Higher Education Politics & EconomicsNam, 2021; Quadlin & Conwell, 2020; Schoeni & Ross, 2005; Steelman & Powell,1991)Similarly, higher parental education levels are also associated with lower levelsof student debt (Flaster, 2018; Houle, 2014). One reason may be because more highlyeducated parents are better equipped to navigate the labyrinth of financial aid formsand scholarship applications that accompany college attendance (Hossler & Vesper,1993), and they are also more aware of true college costs and tuition discountingschemes (Grodsky & Jones, 2007). More educated parents are also more likely tofinancially plan, save, and go into debt for their children’s college educations (Cha etal., 2005; Charles et al., 2007; Cataldi et al., 2018; Steelman & Powell, 1991).From this brief review of the literature related to student loan debt, we concludethat student loan debt has a detrimental effect on the social and economic outcomesof students. Furthermore, the students who are most likely to suffer from thesedetrimental effects are students of color and students who come from low SEShouseholds. The next section of the literature review explores the research on meritbased scholarship aid with attention given to what the research might say aboutwhether the growth in merit-based aid exacerbates or alleviates the negative effectsof student loan debt.The research on merit-based scholarships is diverse. Much of it has examined theenrollment effects that the aid has had for in-state colleges and universities. Programslike Georgia’s HOPE scholarship increase the likelihood that young people willattend college and also cause students to switch from two-year colleges to four-yearcolleges (Dynarski, 2000, 2002). Similar place-based scholarship programs like theTennessee Promise and the Kalamazoo Promise scholarships had the same effect onenrollment and four-year college preference (Bartik et al., 2021; Nguyen, 2020; Pageet al., 2019;). Many of the Promise scholarships also increased the likelihood thatminority and disadvantaged students will complete college (Bartik et al., 2021; Bell& Gándara, 2021). There is also evidence that students who receive state merit-basedscholarships are more likely to attend an in-state university (Cornwell et al., 2006;Nguyen, 2020) Cornwell et al. (2006). found that two‐thirds of the increase in thefirst-year classes in Georgia’s universities over the period from the beginning of theHOPE Scholarship (1993 to 1997) was due to students remaining in-state for college.There is also evidence that students who receive state merit-based scholarships toattend in-state schools are more likely to remain in the state after graduating(Harrington et al., 2016; Hickman, 2009).The research on the distributional effects of state merit-based aid finds that muchof the benefit goes to students who could already afford to attend college (Cornwell& Mustard, 2007; Heller, 2006, Pulcini, 2018; Gándara & Li, 2020). For example,Binder et al. (2002) found that White students received disproportionately more NewMexico Lottery Success Scholarships than students of other races and ethnicities. Inaddition, Binder and Ganderton (2004) found that for every low-income studentawarded a New Mexico Lottery Success Scholarship almost three more went tostudents with higher family incomes. Florida’s Bright Futures Scholarships andMichigan’s Merit Award Scholarships go primarily to the students who attend thehigh schools in the state who had the highest college-participation rates before the4
Higher Education Politics & Economicsimplementation of the merit-based scholarship programs (Heller & Rasmussen,2002). These distributional effects are made even worse by the fact that many of thesestate merit scholarships are funded with regressive lottery taxes, leading some to callthem Reverse Robinhood mechanisms (Borg & Borg, 2007). Stranahan and Borg(2004) analyzed the net distributional effect of the Florida Bright Futures Scholarshipby estimating separate equations for household lottery expenditures and FBFscholarship benefits. They found that high socioeconomic households received a netprogram benefit of almost 2,200; whereas low SES households incurred a netprogram loss of almost 700.A recent study from New Mexico found that in addition to detrimental monetaryeffects, lottery-funded scholarships may also cause academically challenged studentsto drop-out of college. Erwin and Binder (2020) found that academically wellprepared students increased their likelihood of graduating from the flagshipUniversity of New Mexico by 10 percentage points since the institution of the NewMexico Legislative Lottery Scholarship (NMLLS) in 1997, but academically lessprepared students decreased their likelihood of graduating by 11.6 percentage points(a 38.8 percent decrease) over the same period. The authors speculate that thescholarship program, which effectively erased the difference in tuition at two- andfour-year colleges, may have caused weaker students to enroll in the more prestigiousfour-year institution, for which they were not prepared. On a somewhat brighter note,Klein and Perry-Sizemore (2017) found that high school graduation rates improvedsignificantly more over the period from 1990 to 2000 in the states that instituted meritbased scholarships versus the states that did not. They hypothesize that possibility ofreceiving a merit-based college scholarship caused students to work harder in highschool.The literature on the distributional effects of merit-based aid does not offer muchhope that the increasing trend in merit-based aid may somehow offset the increasingburden of student debt. However, the two studies that we found that lookedspecifically at the effect of merit-based scholarships on student debt burdens cause usto be somewhat optimistic. Chen and Weiderspan (2014) found that Georgia’s statefunding of merit-based aid programs reduced the debt burdens of Georgia HOPEScholarship recipients. Beal et al. (2019) found similar results when they examinedthe debt burdens of Florida Bright Futures scholarship recipients. Their study foundthat students who received FBF scholarships had a significantly lower probability ofhaving to take out a loan, and if they did take out a loan, the amount of the loan wassignificantly lower than those of students who had not received a FBF scholarship.What neither of these studies address, however, is whether the merit scholarshipsreduce the debt burden for all students uniformly or whether the greatest debt reliefis received disproportionately by students with different household income and debtlevels. Our research adds to the extant literature by estimating a quantile regressionthat sheds light on the relationship between merit-based scholarship funding andstudent loan debt for students with different levels of household income and totaldebt.5
Higher Education Politics & EconomicsMETHODOur study estimates student loan debt using a selection bias corrected quantileregression for a sample of 13,643 students attending the University of North Florida,one of the twelve universities in the Florida State University System. We were ableto create the dataset because we were granted access to student data that includeddemographic and income information obtained from the students’ Free Applicationfor Federal Student Aid (FAFSA) records. The dependent variable is the amount ofloan debt accrued at the time of graduation (year 2014). Whereas other studiesanalyzing student loan debt use OLS regression methods, quantile regression analysisallows a multidimensional view of whether the impact of a variable, its β value,differs across quantile levels of debt. We assess whether student socioeconomic andfinancial characteristics impact student borrowing behavior and if this effect differsfor students facing different levels of debt at graduation. The model results in aconsistent set of coefficients which may differ for each quantile. Cobas-Valdés et al.(2017) point out that quantile regression allows researchers to focus on the data at thetails of the distribution, which is often the most important target of policy. Forexample, we may be more concerned about the factors adversely impacting the mostindebted students, rather than the average student.We estimate a linear quantile regression of loan debt at the 10th, 25th, 50th, 75th,and 90th quantiles with sample selection bias following Buchinsky (2001). Becausewe observe debt only for students whose benefits of borrowing outweigh the costs,we include a selection bias correction in the estimation. The conditional observedloan debt (y) for each quantile Ɵ is given by Equation 1 where x is the vector ofexplanatory variables and hƟ (x1, γ0) is the selection bias correction. Quantileregression analysis allows us to test whether the impact of a variable, βƟ, differsdepending upon the total amount of debt accrued.QuantƟ (y x2) x'βƟ hƟ (x1, γ0)(1)Our dataset contains student financial and demographic information obtainedfrom the Free Application for Federal Student Aid (FAFSA) as well as informationon students’ Florida Bright Futures Scholarship awards and Pre-Paid Collegefunding. We investigate the impact of academic and socioeconomic characteristicson a student’s willingness to accrue more debt. We examine whether the impact ofthese predictors differs across debt quantiles. Finally, we analyze whether Florida’smerit-based scholarships have any effect on student debt burdens and, if so, whetherthe impacts differ for students facing different amounts of debt. We further examinehow Florida’s merit-based scholarship awards interact with household income toimpact student debt.6
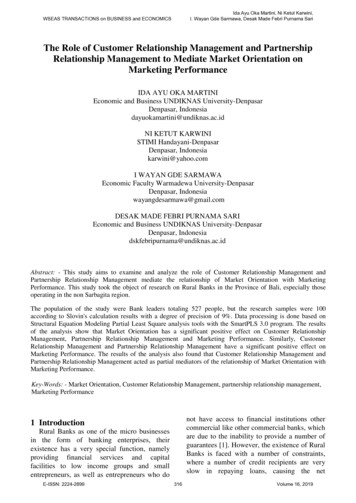
Higher Education Politics & EconomicsRESULTSTable 1 contains the descriptive statistics for all variables in the sample and for thesubset of students who have loan debt. The results show that about 62% of the sampleare female and 72% are White with an average age of 23. Almost 60% of the studentsare classified as dependents for federal tax purposes suggesting these students havestronger family financial support than students classified as independent. A smallproportion of students are married or have children. The university is located close toa relatively low-cost community college system and more than 60% of studentstransferred from another community college or institution. About 50% of the samplereceived FBF scholarships and about 12% had some type of Florida Pre-Paid credits.The Florida Pre-paid College fund is a program designed to help parents of youngchildren save for college and residence hall expenses at an in-state institution byproviding a subsidized long-term payment plan years in advance of attending.The descriptive statistics suggest that 66% of students have loan debt, but theyare not very different from the entire sample in terms of average age, choice of major,ethnicity or gender. Students with loan debt are slightly more likely to be married,have children and to be transfer students. Also, those who take out loan debt havelower average family incomes, are less likely to be classified as dependents, lesslikely to have Florida Prepaid College funds or have been awarded Florida BrightFutures Scholarships. The descriptive statistics suggest that in contrast to the fullsample, students who take out loans have more responsibilities but fewer resourcesto draw on while completing their degrees.Our analysis required two stages. In the first stage, we estimated a probit modelto determine which students were likely to have debt at the time of graduation. Thefirst stage model allowed us to calculate the selection bias correction term, hƟ (x1,γ0). We do not show the results of this analysis, but the selection bias correction term,hƟ (x1, γ0), is included in the second stage regression equations as the variableINVMILL, the inverse Mills ratio. It is significant in all the second stage regressionresults, which indicates that the bias correction was needed to accurately estimate theloan debt at graduation for our sample of students.7
Higher Education Politics & EconomicsTable 1: Variable Explanations and Descriptive StatisticsAll Student GraduatesNObsAll StudentsStudent Graduates with Loan DebtStudents withLoansN Obs MeanMeanLoan Debt at graduation13643Loan Debt9070LOAN YES 1 if student has loans136430.66INC1000 is household income in 1000’s1364368.09LOAN YES90701INC1000907058.30AGE is student age at graduation1364323.76AGE907024.25FEMALE 1 if student is female, 0 otherwise13643ASIAN 1 if student is Asian, 0 LK 1 if student is Black, 0 otherwiseHISP 1 if student is Hispanic, 0 OTHER if student is any other Ethnicity, 0 otherwise136430.03OTHER90700.03WHITE 1 if student is Caucasian, 0 otherwise136430.72WHITE90700.70DEPENDENT 1 if student is dependent of family, 0 otherwise136430.58DEPENDENT90700.50MARRIED 1 if student is married, 0 otherwise136430.13MARRIED90700.15CHILDREN 1 if student has children at home, 0 otherwiseTRANSFER 1 if student did not start as a first-time freshman but transferred in from another institution, 0 R90700.68HEALTH 1 if student graduated in College of Health, 0 otherwise136430.15HEALTH90700.15BUSINESS 1 if student graduated in College of Business, 0 otherwise136430.17BUSINESS90700.16ENGINEER 1 if student graduated from College of Engineering, 0 otherwise136430.07ENGINEER90700.07ARTSCI 1 if student graduated from Arts and Sciences, 0 otherwise136430.48ARTSCI90700.48EDUC 1 if student graduated from College of Education, 0 otherwise136430.12EDUC90700.13FBF amount of award for Florida Bright Futures scholarships (there are different levels of awards)136432956FBF90702477FBFyes 1 if student had any level of Florida Bright Futures Scholarship, 0 otherwise136430.50FBFyes90700.39FLPREPAY amount of Florida prepaid credit13643795FLPREPAY9070556FLPREPAYyes 1 if student has any level of Florida prepaid credits, 0 otherwise136430.12FLPREPAYyes90700.0981201818078
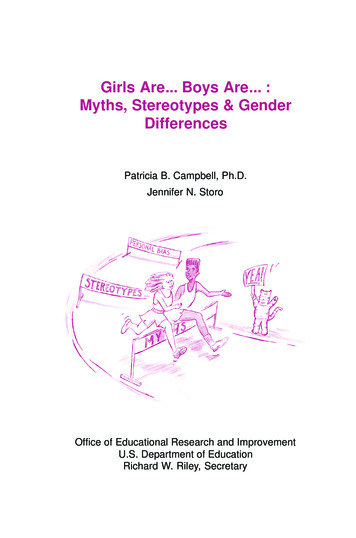
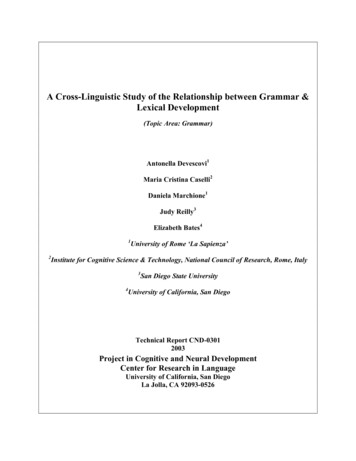
Higher Education Politics & EconomicsRegression ResultsThe regression results from this second stage are shown in Tables 2 and 3. Twosets of regression results are shown because we used two different formulations ofthe Florida Bright Futures (FBF) variable—the first is the dollar value of the awardand the second variable (FBFyes) is a dichotomous (dummy) variable coded 1, if thestudent received the scholarship, and 0, if the student did not receive the scholarship.Table 2 shows the regression results that include the FBF variable measured as theaward amount, and Table 3 shows the regression results that include the dichotomousFBFyes variable. In both models, we also included interaction terms, between theFBF variable and the student’s household income (INC1000). In the first model, theinteraction term is labeled INC*FBF and in the second model it is labeledINC*FBFyes. Both interaction terms are calculated by simply multiplying the valueof the two variables together. The interaction terms allow us to determine if the effectof the FBF scholarship on a student’s debt at graduation varies for students withdifferent income levels.The regression results in Tables 2 and 3 predict the amount of debt a student hasat graduation for the sample as a whole and for five different quantiles of student debt(10%, 25%, 50%, 75%, and 90th). The results suggest that there are several importantpredictors of student debt, and many of these factors impact student debtaccumulation differently across the various debt quantiles.We begin by discussing the demographic and socioeconomic variables that havea significant impact on loan debt. The variables representing age, gender, maritalstatus, race, ethnicity, and having children while in college do not significantly affectthe amount of student debt at graduation, except in two of the debt quantiles. Previousresearch found that Black students borrowed significantly more than other races(Goldrick-Rab et al., 2014; Grinstein-Weiss et al., 2016; Houle, 2014; Jackson &Reynolds, 2013; Kim et al., 2016; Price, 2004). In contrast, our results suggest thatBlacks’ borrowing does not differ significantly from Caucasian students except in thehighest (90th) debt quantile, and Black students borrow less in that highest quantilethan Caucasian students. This means that when we single out the part of the samplethat has the highest 10% of debt at graduation, Caucasian students have higher debtlevels on average than Black students. Similarly, the debt level of Hispanic studentsdoes not differ significantly from Caucasian students except in the middle debt level(50th quantile), and as was the case with Black students, Hispanic students tend toaccumulate less debt overall than Caucasian students in this middle range of debt.Finally, the loan debt of Asian students does not vary significantly from Caucasianstudents in any of the quantiles. Therefore, our results suggest that at most debt levelsthere are no significant differences in debt at graduation for any racial or ethnicgroups. In the two quantile levels that do show differences (the 50th for Hispanicstudents and the 90th for Black students), Black and Hispanic students have less debtthan Caucasian students.The results in Table 2 also suggest that family support impacts student debtburdens in an unexpected way. Household income has a positive and significant effect9
Higher Education Politics & EconomicsTable 2: Quantile Regression of Loan Debt with Selection Bias Correction and Variable FBFDEPENDENTVARIABLE:LOAN DEBTINC1000INC*FBFAGEMALEHeckman 2ndStageTotal SampleHeckman 2ndStageQuantile10Heckman 2ndStageQuantile25Heckman 2ndStageQuantile50Heckman 2ndStageQuantile75Heckman 0)(505.1)(708.2)(840.7)(957.0)(1,440)OTHER10
Higher Education Politics & EconomicsDEPENDENTVARIABLE:LOAN DEBTDEPENDENTMARRIEDHeckman 2ndStageTotal SampleHeckman 2ndStageQuantile10Heckman 2ndStageQuantile25Heckman 2ndStageQuantile50Heckman 2ndStageQuantile75Heckman .0833)(0.0948)(0.143)11
Higher Education Politics & EconomicsDEPENDENTVARIABLE:LOAN DEBTFLPREPAYHeckman 2ndStageTotal SampleHeckman 2ndStageQuantile10Heckman 2ndStageQuantile25Heckman 2ndStageQuantile50Heckman 2ndStageQuantile75Heckman ,0709,0709,0709,0709,070Standard errors in parentheses: *** p 0.01, ** p 0.05, * p 0.112
Higher Education Politics & EconomicsTable 3: Quantile Regression of Loan Debt with Selection Bias Correction and Variable -980.9***(357.5)-257.6(367.9)2nd Stage Quantile Regression with FBFyes Dummy& FBFyesINC1000 0.2)(436.7)(697.8)(861.5)13
Higher Education Politics & Economics2nd Stage Quantile
et al., 2019;). Many of the Promise scholarships also increased the likelihood that minority and disadvantaged students will complete college (Bartik et al., 2021; Bell & Gándara, 2021). There is also evidence that students who receive state merit -based scholarships are more likely to attend an instate university (Cornwell et al., 2006; -