Transcription
Air Conditioning PsychrometricsCourse No: M05-005Credit: 5 PDHA. BhatiaContinuing Education and Development, Inc.22 Stonewall CourtWoodcliff Lake, NJ 07677P: (877) 322-5800info@cedengineering.com
AIRCONDITIONING PSYCHROMETRICS
AIR CONDITIONING PSYCHROMETRICSIn air-conditioning system, the air must undergo one or several of the followingprocesses:Psychrometrics can be used to predict changes in the environment when the amount ofheat and/or moisture in the air changes. Use of psychrometric analysis is also importantto determine the volume flow rates of air to be pushed into the ducting system and thesizing of the major system components.Approaches to Temperature ControlTemperature control in an air conditioning system is achieved by passing the airthrough the cooling or heating coil, which may use any of the following approaches:1. Vary the temperature of air supplied to the space while keeping the airflow rateconstant. This is the basic constant volume, variable temperature approach.2. Vary the airflow rate while keeping the temperature constant for air supplied to thespace. This is the variable volume, constant temperature approach.3. Vary the airflow rate and change the temperature for air supplied to the space. Thisis the variable volume and temperature approach.4. Vary both the supply air temperature and flow rate where the airflow rate is varieddown to a minimum value, then energy input to reheat the coil is controlled to varythe supply air temperature. This is the variable volume reheat approach.Approaches to Humidity ControlHumidity control in a conditioned space is done by controlling the amount of watervapor present in the air in the space. When relative humidity at the desiredtemperature set-point is too high, dehumidification is required to reduce the amount ofwater vapor in the air for humidity control. Similarly, when relative humidity at the
desired temperature set point is too low, humidification is required to increase theamount of water vapor in the air for humidity control.Commonly used dehumidification methods include:1. Surface dehumidification on cooling coils simultaneous with sensible cooling.2. Direct dehumidification with desiccant-based dehumidifiersHumidification is not always required in an HVAC system but, when required, it isprovided by a humidifier. Commonly used humidification methods include:1. Water spray humidifier2. Steam pan humidifierAIR CONDITIONING SYSTEM DESIGNIn designing air conditioning systems, the first challenge is to understand thecomponents that affect the building heat gain or heat loss - this process is calledheating or cooling load estimation. The reactive challenge is to "design" controlledprocesses to maintain the desired condition or state-point within the occupied space these are usually called the system processes that use psychrometrics.Estimating Cooling & Heating LoadLoad estimates are the summation of heat transfer elements into (gains) or out of(losses) the spaces of a building. Each heat transfer element is called loadcomponents, which can be assembled into one of three basic groups, external spaceloads, internal space loads and system loads. To properly understand the workings ofthe various external, internal and system load components, the following items need tobe gathered from a set of plans, existing building surveys or occupant interviews: Building square-footage and volume Orientation of the building (sun effects on surfaces) Year round weather data (design conditions, heat transfer) Use of the spaces within the building (offices, conference room, lab, datacenter)
Hours of operation (occupied and unoccupied) Thermostat set points (main comfort parameter) Dimensions of walls, roofs, windows and doors Construction materials (gather densities, external color and U-factors ordescribe material type layer by layer (R-values) Stairways and elevators (floor-to-floor openings) People occupancy and activity, and when they are present Lighting intensity and hours used Motor and appliance sizes or kW and times they are used Ventilation needs (IAQ and exhaust makeup)The total cooling load is than determined in kW or tons* by the summation of all of thecalculated heat gains. Along with psychrometrics, load estimating establishes thefoundation upon which HVAC system design and operation occur.*One ton is equivalent to heat extraction rate of 12000 Btu’s/hr and 1 kW is equivalentto 3414 Btu’s/hr.Determine Design Supply Airflow RateHVAC engineers use psychrometrics to translate the knowledge of heating or coolingloads (which are in kW or tons) into volume flow rates (in m3/s or CFM) for the air to becirculated into the duct system. The volume flow rate is used to determine the size offans, grills, outlets, air-handling units, and packaged units. This in turn affects thephysical size (foot print) of air handling units and package units and is the single mostimportant factor in conceptualizing the space requirements for mechanical rooms andalso the air-distribution ducts.The main function of the psychrometric analysis of an air-conditioning system is todetermine the volume flow rates of air to be pushed into the ducting system and thesizing of the major system components. We will study this in detail but before that let’sfirst refresh some elementary psychrometrics.
PSYCHROMETRICSPsychrometrics is the science of studying the thermodynamic properties of moist air.The amount of moisture vapour in the air varies quite significantly under differentconditions. When the air is hot, it can contain a large amount of moisture vapour,sometimes as much as 5% by volume. When it is cold, its capacity to hold the moistureis reduced. When the temperature of warm air begins to fall, the vapour also cools and,if cooling continues, it will condense into tiny moisture droplets. In the atmosphere thisresults in the formation of clouds and eventually rain.Definitions of AirThree basic definitions are used to describe air under various conditions:1. Atmospheric air - contains nitrogen, oxygen, carbon dioxide, water vapor, othergases, and miscellaneous contaminants such as dust, pollen, and smoke. This isthe air we breathe and use for ventilation.2. Dry air - exists when all of the contaminants and water vapor have been removedfrom atmospheric air. By volume, dry air contains about 78 percent nitrogen, 21percent oxygen, and 1 percent other gases. Dry air is used as the reference inpsychrometrics.3. Moist air - is a mixture of dry air and water vapor.For practical purposes, moist air and atmospheric air can be considered equal underthe range of conditions normally encountered.Psychrometric ChartThe Psychrometric Chart provides a graphic relationship of the state or condition of theair at any particular time. It displays the properties of air: dry bulb temperature (verticallines), wet bulb temperature (lines sloping gently downward to the right), dew pointtemperature (horizontal lines), and relative humidity (the curves on the chart). Givenany two of these properties, the other two can be determined using the chart. Thechart’s usefulness lies beyond the mere representation of these elementary properties–it also describes the air’s moisture content (far right scale), energy content (outerdiagonal scale on upper left), specific volume (lines sloping sharply downward to theright), and more.
Uses of Psychrometric ChartThe psychrometric chart conveys an amazing amount of information about air. Itprovides an invaluable aid in illustrating and diagnosing environmental problems suchas why heated air can hold more moisture, and conversely, how allowing moist air tocool will result in condensation. To predict whether or not moisture condensation willoccur on a given surface you need three pieces of information; the temperature of theair, the relative humidity of the air, and the surface temperature. The psychrometricchart explains that by raising the surface temperature or by lowering the moisturecontent of the air or employ some combination of both can avoid surface condensation.A rule of thumb is that, a 10 F rise in air temperature can decrease relative humidity 20percent. Use of a psychrometric chart will show that this is true.A psychrometric chart also helps in calculating and analyzing the work and energytransfer of various air-conditioning processes. In practical applications, the mostcommon psychrometric analysis made by HVAC contractors involves measuring thedry and wet bulb temperatures of air entering and leaving a cooling coil. If thesetemperatures are known along with the volumetric air flow rate (CFM) through the coil,the cooling capacity of a unit can be verified. Using the dry and wet bulb temperature
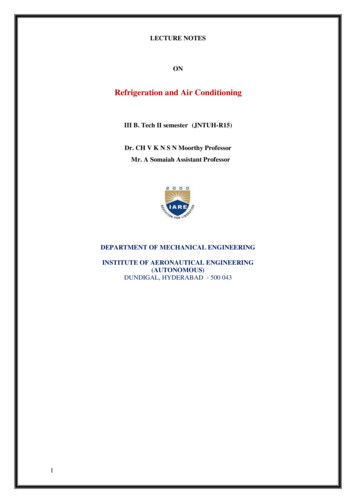
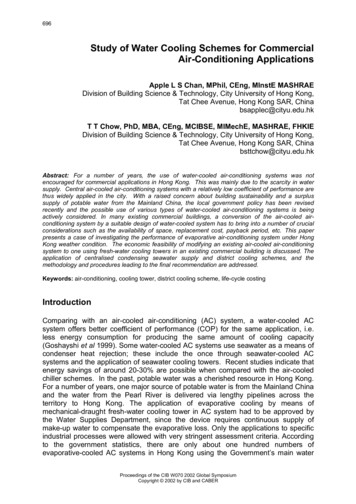
information, two points can be located on a psych chart and the correspondingenthalpy values read for them. The total BTUH cooling capacity can then bedetermined by multiplying 4.5 times the CFM value times the enthalpy difference of thetwo air state points [i.e. 4.5 * CFM * h]. Contractors often have to perform thiscalculation to prove that their equipment is working satisfactorily.READING PSYCHROMETRIC CHARTTo the novice, a psychrometric chart seems a dizzying maze of lines and curves goingevery which way, but once a few fundamental things are understood about the psychchart, it is not really that difficult to understand. If we dissect the components piece bypiece, the usefulness of the chart will be clearer.Temperature: Dry BulbDry Bulb Temperature (DBT) is the temperature that we measure with a standardthermometer that has no water on its surface. When people refer to the temperature ofthe air, they are commonly referring to its dry bulb temperature. Several temperaturescales commonly are used in measuring the temperature. In the inch-pound (I-P)system of units, at standard atmosphere, the Fahrenheit scale has a water freezingpoint of 32 F and a boiling point of 212 F. In the International System (SI) of units, theCelsius scale has a water freezing point of 0 C and a boiling point of 100 C. On theKelvin scale, 0ºK equals -273 C.Dry-bulb temperature is located on the X-axis, of the psychrometric chart and lines ofconstant temperature are represented by vertical chart lines.
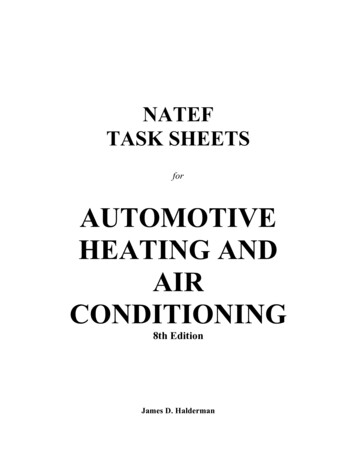
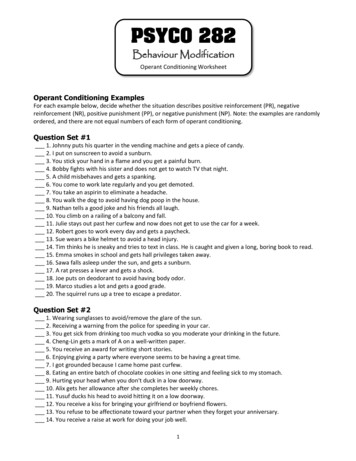
Dry bulb temperature lines shown on the Psychrometric ChartTemperature: Wet BulbThe wet bulb temperature (WBT) is a temperature associated with the moisture contentof the air. Wet bulb temperature is taken by surrounding the thermometer with a wetwick and measuring the reading as the water evaporates. Because of the evaporativecooling effect, Wet bulb temperatures are always lower than dry bulb temperatures andthe only time that they will be the same is at saturation (i.e. 100% relative humidity).The wet bulb temperature (WBT) relates relative humidity to the dry bulb temperature.If the relative humidity is low and the temperature is high, moisture will evaporate veryquickly so its cooling effect will be more significant than if the relative humidity wasalready high, in which case the evaporation rate would be much lower.Wet bulb temperature on psychrometric chart is represented by lines that slantdiagonally from the upper right of the chart (along the line of saturation) down to thelower left of the chart. These follows lines of constant enthalpy but values are read offat the upper, curved, saturation temperature boundary. The unit of measure used forwet bulb temperature is degrees Celsius ( C) or degrees Farenheight ( F).
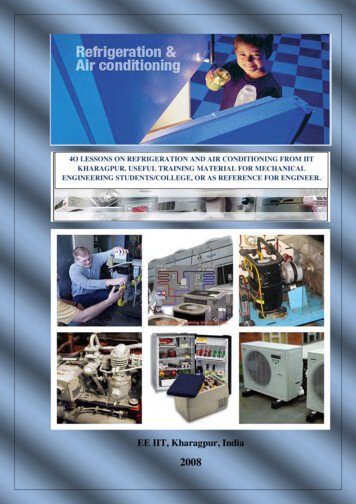
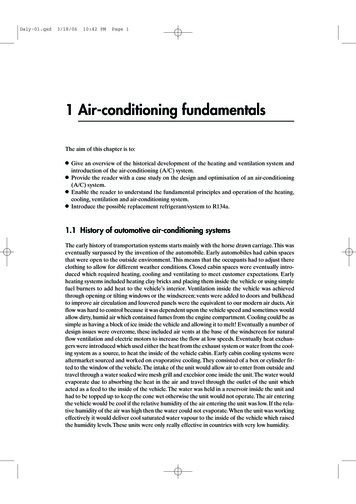
Lines of constant wet-bulb temperature on the Psychrometric ChartEnthalpyEnthalpy is the measure of heat energy in the air due to sensible heat or latent heat.Sensible heat is the heat (energy) in the air due to the temperature of the air and thelatent heat is the heat (energy) in the air due to the moisture of the air. The sum of thelatent energy and the sensible energy is called the air enthalpy. Enthalpy is expressedin Btu per pound of dry air (Btu/lb of dry air) or kilojoules per kilogram (kJ/kg).Enthalpy is useful in air heating and cooling applications. Air with same amount ofenergy may either be dry hot air (high sensible heat) or cool moist air (high latentheat).The enthalpy scale is located above the saturation, upper boundary of the chart. Linesof constant enthalpy run diagonally downward from left to right across the chart; followalmost exactly the line of constant wet bulb temperature.
Enthalpy lines shown on Psychrometric ChartRelative Humidity (RH)Relative humidity (RH) is a measure of the amount of water air can hold at a certaintemperature. Air temperature (dry-bulb) is important because warmer air can hold moremoisture than cold air. As a rule of thumb, the maximum amount of water that the aircan hold doubles for every 20 F increase in temperature.Lines of constant relative humidity are represented by the curved lines running fromthe bottom left and sweeping up through to the top right of the chart. The line for 100percent relative humidity, or saturation, is the upper, left boundary of the chart.
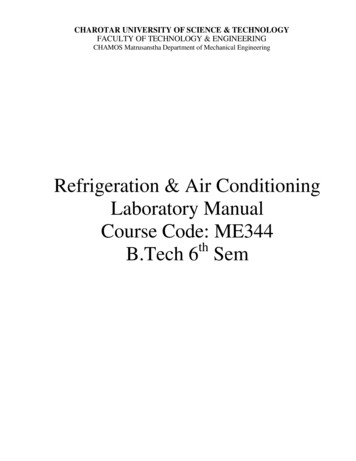
Relative humidity lines shown on Psychrometric ChartThe 100 % RH (saturation) line corresponds to the wet bulb and the dew-pointtemperature scale line and the line for zero percent RH falls along the dry-bulbtemperature scale lineNote that air holds more water vapor at increasing temperatures. Air at 60 percentrelative humidity contains 60 percent of the water it could possibly hold (at thattemperature). It could pick up 40 percent more water to reach saturation. Because RHvaries significantly with dry bulb temperature, it is important to state dry bulbtemperature and relative humidity together, such as 70 F and 50% RH.RH should not be confused with absolute humidity which is defined as the actualamount of moisture in the air and is measured in pounds of moisture per pound of dryair (lb/lb of d.a). Relative humidity (RH) is a measure of how much moisture is presentcompared to how much moisture the air could hold at that temperature. RH isexpressed as a percent.Absolute Humidity or Humidity RatioAbsolute Humidity is the vapor content of air, given in grams or lb of water vapor per lbof dry air (i.e., lb of moisture/lb of d.a). It is also known as moisture content or humidityratio. Air at a given temperature can support only a certain amount of moisture and nomore. This is referred to as the saturation humidity.
Humidity ratio is represented on the chart by lines that run horizontally and the valuesare on the right hand side (Y-axis) of the chart increasing from bottom to top.Humidity Ratio lines shown on Psychrometric ChartDew PointDew point temperature indicates the temperature at which water will begin to condenseout of moist air. When air is cooled, the relative humidity increases until saturation isreached and condensation occurs. Condensation occurs on surfaces which are at orbelow the dew point temperature.Dew point is represented along the 100% relative humidity line on the psychrometricchart. Dew point temperature is determined by moving from a state point horizontally tothe left along lines of constant humidity ratio until the upper, curved, saturationtemperature boundary is reached. At dew point, dry bulb temperature and wet bulbtemperature are exactly the same.
Dew Point lines shown on Psychrometric ChartThe dew point is closely related to the nighttime low temperature on still nights. Whenthe air temperature drops to the dew point, energy is added back to the air as frost ordew forms and the temperature stabilizes at the dew point temperature. The dew pointtemperature is directly related to the actual quantity of moisture in the air and does notchange much throughout a day unless a weather front moves through an area andadds or removes large amounts moisture. So the dew point temperature measuredduring daytime hours can be used as an estimate of the nighttime low temperature.Specific Air VolumeSpecific Volume is the volume that a certain weight of air occupies at a specific set ofconditions. The specific volume of air is basically the reciprocal of air density. As thetemperature of the air increases, its density will decrease as its molecules vibrate moreand take up more space (as per Boyle’s law). Thus the specific volume will increasewith increasing temperature.Since warm air is less dense than cool air which causes warmed air to rise. Thisphenomenon is known as thermal buoyancy. By similar reasoning, warmer air hasgreater specific volume and is hence lighter than cool air.The specific volume of air is also affected by humidity levels and overall atmosphericpressure. The more the moisture vapour present in the air, the greater shall be thespecific volume. With increased atmospheric pressure, the greater the density of the
air - so the lower its specific volume. The unit of measure used for specific volume iscubic feet/lb of dry air.Specific volume is represented on Psychrometric Chart by lines that slant from thelower right hand corner towards the upper left hand corner at a steeper angle than thelines of wet bulb temperature and enthalpy.Specific Volume lines shown on Psychrometric ChartVapour PressureWater vapour is one of several gaseous constituents of air, the other principal onesbeing nitrogen, oxygen and carbon dioxide. Each exerts its own partial pressure on thesurrounding environment in proportion to the amount of gas present, the sum of thepressures making up the total or barometric pressure of the air. When there is adifference in concentration of one of these gases between two points, there will be acorresponding difference in partial pressure. This will cause a flow of that particulargas from the point of higher concentration to the lower. When a partial pressuredifference exists between two sides of a material, the gas involved will diffuse throughthe material until the partial pressures of that gas are equalized.The rate of diffusion will be determined by the partial pressure difference, the length ofthe flow path, and the permeability to the particular gas involved of the mediumthrough which flow is taking place.
When water changes state from a liquid to a gas, as it does when it evaporates into theair, the water molecules in the vapour expand. Just as air pressure is directly related tothe number of gas molecules per cubic meter of space, so vapour pressure resultsfrom the number of water vapour molecules per cubic meter. The greater the moisturevapour content of air, the greater the vapour pressure. Thus vapour pressure is linearlyrelated to absolute humidity and is represented on Psychrometric Chart by lines thatrun horizontally and the values are on the far right hand side of the chart increasingfrom bottom to top. The unit of measure for vapour pressure is inches-w.g. or PASCAL.Vapour Pressure shown on Psychrometric ChartVapour pressure directly affects evaporation rate. If the vapour pressure in the air isalready very high, it is more difficult for water molecules to break free from a liquidsurface and enter the air as vapour. That is why there is very little evaporation inhumid environments. The point at which absolutely no more evaporation will occurbecause the air is already saturated is called, interestingly enough, saturation pressureand coincides with the saturation point.MEASURING PSYCHROMETRIC VARIABLESAll psychrometric properties of air are determined by measuring two psychrometricvariables: for example, if wet- and dry-bulb temperatures are measured, then relativehumidity, vapor pressure and dew point. Many variables can be measured to determinethe psychrometric state of air, but dry-bulb temperature, wet-bulb temperature, dewpoint temperature, and relative humidity are most commonly measured.
Measuring Dry Bulb TemperatureDry-bulb temperature can be simply measured by a mercury-in-glass thermometer,which is freely exposed to the air but is shielded from moisture and radiation heatsources. A thermometer can be made from any substance whose property changespredictably with temperature for instance the volume of mercury increases withincreasing temperature. Beside mercury-in-glass, other liquids can also be used in thisway. Other forms of volume-based thermometers use the differential expansion ofmetals in the form of a wound spring.More recently, materials have been found whose electrical resistance change withtemperature. These are usually manufactured from the oxides of transition metals suchas manganese, cobalt, copper or nickel. They are called thermistors and are usuallyfound in data-loggers and as computer-based sensors. When the temperatureincreases, the resistance of the thermistor decreases. Conversely, if the temperaturedecreases, the thermistor's resistance increases.In a weather station, the temperature and relative humidity equipment is usuallyhoused in a white box shelter called Stevenson Screen. It shields the instruments fromsunshine and precipitations and has louvered sides to permit the free movement of air.Ideally the shelter is placed over grass, mounted at 1 meter above the ground and asfar from any buildings as circumstances permit.Measuring Wet Bulb TemperatureWet bulb temperature is easily measured with a standard thermometer which has itssensing bulb encased in a wetted wick that is subjected to rapid air motion across itssurface. Such devices, called sling or whirled psychrometers, have a frame that can bewhirled in the air by hand. When the sling psychrometer whirls through the air, waterfrom the wetted sack evaporates, causing it to cool to the wet-bulb temperature. Theamount of cooling that occurs depends on the relative humidity. The lower thehumidity, the faster will be the evaporation, and the more the bulb will cool. Highhumidity will cause less evaporation, slowing the cooling process.An accurate wet-bulb temperature reading depends on 1) sensitivity and accuracy ofthe thermometer, 2) maintenance of an adequate air speed past the wick, 3) shielding
of the thermometer from radiation, 4) use of distilled or de-ionized water to wet thewick, and 5) use of a cotton wick.The thermometer sensitivity required to determine an accurate humidity variesaccording to the temperature range of the air. More sensitivity is needed at low than athigh temperatures. For example, at 150 F a 1 F error in wet-bulb temperature readingresults in a 2.6 percent error in relative humidity determination, but at 32 F that sameerror results in a 10.5 percent error in relative humidity.The rate of evaporation from the wick is a function of air speed past it. A minimum airspeed of about 500 feet per minute is required for accurate readings. An air speedmuch below this will result in an erroneously high wet-bulb reading. Wet-bulb devicesthat do not provide a guaranteed air flow cannot be relied on to give an accuratereading.As with the dry-bulb thermometer, sources of radiant heat such as motors, lights, andso on can affect the wet-bulb thermometer. The reading must be taken in an areaprotected from these sources of radiation or thermometers must be shielded fromradiant energy.A buildup of salts from impure water or contaminants in the air affects the rate of waterevaporation from the wick and results in erroneous data. Distilled or de-ionized watershould be used to moisten the wick and the wick should be replaced if there is any signof contamination. The wick material should not have been treated with chemicals suchas sizing compounds that affect the water evaporation rate.Special care must be taken when using a wet-bulb thermometer when the wet-bulbtemperature is near freezing. Most humidity tables and calculators are based on afrozen wick at wet-bulb temperatures below 32 F. At temperatures below 32 F, touchthe wick with a piece of clean ice or another cold object to induce freezing, becausedistilled water can be cooled below 32 F without freezing. The psychrometric chart orcalculator must use frost-bulb, not wet-bulb temperatures, below 32 F to be accuratewith this method.Measuring HumidityThe instruments used to measure humidity are called hygrometers. The simplest formof hygrometer is called a psychrometer. It consists of two thermometers mounted on
the same frame that can be whirled in the air by hand. This is described in detail in thewet bulb temperature measurement above.The wet- and dry-bulb temperatures together determine the state point of the air on thepsychrometric chart, allowing all other variables to be determined. In air that has lessthan 100 per cent relative humidity, the wet bulb will record a lower temperature thanthe dry bulb. This difference in temperature is known as wet-bulb depression. A specialchart is used to convert the wet bulb depression to relative humidity.The relationship between dry-bulb, wet-bulb and RH is tabulated below:Dry( F)BulbWet( 84817Higher the differential between the dry bulb and wet bulb temperature, lower shall bethe relative humidity. A 10 F differential represents the Relative humidity of 55%. If the wet bulb temperature is lower than dry bulb the air-vapor mixture is unsaturated If the wet bulb temperature is the same as the dry bulb the air vapor is saturatedOther humidity measurement devices include an electric sensing element or amechanical system.The mechanical hygrometer uses a single human hair as a sensing element. The hairis attached to a spring and a dial. When the relative humidity increases, the cells in thehair swell and contract, pulling the spring and the dial hand. At a lower relativehumidity, the hair cells relax and it lengthens, releasing the tension on the spring and
allowing the dial hand to move in the opposite direction. The response to changes inrelative humidity is slow and is not dependable at very high relative humidity. Thesedevices are acceptable as an indicator of a general range of humidity but are notsuitable for accurate measurements.A more accurate measurement is achieved with an electronic hygrometer. It measuresthe change in the electrical resistance of a thin layer of lithium chloride, or of asemiconductor device, as the relative humidity changes. Other hygrometers sensechanges in weight, volume, or the transparency of various substances that respond torelative humidity.Measuring Dew PointTwo types of dew point sensors are commonly used today: a condensation dew pointmethod and a saturated salt system.The condensation dew-point hygrometer is a polished metal mirror that is cooled untilmoisture just begins to condense onto it. This occurs when the surrounding air reachesits dew point. The temperature of the metal is then the same as the dew pointtemperature. Knowing the atmospheric temperature and the dew-point temperature,the relative humidity can be determined by means of a table.The saturated salt system operates at dew points between 10 to 100 F with an errorof less than 2 F. The system costs less than the condensation system, is notsignificantly affected by contaminating ions, and has a response time of about 4minutes. The condensation type is very accurate over a wide range of dew pointtemperatures (less than 1 F from -100 to 212 F). A condensation dew pointhygrometer can be expensive.Measuring Vapour PressureMeasuring vapour pressure is very difficult without complex laboratory instrumentation.However, it can be relatively easily derived from more measurable properties. The ratiobetween the weight of water vapour actually present in the air and the weight it cancontain when saturated at the same temperature is called the relative humidity of theair. It is usually expressed as a percentage. As the vapour pressures are set by thequantities of vapour in the air, the relative humidity is also given by the ratio betweenthe actual vapour pressure and the saturation vapour pressure at the same
temperature. Thus, if the temperature and relative humidity are known, the actualvapour pressure can be calculated from the product of the relative humidity (expressedas a decimal) and the saturation pressure.These saturation vapour pressures and the corresponding quantities of water in the aircan be read directly off the psychrometric chart or from tables.ExampleAn air-conditioned room at sea level has an indoor design temperature of 75 F and arelative humidity of 50%. Determine the humidity ratio, enthalpy, density, dew point,and thermodynamic wet bulb temperature of the indoor air at design condition.SolutionSince the air-conditioned room is at sea level, a psychrometric chart of standardatmospheric pressure of 14.697psi should be used to find the required properties.1. Plot the state point of the room air at design condition on the psychrometric chart.First, find the room temperature 75 F on the horizontal temperature scale. Draw aline parallel to the 75 F temperature line. This line meets the relative humiditycurve of 50% at point 1, which denotes the state point of room air (refer figureabove).
2. Draw a horizontal line toward the humidity ratio scale from point 1. This line meetsthe ordinate and thus determines the room air humidity ratio W 0.0093 lb/lb.3. Draw a line from point 1 parallel to the enthalpy line. This line determines theenthalpy of room air on the enthalpy scale, h1 28.1 Btu/lb.4. Draw a line through point r parallel to the moist volume line. The perpendicularscale of this line indicates v 13.67 ft3/lb.5. Draw a horizontal line to the left from point 1. This line meets the saturation curveand determines the dew point temperature, Tdew 55 F.6. Draw a line through point r parallel to the thermodynamic wet bulb line. Theperpendicular scale to this line indicates that the thermodynamic wet bulbtemperature T* 62.5 F.ExampleA sling psychrometer gives a dry-bulb temperature of 78 F and a wet-bulb temperatureof 65 F. Determine other moist air properties from this information.SolutionFind the intersection of the two known properties, dry-bulb and wet-bulb temperatures,on the psychromet
Dry air - exists when all of the contaminants and water vapor have been removed from atmospheric air. By volume, dry air contains about 78 percent nitrogen, 21 percent oxygen, and 1 percent other gases. Dry air is used as the reference in psychrometrics. 3. Moist air - is a mixture of dry air and water vapor.