Transcription
85667 Cvr.fm Page 1 Friday, October 8, 1999 10:05 AMAir ConditioningClinicAir Conditioning FansOne of the Equipment SeriesTRG-TRC013-EN
NO POSTAGENECESSARYIF MAILEDIN THEUNITED STATESBUSINESS REPLY MAILFIRST-CLASS MAILPERMIT NO. 11LA CROSSE, WIPOSTAGE WILL BE PAID BY ADDRESSEETHE TRANE COMPANYAttn: Applications Engineering3600 Pammel Creek RoadLa Crosse WI 54601-9985NO POSTAGENECESSARYIF MAILEDIN THEUNITED STATESBUSINESS REPLY MAILFIRST-CLASS MAILPERMIT NO. 11LA CROSSE, WIPOSTAGE WILL BE PAID BY ADDRESSEETHE TRANE COMPANYAttn: Applications Engineering3600 Pammel Creek RoadLa Crosse WI 54601-9985
Perforation 3.25” from left edgeComment CardWe want to ensure that our educational materials meet your ever-changing resource development needs.Please take a moment to comment on the effectiveness of this Air Conditioning Clinic.Air Conditioning FansLevel of detail (circle one)Too basicJust rightToo difficultOne of the Equipment SeriesRate this clinic from 1–Needs Improvement to 10–Excellent TRG-TRC013-ENContent12345678910Booklet 10Presenter’s ability12345678910Training environment12345678910Other comments?About me Type of businessJob functionOptional:namephoneaddressGive the completed card to thepresenter or drop it in the mail.Thank you!The Trane Company Worldwide Applied Systems Group3600 Pammel Creek Road La Crosse, WI 54601-7599www.trane.comAn American-Standard CompanyPerforation 5.625” from topResponse CardWe offer a variety of HVAC-related educational materials and technical references, as well as software toolsthat simplify system design/analysis and equipment selection. To receive information about any of theseitems, just complete this postage-paid card and drop it in the mail.Education materialsSoftware toolsPeriodicalsOther? Air Conditioning Clinic series Engineered Systems Clinic series Trane Air Conditioning Manual Trane Systems Manual Equipment Selection System design & analysis Engineers Newsletter About me NameTitleBusiness typePhone/faxE-mail addressCompanyAddressThank you for your interest!The Trane Company Worldwide Applied Systems Group3600 Pammel Creek Road La Crosse, WI 54601-7599www.trane.comAn American-Standard Company
Air Conditioning FansOne of the Equipment SeriesA publication ofThe Trane Company—Worldwide Applied Systems Group
PrefaceAir Conditioning FansA Trane Air Conditioning ClinicFigure 1The Trane Company believes that it is incumbent on manufacturers to serve theindustry by regularly disseminating information gathered through laboratoryresearch, testing programs, and field experience.The Trane Air Conditioning Clinic series is one means of knowledge sharing. Itis intended to acquaint a nontechnical audience with various fundamentalaspects of heating, ventilating, and air conditioning.We’ve taken special care to make the clinic as uncommercial andstraightforward as possible. Illustrations of Trane products only appear in caseswhere they help convey the message contained in the accompanying text.This particular clinic introduces the concept of air conditioning fans.ii 1999 American Standard Inc. All rights reservedTRG-TRC013-EN
ContentsIntroduction . 1period oneFan Performance . 2Fan Performance Curves . 11System Resistance Curve . 17Fan – System Interaction . 19period twoFan Types . 27Forward Curved (FC) Fans . 28Backward Inclined (BI) Fans . 30Airfoil (AF) Fans . 33Vaneaxial Fans . 35period three Fan Capacity Control . 39“Riding the Fan Curve” . 40Discharge Dampers . 44Inlet Vanes . 46Fan-Speed Control . 48Variable-Pitch Blade Control . 49period fourApplication Considerations . 52System Static-Pressure Control . 53System Effect . 55Acoustics . 56Effect of Actual (Nonstandard) Conditions . 58Equipment Certification Standards . 59period fiveReview . 60Quiz . 64Answers . 66Glossary . 67TRG-TRC013-ENiii
ivTRG-TRC013-EN
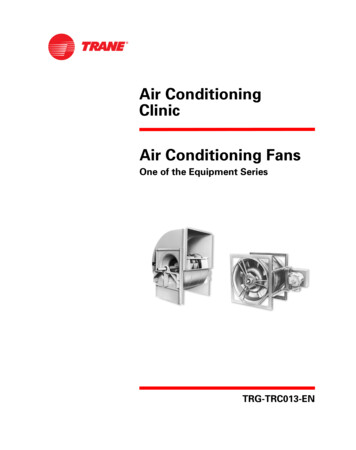
IntroductionnotesAir Conditioning FansaxialcentrifugalFigure 2Efficient distribution of conditioned air needed to heat, cool, and ventilate abuilding requires the service of a properly selected and applied fan.The types of fans commonly used in HVAC applications include centrifugal andaxial designs. In a centrifugal fan the airflow follows a radial path through thefan wheel. In an axial fan the airflow passes straight through the fan, parallelto the shaft.TRG-TRC013-EN1
period oneFan PerformancenotesAir Conditioning Fansperiod oneFigure 3Compared to compressors, the pressures generated by these air-movingdevices within the ductwork of HVAC systems are relatively small. Themeasurement of these pressures is, however, essential to the determination offan performance.Measuring PressureductpressureatmosphericpressureFigure 4One instrument that is available to measure these small pressures is a U-tubethat contains a quantity of water. One end of the tube is open to the atmosphere(open leg), while the other end is connected to the ductwork (closed leg).2TRG-TRC013-EN
period oneFan PerformancenotesPositive Duct Pressureductpressureatmosphericpressure3 inches[76.2 mm]Figure 5When the pressure within the ductwork is positive, that is, greater thanatmospheric, the water column is forced downward in the closed leg and forcedupward in the open leg. Conversely, a negative pressure within the ductworkcauses the water column to drop in the open leg and to rise in the closed leg.In this illustration, a positive pressure in the ductwork forces the water in theclosed leg 3 in. [76.2 mm] lower than the water in the open leg. A pressure of 1psi will support a 27.7-in. column of water. [A pressure of 1 kPa will support a102-mm column of water.] Therefore, this length of water column is equivalentto a pressure of 0.11 psi [758 Pa].However, to avoid having to convert units each time a reading is taken,inches (in.) or millimeters (mm) of water (H2O) are often used to measure thepressures generated by fans. Other common expressions of this measurementare “water gage” (wg) and “water column” (wc).TRG-TRC013-EN3
period oneFan PerformancenotesInclined igure 6Since some of the pressures observed in air conditioning systems are verysmall, the U-tube has been modified to improve the ability to read such smalldifferences in water levels. The modification replaces one leg of the tube with aliquid reservoir and the other leg with an inclined tube. This instrument is calledan inclined manometer.Knowing the slope of the tube to be 10:1, a pressure applied to the reservoircauses the liquid to travel ten times further up the inclined tube to achieve theliquid level difference between the tube and the reservoir. This allows thepressure difference to be read with greater accuracy.For example, a 0.5 in. [12.7 mm] H2O pressure applied to the reservoir end ofthe device causes the water to travel 5 in. [127 mm] up the inclined leg.Other instruments commonly used to measure pressures related to fansinclude the electronic manometer and mechanical gages.4TRG-TRC013-EN
period oneFan PerformancenotesTotal Pressurevelocitypressurefanstaticpressuretotal pressure (Pt) static pressure (Ps) velocity pressure (P(Pv)Figure 7The total amount of pressure generated by a fan has two components: velocitypressure and static pressure. The velocity pressure is due to the momentumof the air as it moves axially through the duct, while the static pressure is dueto the perpendicular outward “push” of the air against the duct walls.The total pressure is the sum of the velocity pressure and the static pressure.Velocity Pressure vs. Static PressurevanedamperfanFigure 8For example, assume a fan is attached to a straight piece of duct that has adamper at the open end. To observe air movement, a hinged vane is suspendedfrom the top of the duct.TRG-TRC013-EN5
period oneFan PerformancenotesVelocity Pressure vs. Static Pressuredamperfully openFigure 9With the fan operating and the damper fully open, air moves through the ductunimpeded. The impact of the moving air causes the vane to swing in thedirection of airflow. The pressure exerted on the vane is due to the velocity ofthe air moving through the duct, not the static pressure exerted on the walls ofthe duct.At this point the outward, or static, pressure exerted on the duct walls isnegligible. Nearly all of the usable fan energy is being converted to velocitypressure.Velocity Pressure vs. Static Pressuredamperpartially openFigure 10Partially closing the damper increases resistance to airflow. The fan generatesenough pressure to overcome this resistance (static pressure loss), but thisoccurs at the expense of velocity pressure. Part of the fan’s usable energy isnow being devoted to generating enough static pressure to overcome theresistance of the damper.6TRG-TRC013-EN
period oneFan PerformancenotesThis build-up of static pressure results in reduced air velocity (velocity pressure)and therefore a reduction in the airflow delivered by the fan.Notice that the hinged vane has moved toward a more vertical position. Thereduced velocity pressure on the face of the vane causes it to move to a moreneutral position.Velocity Pressure vs. Static Pressuredamperfully closedFigure 11Finally, when the damper is closed fully, airflow stops and no velocity pressureexists in the ductwork. All of the usable fan energy is now being converted tostatic pressure. The pressure on the back side of the vane equals the pressureon the face of the vane and it assumes the neutral (vertical) position.Measuring Static PressureinclinedmanometerFigure 12Both velocity and static pressures can be determined using the inclinedmanometer. Static pressure is measured directly by inserting a probe throughthe duct wall with its open end perpendicular to air movement. In this positiononly the outward, or static, pressure within the duct is sensed.TRG-TRC013-EN7
period oneFan PerformancenotesMeasuring Total PressureinclinedmanometerFigure 13Another probe can be placed in the duct with its open end facing into the airstream. This probe senses total pressure—the combination of velocity pressureplus static pressure.Therefore, static pressure can be read directly, while velocity pressure isderived by subtracting the static pressure from the total pressure.An alternate method would be to attach the open end of this manometer to theduct system, using it to measure static pressure. With one end measuring totalpressure and the other end measuring static pressure, the difference read onthe manometer scale would be equal to the velocity pressure.8TRG-TRC013-EN
period oneFan PerformancenotesFan Performance Testthrottlingdevicefandynamometermanometerair straightenerFigure 14The characteristics of a fan’s performance under various duct pressureconditions is tested by an apparatus similar to the one shown here.The fan is connected to a long piece of straight duct with a throttling device atthe end. The throttling device is used to change the air resistance of the duct.The fan is operated at a single speed and the power applied to the fan shaft ismeasured by a device called a dynamometer. As discussed on the previousslide, a single manometer is used to measure the velocity pressure—thedifference between the total and static pressures.The test is first conducted with the throttling device removed. This is calledwide-open airflow. With no resistance to airflow, the pressure generated bythe fan is velocity pressure only—the static pressure is negligible.The throttling device is then put in place and progressively moved toward theclosed position. The pressures are recorded at each throttling device position.When the throttling device is fully closed, only static pressure is beinggenerated by the fan because there is no airflow. This point is called theblocked-tight static pressure.TRG-TRC013-EN9
period oneFan PerformancenotesDetermining Fan AirflowVelocity Pressure (Pv) Pt – PsVelocity (V) Constant ρPvAirflow Velocity Fan Outlet AreaFigure 15Next, the measured velocity pressure is used to calculate the airflow deliveredby the fan. The manometer measures the velocity pressure (Pv) by subtractingstatic pressure (Ps) from total pressure (Pt). Next, the air velocity (V) can becalculated by dividing velocity pressure (Pv) by the air density (ρ), taking thesquare root of the quotient, and multiplying by a constant. Finally, the fanairflow is determined by multiplying the air velocity (V) by the outlet area (A) ofthe fan.For example, assume the test readings for a specific throttling-device positionare as follows: Total pressure (Pt) 2.45 in. H2O [62.2 mm H2O or 610 Pa] Static pressure (Ps) 2.0 in. H2O [50.8 mm H2O or 491 Pa] Velocity pressure (Pv) Pt – Ps 2.45 – 2.0 0.45 in. H2O [11.4 mm H2O or 119Pa] Fan outlet area (A) 1.28 ft2 [0.12 m2] Fan speed 1,100 rpm (revolutions per minute) Air density (ρ) at standard air conditions 0.0749 lb/ft3 [1.204 kg/m3]Proceeding with the calculations,P0.45V 1,096 -----v- 1,096 ------------------ 2,686 fpm (ft/min)ρ0.07493Airflow V A 2,686 1.28 3,438 cfm (ft /min)P119V 1.414 -----v- 1.414 --------------- 14.06 m/s1.204ρ3Airflow V A 14.06 0.12 1.69 m /sIt is determined that at this point, the fan, operating at 1,100 rpm, is delivering3,438 cfm [1.69 m3/s] against 2 in. H2O [491 Pa] of static pressure.10TRG-TRC013-EN
period oneFan Performancenotesstatic pressurePlotting Fan Performance Points2.0 in. H2O[491 Pa]3,438 cfm[1.69 m3/s]airflowFigure 16Fan Performance CurvesThis point can then be plotted on a chart that has static pressure on the verticalaxis and airflow on the horizontal axis.static pressurePlotting Fan Performance PointsairflowFigure 17Additional data from the fan tests establish other static pressure andcorresponding airflow performance points for a given rotational speed(revolutions per minute or rpm).TRG-TRC013-EN11
period oneFan PerformancenotesFan Performance Curverpm001, 1static pressureblocked-tightstatic pressureairflowwide-openairflowFigure 18When a series of points is plotted, a curve can be drawn. The resulting curvegraphically illustrates the performance of this fan when it is operated at aconstant speed.Notice that the curve extends from blocked-tight static pressure, with acorresponding zero airflow, to wide-open airflow, with a corresponding zerostatic pressure.12TRG-TRC013-EN
period oneFan PerformancenotesFan Speed700rpmpm0r90500rpmrp m001,1static pressuref anspeedairflowFigure 19Next, the fan laws are used to calculate the performance characteristics of thissame fan at other rotational speeds. The subscript 1 refers to the testedperformance conditions; the subscript 2 refers to the calculated performanceconditions.Fan SpeedAirflow 2----------------------- --------------------------------2Airflow 1Fan Speed 1Fan Speed 2Static Pressure 2--------------------------------------------- --------------------------------2 Fan Speed 1 Static Pressure 1Fan Speed 3Input Power 2------------------------------------- --------------------------------2 Fan Speed 1 Input Power 1The result is a family of curves that represents the specific fan’s airflow capacityat various speeds and static pressures.TRG-TRC013-EN13
period oneFan PerformancenotesInput Power1 hp2 hp3 hp[0.75 kW][1.5 kW][2.2 kW]static pressure0.5 hp[0.37 kW]input powerairflowFigure 20Finally, using the measurements from the dynamometer and the fan laws,curves can be calculated and plotted to represent the fan’s power consumptionat each operating condition.Fan SurgehighpressurefanlowpressureFigure 21When most fans approach the blocked-tight static-pressure condition,instability is encountered. This condition is known as surge.Surge occurs when the quantity of air being moved by the fan falls below theamount necessary to sustain the existing static-pressure difference between theinlet and outlet sides of the fan. When this occurs, the pressurized air flowsbackward through the fan wheel, instantaneously reducing the pressure at thefan outlet. This surge of air enables the fan to re-establish the proper directionof airflow. The resulting fluctuation in airflow and static pressure within the fanand ductwork can result in excessive noise, vibration, and possibly damage tothe fan.14TRG-TRC013-EN
period oneFan PerformancenotesFan Surge Linestatic pressuresurgelineairflowFigure 22A surge line is established during the fan test procedure to indicate the area ona fan performance curve where surge occurs. As long as the fan’s operatingpoint falls to the right of this line, the fan will operate in a stable manner. If thefan is operated at a point that falls to the left of this line, the fan will surge.Percent of Wide-Open Airflowsurgeline50%static pressure60%% wide-openairflow70%80%90%100%airflowFigure 23Finally, to serve as a guide for selection, curves are established to indicate thepercentage of wide-open airflow being delivered by the fan at various operatingpoints.This completes the typical fan performance curve. It shows the relationshipbetween pressure and airflow, and can be used to graphically represent thefan’s interaction with the system.TRG-TRC013-EN15
period oneFan PerformancenotesTabular Performance DataFigure 24Fan manufacturers may present their performance data in graphical and/ortabular form. Similar to using the fan curve, by knowing the desired airflow andpressure-producing capability of the fan, the table can be used to determine thefan’s speed and input power requirement.For example, assume an application requires 6,800 cfm [3,210 L/s] at a staticpressure of 2.5 in. H2O [622.75 Pa]. Using this sample table, this particular fanrequires a rotational speed of 821 rpm and 4.25 hp [3.17 kW] of power to meetthe requirements.16TRG-TRC013-EN
period oneFan PerformancenotesSystem Resistancereturn ductsupply ductfandamperreturn air grillecoolingcoilsupplydiffuserFigure 25System Resistance CurveNow that a typical fan performance curve has been developed, let’s see how thefan will perform within a system.With each airflow, an air distribution system imposes a certain resistance to thepassage of air. The resistance is the sum of all of the pressure lossesexperienced as air passes through the ductwork, supply air diffusers, return airgrilles, dampers, filters, coils, etc. This is the resistance, or static-pressure loss,that the fan must overcome to move a given quantity of air through the system.static pressureSystem Resistance2.0 in. H2O[491 Pa]3,500 cfm[1.65 m3/s]airflowFigure 26Assume that a system is designed to deliver 3,500 cfm [1.65 m3/s], and that toovercome the system pressure losses, the fan must generate 2.0 in. H2O[491 Pa] of static pressure.To illustrate how a system resistance curve is developed, this point is plotted onthe same chart used to develop the fan curve.TRG-TRC013-EN17
period oneFan PerformancenotesSystem Resistance CurveStatic Pressure 2Airflow 2Static Pressure 1Airflow 12Figure 27Assuming the system does not change, the static-pressure loss due to thesystem varies with the square of the airflow. Other points on the systemresistance curve are determined by using the following fan law equation:Airflow 2Static Pressure 2--------------------------------------------- ----------------------2- Airflow 1 Static Pressure 1For example, when the same system is delivering 2,000 cfm [0.94 m3/s], thestatic-pressure loss due to the system pressure is 0.65 in. H2O [159 Pa].2,000 cfmStatic Pressure 2 2.0 in. H 2 O --------------------------- 3,500 cfm 0.94 m 3 /s - Static Pressure 2 491 Pa ------------------------- 1.65 m 3 /s 182 0.65 in. H 2 O2 159 PaTRG-TRC013-EN
period oneFan PerformancenotesSystem Resistance Curvestatic pressuresystemresistancecurve2.0 in. H2O[491 Pa]0.65 in. H2O[159 Pa]2,000 cfm3,500 cfm[0.94 m3/s][1.65 m3/s]airflowFigure 28By plotting several such points, a curve can be established. This systemresistance curve represents the static pressure that the fan must generate, atvarious airflows, to overcome the resistance—or static-pressure loss—withinthis particular system.Fan – System Interactionstatic pressuredesign systemresistance curvesurgeregion airflowFigure 29Fan – System InteractionBy superimposing the system resistance curve on a fan performance curve, theintersection predicts the airflow and static pressure at which the fan and systemwill balance—design operating point A.If the installed system resistance is different from that assumed during thedesign process, the fan-and-system balance point—the operating point—willnot be as intended. This means that the fan and system will balance at a pointthat has a higher or lower airflow, static pressure, and input power.TRG-TRC013-EN19
period oneFan PerformancenotesHigher System Resistanceactual systemresistance curvesurgeregion% deespfandweenespannfsigdestatic pressure&airflowFigure 30Consider a case where the air resistance through the system is greater thanpredicted. Instead of the design operating point A, the actual system resistancecurve intersects the fan performance curve at B, delivering a lower airflow thanintended. The solution to this problem is to either improve the system design orincrease the fan speed. At the higher speed, the system resistance and fanperformance curves intersect at C to deliver the design airflow. The fan mustgenerate more static pressure to deliver the intended airflow, requiring morepower than expected.Lower System Resistancesurgeregion (airflow'de e edspea n n spnfasig ew fdenstatic pressureactual systemresistance curveFigure 31On the other hand, if the system resistance is less than estimated, the actualsystem resistance curve falls to the right of the estimated curve.Instead of operating at the design operating point A, the actual systemresistance curve intersects the fan performance curve at D, delivering a higherairflow than intended.20TRG-TRC013-EN
period oneFan PerformancenotesReducing the fan speed causes the system resistance and fan performancecurves to intersect at E. The fan delivers the design airflow at a lower staticpressure, with less power required.In these examples, it was possible to compensate for the inaccuracies inestimated system resistance through fan speed adjustment. However, theactual fan operating points fell at conditions other than intended. Therefore, itmay be wise to re-evaluate the fan selection. Possibly another fan size wouldperform more efficiently at the revised system conditions.Static EfficiencyStatic Efficiency (SE) SE Power OutPower InAirflow Static PressureConstant Input PowerFigure 32A term commonly used to express the efficiency of a fan is static efficiency.Static efficiency expresses the percentage of input power that is realized asuseful work in terms of static pressure.The equation used to calculate static efficiency is:Power OutAirflow Static PressureStatic Efficiency (%) ------------------------------ ------------------Power InConstant Input Powerwhere, TRG-TRC013-ENAirflow is in terms of cfm [m3/s] Static pressure is in units of in. H2O [Pa] Constant is 6,362 [982] Input power is in units of hp [kW]21
period oneFan PerformancenotesStatic EfficiencySE SE 3,500 cfm 2.0 in. H2O 55%6,362 2.0 hp1.65 m3/s 491 Pa982 1.5 kW 55%Figure 33Let’s assume that the fan from the previous example, delivering 3,500 cfm[1.65 m3/s] at 2.0 in. H2O [491 Pa] of static pressure, requires 2.0 hp [1.5 kW] ofinput power. At these conditions, the fan’s static efficiency would be:3,500 cfm 2.0 in. H 2 OStatic Efficiency (%) -------------- 55%6,362 2.0 hp31.65 m /s 491 PaStatic Efficiency (%) - 55%982 1.5 kW22TRG-TRC013-EN
period oneFan PerformancenotesConstant-Volume Systemstatic pressuredesign systemresistance curvesurgeregionairflowFigure 34In a constant-volume system, where the fan is always delivering the sameairflow, the fan is generally selected to balance the airflow and static-pressurerequirements at a point on the fan curve that permits a certain margin of safetybefore surge occurs.As the coil and filters become dirty, the system resistance increases, causingthe system resistance curve to shift to the left. In response, the operating pointfollows the intersection of the system resistance and fan performance curves toa higher static-pressure condition. This margin of safety allows a certainincrease in system static pressure before the fan’s operating point reaches thesurge region. Of course, as the fan is called upon to generate more staticpressure to overcome this increased system resistance, its airflow is reducedaccordingly.TRG-TRC013-EN23
period oneFan PerformancenotesVariable-Pitch Vaneaxial Fanvariable-pitchbladesFigure 35The fan performance curves discussed so far are typical of both the centrifugaland fixed-pitch vaneaxial fans. To complete the discussion, the fan performancecurves of the variable-pitch vaneaxial (VPVA) fan will be reviewed.While this type of fan operates at a constant speed, the pitch (angle) of itsblades can be adjusted to match the airflow and pressure requirements of thesystem.24TRG-TRC013-EN
period oneFan Performancenotessurge regiontotal pressureow erinput p85%80%55º50º70%15º20º25º50%30º35º40º45ºg le )(antc hipeb la dairflowFigure 36Unlike the previous fan performance curves, those of the VPVA fan are plottedon the basis of airflow, at various blade pitches, versus total pressure (staticpressure plus velocity pressure). This type of fan generates high air velocitiesand, therefore, high velocity pressures. To fully evaluate its performance, totalpressure is used to demonstrate both the static and velocity pressurecomponents.The dashed line defines the upper limit of airflow and total pressure, abovewhich a surge, or turbulent, condition is encountered. In addition, curves areplotted that define fan total efficiency at various airflows, total pressures, andblade positions.Fan total efficiency expresses the percentage of input power that is realizedas useful work in terms of total pressure. It is calculated by substituting totalpressure for static pressure in the static efficiency equation.Airflow Total PressureTotal Efficiency (%) ----------------Constant Input PowerTRG-TRC013-EN25
period oneFan Performancenotesdesign systemresistance curvetotal pressuresurge low40º45ºgle)(antchipebladFigure 37Similar to both the centrifugal and fixed-pitch vaneaxial fans, the intersection ofthe system resistance curve and the blade pitch curve establishes the airflowand total pressure at which this fan and this system will balance.While the system design conditions are typically stated in terms of staticpressure, the VPVA fan manufacturer provides conversion factors that enablethe system designer to establish the fan – system balance point in terms of totalpressure.26TRG-TRC013-EN
period twoFan TypesnotesAir Conditioning Fansperiod twoFigure 38The most common types of fans used in air conditioning applications are thecentrifugal and axial designs.Centrifugal FanFigure 39In a centrifugal fan the airflow enters the center of the fan from the side andfollows a radial path through the fan wheel. There are three principal types ofcentrifugal fans, each distinguished by the type of fan wheel used: forwardcurved (FC), backward inclined (BI), and airfoil (AF).TRG-TRC013-EN27
period twoFan TypesnotesForward Curved FanFigure 40Forward Curved (FC) FansThe first of these centrifugal fan wheels to be considered has blades that arecurved in the direction of wheel rotation. These are called forward curved, orFC, fans.FC fans are operated at relatively low speeds and are used to deliver largevolumes of air against relatively low static pressures. The inherently lightconstruction of the forward curved fan wheel does not permit this wheel to beoperated at the speeds needed to generate high static pressures.Forward Curved FanVSFigure 41The curved shape of the FC blade imparts a forward motion to the air as itleaves the blade tip. This, together with the speed of wheel rotation (S), causesthe air to leave at a relatively high velocity (V).28TRG-TRC013-EN
period twoFan TypesnotesThe static pressure produced by a fan is a function of the forward motion of theair at the blade tip. The FC fan can perform, within its airflow and static pressurerange, at lower rotational speeds than other types of fans.Forward Curved Fanstatic pressure30%applicationrangeairflowstatic efficiency50 to 65%80%Figure 42The ty
Please take a moment to comment on the effectiveness of this Air Conditioning Clinic. Air Conditioning Fans Level of detail (circle one) Too basic Just right Too difficult One of the Equipment Series Rate this clinic from 1-Needs Improvement to 10-Excellent TRG-TRC013-EN Content 123456789 10 Booklet usefulness 123456789 10