Transcription
Using Camera-Drones and Artificial Intelligence toAutomate Warehouse InventoryRené Kesslera , Christian Melchinga , Ralph Goehrsb and Jorge Marx GómezaabUniversity of Oldenburg, Ammerländer Heerstr. 114-118, Oldenburg, 26129, Germanyabat AG, An der Reeperbahn 10, Bremen, 28127, GermanyAbstractInventory is a very important, but also a very time-consuming manual process in warehouse logistics.This paper presents an approach to automate manual inventory using a camera-drone and various AIprocedures. Thereby, sensor technology, such as RFID, is avoided, and only the visual representationof the products and goods is used. We developed a custom dataset that was used for the training of anobject detection model to extract and count all relevant objects based on an image of the warehouse. Furthermore, we can show that different pre-processing steps and especially image augmentation methodscan significantly influence the performance of such models.Keywordsinventory, logistics, artificial intelligence, object detection, drones1. Motivation and problem statementLogistics plays a crucial role in today’s global economy - every company depends on reliableand intact logistics processes to create value. At the same time, logistics is subject to veryhigh margin pressure. On the one hand, improved service is expected from logistics serviceproviders, but on the other hand, customers do not want to to pay extra for it [1]. If themargin is to be maintained or even increased, this can only be achieved through savings ininternal processes. For many companies, digital transformation and the use of so-called smarttechnologies can be the solution for optimizing processes and procedures [2, 3, 4, 5], since manylogistics processes still involve a lot of manual effort, including inventory, which is essentialfor every company [6]. In practice and science, this is often referred to as Industry 4.0. Fourmain design principles apply to use cases in this area: Networking, information transparency,technical assistance and decentralized decisions [7]. The approach pursued in this work canalso be classified in these principles. Through the combined use of camera drones and methodsfor processing the data, such as AI, human abilities can be imitated: The processing of visualsignals. The result is that previously manual activities, such as the inventory process in awarehouse, could be automated.In A. Martin, K. Hinkelmann, H.-G. Fill, A. Gerber, D. Lenat, R. Stolle, F. van Harmelen (Eds.), Proceedings of the AAAI2021 Spring Symposium on Combining Machine Learning and Knowledge Engineering (AAAI-MAKE 2021) - StanfordUniversity, Palo Alto, California, USA, March 22-24, 2021." rene.kessler@uol.de (R. Kessler); christian.melching@uol.de (C. Melching); ralph.goehrs@abat.de (R. Goehrs);jorge.marx.gomez@uol.de (J.M. Gómez) 0000-0002-6426-9266 (R. Kessler) 2021 Copyright for this paper by its authors.Use permitted under Creative Commons License Attribution 4.0 International (CC BY 4.0).CEURWorkshopProceedingshttp://ceur-ws.orgISSN 1613-0073CEUR Workshop Proceedings (CEUR-WS.org)
The goal of the inventory is to record the type and number of internal goods and to quantifythis inventory with an exact value [6]. The actual process of inventory can differ not only incompany-specific factors but also in the fact that two types of inventories are common. Thus,a distinction can be made between physical inventory, i.e. counting physical goods, and thenon-physical inventory, where, for example, financial goods or bank balances are recorded. Inthis paper, further focus will be on physical inventory. According to the German CommercialCode (HGB), German companies are obliged to carry out an inventory atleast once a year1(paragraph 240 German Commercial Code). While this cycle may be sufficient for companieswith little movement of goods, it makes sense to keep shorter cycles especially for companiesin the retail sector. However, the inventory can also be understood as an instrument of qualitymanagement concerning transparency in order to be able to monitor the business goals andtheir achievement. With the help of an inventory, deficits, faulty processes, non-optimal flows,or even theft can be detected. During an inventory, there is always a large amount of personneleffort involved. Depending on the inventory’s size and scope, several people are often exclusively occupied with the manual counting of the goods. Inventory not only causes personnelcosts, but also disrupts operational processes. Therefore, companies find themselves in a dichotomy between transparency and costs, which is why they often work with samples whosefindings can then be extrapolated to the entire inventory. This business conflict can be resolvedby automating the manual localization and identification of products and goods during inventory, resulting in greater transparency at lower costs [8]. Existing approaches are based on theuse of sensor technology and often only consider a very specific sub-area (e.g. industries). Inthis paper, a generic approach is followed, which exclusively involves the visual representationof the products and is based on deep learning methods. To also automate the acquisition of theimages and thus to evaluate a vehicle for the operationalization of the approach, a drone is alsoused, which has already proven itself in comparable applications [9, 4, 10, 11]. Combined withthe current problems in inventory processes described above and the great potential throughautomation of these process steps, this leads to the research question:Which AI procedures are suitable to recognize products on images in order to countthem for an inventory?To solve the described problem, a data-driven approach was followed, which was orientedtowards the established CRISP-DM model [12, 13]. During implementation, the company cooperated intensively with a North German beverage distributor, which has several storage locations and a high volume of trade in the B2B sector. Initially, domain knowledge about thestorage locations and the inventory process was collected in several workshops and discussions. Also, we were granted access to the different warehouses in order to record the customdataset (3). Finally, the results of the experiments were presented to the practice partner, andpractical implications were derived.The paper is structured as follows: In the next section, Related Work (2), an overview ofthe current research work is given. Section three, Dataset (3), is dedicated to the structure ofthe specially compiled dataset and its annotations. The fourth section, Experiment and Results1https://www.gesetze-im-internet.de/hgb/ 240.html, accessed on 20.11.2020
(4), represents the core of the work and describes the methods used and their results. In theconcluding section, Discussion and Future Work (5), the results are summarized, and an outlookon further work is given.2. Related workA search for related work has led to identifying numerous publications that deal with dronesin logistics and use of digital technologies to optimize or even automate the inventory process.Two main lines of research have been identified and are presented below.Locating and identification utilizing sensor technology: Radio-Frequency Identification(RFID) tags are a widespread and established method to track products and load carriers ina warehouse [14, 15, 16], and to achieve an increase in transparency regarding warehousemovements [17]. Often RFID readers are attached to a drone, and the drone flies over storagelocations and tracks the individual goods [18, 15, 19, 9, 3, 20, 8]. Drones can detect storagelocations that would otherwise be difficult to reach (e.g., very high storage locations in a highrack) and minimize the risk for the employees [16, 21]. In summary, the identification of loadsusing RFID, especially in combination with a drone, has proven to save costs and automateinventory processes [17]. However, this always presupposes that the loads are equipped withRFID tags, representing a further cost factor in logistics.Reading optical product features or characteristics: There is a necessary consensus thatimage processing in logistics can be a great advantage for the traceability and monitoring ofgoods [22]. If camera-drones are used in inventory management, they are often used as amedium for reading optical product annotations, such as one-dimensional barcodes or QRCodes [23, 24, 8]. However, these approaches assume that those annotations exist. Consideringpacked products, barcodes are often available and do not pose a problem. But with unpackagedgoods or empties, optical annotations are rarely present. Here is a need for solutions that focuson the optical representation of goods. Although both AI-based image processing and the useof drones are considered to have great potential in logistics [25, 10, 8], there are hardly any publications available that combine these two approaches. Freistetter and Hummel (2019) outlinedan approach to drone-based inventory in libraries. They flew off bookshelves and identifiedbook spines using computer vision techniques. As soon as a book is in the center of the image,the title of the book is read [26]. This is a particular indoor use case. Despite the fundamental similarity, a use case from a library cannot necessarily be transferred to larger industrialwarehouses. Especially concerning disruptive factors (e.g. environmental influences, such aschanging weather, which can lead to different lighting), recordings in libraries are less affected.Dörr et al. show an approach that deals with a similar use case in the warehouse area. The goalof the approach is product structure recognition based on image data. Different convolutionalneural networks are used based on top of each other. For the training of the models a separatedataset was built [27]. The very recent publications show that the combination of drone-basedinventory and AI image processing is currently subject of research [16].Especially the approach of Dörr et al. shows many similarities to our approach presented
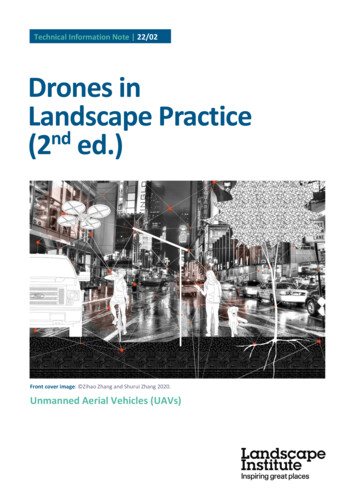
Figure 1: Exemplary sample from the final datasethere, e.g., the hierarchical structure with several deep learning models [27]. However, thereare also several differences. The approaches differ in their place of use since this thesis is anoutdoor use case. Also, the type of objects to be identified differs.3. DatasetThe use case considered here focuses on the automated recognition of beverage pallets on images. Since there is no public dataset for this specific problem, we developed a custom dataset.The structure and further processing of the dataset is described in the following.Data Acquisition: A drone of the model DJI Phantom pro 4 v2 2 was used to make the videorecordings in the warehouses of the practice partner. The drone was selected because it wasalready available for the research project, so there was no need to purchase a new drone. In addition, the characteristics of this drone are very common, which is why the findings are equallytransferable to other drone models. The video recordings were made in Full-HD resolution, aframe rate of 30 frames per second and using the built-in image stabilization. To create thegreatest possible variance in the data, the recordings were made over four days and at twolocations of the beverage dealer. The aim was to record the weather’s influence on the images(e.g., brightness) by recording the images under different conditions. During the project, twodays with sunny weather and one day each with cloudy and very cloudy weather were used forthe recording. Special attention was also paid to the recorded scenes. We tried to capture allpallet locations of the outdoor warehouse. It could not be avoided that not all types of pallets(e.g., different manufacturers of beverages) are represented equally often in the data becausethe different pallets’ stock varies very much in reality.After finishing the video recordings, the video data had to be processed. For this purpose, thefilmed sequences were viewed manually, and irrelevant scenes were removed (e.g., the drone’sstarting and landing sequences). Since there are only marginal differences in subsequent framesat 30 frames per second, only every 30th frame of the video clips was transferred to the finaldata set when the training data set was created to avoid potential overfitting when trainingthe neural network. After the frames’ automated extraction, they were manually sighted, andfaulty or low-quality images were removed. The final dataset consists of 336 images, separatedinto train and test set. The test set only contains images from pallet stacks that are not includedin the train set to avoid memorization. This includes pallets with beverages of previously un2https://www.dji.com/de/phantom-4-pro-v2/specs
seen brands and breweries.Data Annotation: After image acquisition, annotation has been applied using the tool labelstudio from Heartex 3 . This tool was used because it offers many possibilities for annotatingimages and was already used in another context within the research project. In this process,each pallet that was largely visible was annotated using polygons instead of only boundingboxes to make use of the annotation masks later on. Additionally, each polygon was given aclass to differentiate between two types of pallets, pallets containing cases of beer and palletscontaining other beverages. The resulting annotations were exported and converted to theCOCO dataset format [28], as it is one of the standard formats for object detection and segmentation in images that are widely supported by most frameworks. This results in a trainingset containing 284 images with 5261 annotated polygons and a test set containing 52 imagesand 1471 polygons.4. Experiment and ResultsThe experiment was conducted as follows. First a baseline model was used to test the impactof various modifications of the input data on the prediction accuracy. Then, several modelsusing different architectures, selected based on defined criteria, were trained to evaluate theirperformance applying the identified modifications using the baseline model. Finally, the bestperforming model was used to perform a qualitative evaluation and to identify possible errors.4.1. Baseline ModelThe model used during the following experiments is a Mask R-CNN using a ResNet50 Backbone, implemented using Detectron2 [29, 30]. The model was pre-trained using the MSCOCO17dataset to try to make up for the low amount of images in the used dataset, described in 3. Itwas then trained over up to 4000 iterations, where each iteration used a batch of twelve images.Evaluations of the model were performed every 250 iterations during training, and once thetraining was completed. During training and testing, the images were resized to 1000x750 andnot further modified. To validate each experiment’s results, it was repeated multiple times; thefollowing metrics are averages over all runs. For all experiments the same train-test-split wasused.4.2. Initial Results and AdjustmentsThe initial baseline model achieved an average precision of 27.06 and 27.59 evaluating boundingboxes and segmentation respectively, using the test portion of the dataset. As these results arefar from sufficient to predict the pallets’ position on images accurately, significant adjustmentswere necessary to improve the performance of the model.3https://labelstud.io
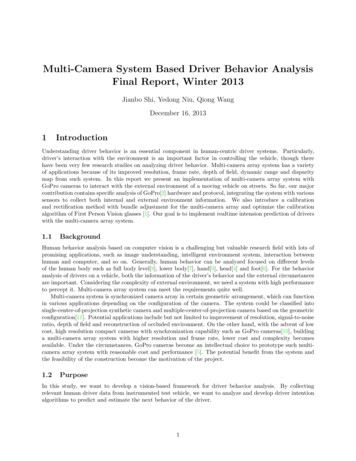
Figure 2: Example of an image (left), its simplified version (middle) and its annotations (right).4.2.1. Merging of classesDuring the first tests, it became clear that the model had difficulties in classifying the palletsgiven the annotated classes (beer and other beverages). Not only was the per-class-precisionmuch higher on the pallets marked as containing cases of beer (33.647 compared to 20.463,evaluating bounding boxes), some pallets were often wrongly classified. While this problem’sorigin likely lies within the training data that contained more annotations and variants of pallets of beer cases, it is challenging to balance the classes to reduce this spread since nearly allimages contain pallets of both categories. The classes have been merged to create a model topredict only the bounding box and segmentation mask of a pallet, not further classifying itscontents to circumvent this problem. If applied like this, the classification task must be processed by a different system, possibly using classifier or brand detectors. This work has not yetfurther pursued the creation of such a solution.A model trained on a classless dataset achieves an average precision of 45.95 and 46.70 onbounding boxes and masks, as noted in table 1. A following manual inspection of the predictions also confirmed the increase of the quantity and quality of the predictions.4.2.2. Reduction of image areaAnother problem of the model was the detection of small pallets on the edges of the images.It is likely caused by the low amount of small objects in the training data and distortion of thecamera lens on the edges of the image. This problem can be addressed by cutting off parts onthe left and right edges of the recordings. This should not harm the quality of the inventoryprocess as the drone flight is planned to fly so that each row is at least once near the centerof the recorded images and therefore not lost in this process. An example of such reduction ofthe image contents is visible in figure 2 where 50% of the image have been removed, in equalparts on each side. During the training and evaluation process, the input images were resizedto 750x750 instead of 1000x750, to better match the aspect ratio of the modified images. Theresulting model achieves values far better than before the removal. This is expected as theproblem is simplified significantly. The model achieves a mean Average Precision (mAP) of47.68 and 46.70 evaluating predicted bounding boxes and segmentation, respectively.4.2.3. Image augmentationImage augmentation is widely used in many research projects [31, 32, 33], but can have different effects depending on the problem [27]. Therefore, different image augmentation methods
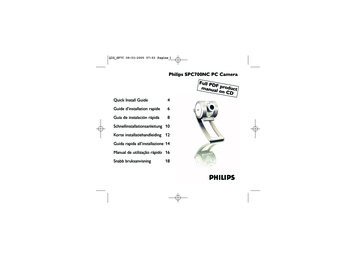
were tested and evaluated based on the performance of the models trained using augmentedimages. The augmentation of the original images was applied using imgaug 4 during the loading of the image batch of each iteration. Each image of the batch was augmented individuallywith random parameters in given boundaries. As imgaug offers a wide variety of methods toaugment images, some were selected to evaluate its performance on the given problem. In thiscase we chose augmentations to simulate variations of real recordings, such as MotionBlur, PerspectiveTransformation, Contrast and JpegCompression, to accommodate for movement of thedrone, varying lighting and weather conditions, while also considering methods used traditionally to adapt the image, Rotation, ScaleXY, FlipLR and CropAndPad. The following methodswere chosen for comparison.(a) FlipLR - Performs a horizontal flip with a probability of 0.5.(b) ScaleXY{150,125} - Scales the width and the height of the images with using randomvalues from [0.5, 1.5] for ScaleXY150 and [0.75, 1.25] for ScaleXY125.(c) Rotate{10,20,30} - Rotates the image around its center using random degrees up to 10 forRotate10, 20 for Rotate20 and 30 for Rotate30. Rotations can applied in both directions.(d) Contrast - Increases or decreases the contrast of the image using random values from[0.5, 1.4].(e) JpegCompression - Reduce the quality of the image by applying Jpeg compression using a random degree from [0.7, 0.95].(f) MotionBlur - Creates a motion blur effect with a kernel of size 7x7.(g) CropPad{25,50} - Remove random percentage of images from all edges and pad the imageto its original size. Using random values from [-0.25, 0.25] for CropAndPad25 and from[-0.5, 0.5] for CropAndPad50.(h) PerspectiveTransform - Transforms the image, as if the camera had a different perspective using random scales from [0.01, 0.1].(i) FlipLR-ScaleXY150 - Combines FlipLR and ScaleXY150.(j) CropPad25-ScaleXY150 - Combines CropAndPad25 and ScaleXY150.(k) Rotate20-ScaleXY150 - Combines Rotate20 and ScaleXY150.An overview of the effect of these augmentations is displayed in figure 3. Some of the testedaugmentations were omitted in the figure as their effects are barely visible due to the size ofthe individual images or are variations or combinations of already displayed effects.It has to be noted that after the application of one or multiple augmentations the boundingboxes were recomputed according to the transformed mask, to make them a minimal fit tothe object again. Otherwise, some augmentations, such as Rotation, could create a boundingbox according to the transformed bounding box, which could be too large to accurately locatethe object. In some situations, this results in a small, but measurable, boost of performance ofmodels using affected augmentations.4.2.4. Baseline resultsTo evaluate the different possible modifications, we trained several models using the samesettings and evaluated them on the shared test set. For the evaluation of the different methods,4https://github.com/aleju/imgaug
Figure 3: Examples of results using various selected augmentation methods, applied to “Orignal”.we compared both the mAP of the predicted bounding boxes and the mAP of the segmentations,even though they are very similar, displayed in table 1.The best performing model without the use of image augmentation was the model trainedusing the simplest variation of the images, utilizing the cutting of edges and merging of different classes. It achieved a precision of more than 70 and therefore performs better than mostother models, including many models trained using image augmentation. Once image augmentation (Table 1) is considered, the model trained on unaugmented images is outperformed byseveral different models. While nearly all models using merged classes and cut images performbetter, only a few models using a different image base produce comparable or better results.Especially interesting are the effects of specific augmentation methods. While the Rotationaugmentation decreased the accuracy of models using images with uncut edges, it increasedthe precision on images scaled to a 1:1 aspect ratio. Some methods seem almost always toreduce the prediction quality, such as Contrast (d), JpegCompression (e), and MotionBlur (f).While the idea behind using these methods was to make images slightly more corrupt to increase the ability to learn from realistic variations of these images, it mostly hurt performance.Other augmentation methods used, such as ScaleXY (b), FlipLR (a), and CropPad (g), seem toalways improve the results of the trained model when used alone or in combination with othermethods, contrary to the observation by Dörr et al. This is supported by the fact that thealmost always best-performing method used the combination of ScaleXY (b) and FlipLR (a).4.3. Evaluation of other architecturesWhile the results provided by the different Mask R-CNN models certainly provide valuableinformation, the model itself is no longer state-of-the-art in terms of precision. Therefore weselected three different models and tested their performance using the results gained usingthe previous model. The first model we additionally tested is DetectoRS [34], whose innovative characteristic is the use of Recursive Feature Pyramids. It achieves near state-of-the-artperformance on the MSCOCO17 dataset and was implemented and trained using MMDetecion [35]. The second model selected is Yolact [36]. Yolact is an architecture that is able togenerate predictions of the recordings in near real time and was trained using the MMDetection framework aswell. While real time predictions are not necessary during the stocktaking
Table 1Results of various experiments and combinations of possible modifications. Each entry “A/B” denotesthe mAP of the bounding boxes and the segmentation respectively.(a)(b)(c)(d)(e)(f)(g)(h)(i)(j)(k)No ss MergingLeftRight-CutMerging 1/79.93Table 2Performance values of different models using Merging Cut and augmentation (i).ModelMask R-CNNDetectoRSYolactDETRmAP (bbox/segm)Inference time (GPU)Inference time 80.04 s0.13 s0.05 s0.12 s1,72 sNot supported0.59 s2.10 s43,937,313131,648,61534,727,12342,835,552process, Yolact was selected since these models could easily be used to serve different purposeswithin the same domain. The third and last model evaluated is DETR [37] due to it’s innovative approach. DETR utilizes the transformer architecture introduced in the domain of NLP togenerate instance segmentations. It was chosen to evaluate whether or not new and innovativeapproaches can be applied to the domain of palettes, and trained using the code provided bythe authors5 .4.3.1. ResultsEach of the additional models was tested and evaluated on the test dataset, using the mergedand cut variant and the augmentation method (i) that showed to increase performance themost. The results are displayed in table 2. It is clear that DetectoRS outperforms all othermodels by a significant margin in terms of precision. It achieves a mAP of 88.3 and 85.6 whiletaking 0.13 s per frame using a NVIDIA GeForce RTX 2080 Ti, making it also slower thanall other models. In contrast, Yolact achieves the lowest mAP and, contrary to detr
Figure 4: Exemplary predictions using the best performing model, DetectoRS, according to table 2is not the fastest model, but is 0.01 s slower than Mask R-CNN. However, Yolact is by far thefastest model when using a CPU. DETR, with it’s new approach, is both both slower and lessprecise than Mask R-CNN and does not stand out in any metric.In addition to evaluation based on metrics, timings, and model size, a manual qualitativeevaluation was performed. This showed that the mAP value was consistent with the visualimpression. In terms of both bounding boxes and segmentation, DetectoRS provides the bestresults. Mask R-CNN also delivers satisfactory results, while the quality of DETR and Yolact inparticular falls off sharply.To get an impression of the quality of the predictions of DetectoRS, some of its predictionsare visualized in figure 4. The generated predictions are predominantly of high to very highquality. In a few cases, however, there are (partly) incorrect predictions (figure 5). Three typicalerrors can be described as follows:1. Recognition of side views of pallets: Despite the label strategy and the pre-processingsteps, in the case of images with a very specific acquisition angle, namely wheneverthe side views occupy a large image area, the isolated, incorrect identification of palletsoccurs, in which side views are provided with a bounding box and mask.2. Individual pallets are not recognized: The evaluation has shown that in rare casesindividual pallets are not recognized. The special feature here is that this error alwaysrefers only to a maximum of two pallets standing next to each other. All other palletson these images were recognized completely and without errors. Further optimizationof the detector parameters (e.g., tresholding) will most likely solve this error.3. Strongly overlapping bounding boxes: Pallets with boxes of different colors sometimes have overlapping bounding boxes. This has no consequences for the pallet recognition, but it could lead to problems in subsequent steps, such as the classification of thepallets. To solve this problem, further methods could be used in the preprocessing of theimages.5. Discussion and Future WorkIn this work, we present an initial step for automatized inventory using images recorded by adrone and an AI based object detector to identify the location of pallets on recorded images.
Figure 5: Visualization of Predictions with ErrorsVarious modifications have been tested to increase the accuracy of predicted bounding boxesand segmentation masks, partly without compromising the quality and direct usability of theresults. In doing so, we also showed that image augmentation methods could increase theprecision of models significantly, contrary to the observations in related projects [27]. In summary, it has been shown that horizontal flipping and image scaling as an image augmentationtechnique can have a positive impact on performance during model training. In particular, themodel architecture DetectoRS showed very good results in the experiments, measured by mAP(bounding boxes and segmentation), although not being the fastest in comparison. While already delivering promising results, there are certain factors limiting the usage of the developedmodels in practice.Firstly, a solution for the classification of the type or class of beverages on the pallets mustbe developed and integrated. While it would have been preferable to predict its class usingthe same model that also predicts its location, tests showed it impacted its localization performance significant
movements [17]. Often RFID readers are attached to a drone, and the drone flies over storage locations and tracks the individual goods [18,15,19,9,3,20,8]. Drones can detect storage locations that would otherwise be difficult to reach (e.g., very high storage locations in a high rack) and minimize the risk for the employees [16,21].