Transcription
Tour-Based Mode Choice Modeling: Using AnEnsemble of (Un-) Conditional Data-Mining ClassifiersJames P. Biagioni*Ph.D. CandidateDepartment of Computer ScienceUniversity of Illinois at Chicago851 South Morgan Street, Chicago, IL 60607Phone: (312) 355-0349E-Mail: jbiagi1@uic.eduPiotr M. SzczurekPh.D. CandidateDepartment of Computer ScienceUniversity of Illinois at Chicago851 South Morgan Street, Chicago, IL 60607Phone: (312) 355-0349E-Mail: pszczu1@uic.eduPeter C. Nelson, Ph.D.Professor, Department of Computer ScienceDean, College of EngineeringUniversity of Illinois at Chicago851 South Morgan Street, Chicago, IL 60607Phone: (312) 996-2400Fax: (312) 996-8664E-Mail: nelson@uic.eduAbolfazl Mohammadian, Ph.D.Associate ProfessorDepartment of Civil and Materials EngineeringUniversity of Illinois at Chicago842 West Taylor Street, Chicago, IL 60607Phone: (312) 996-9840Fax: (312) 996-2426E-Mail: kouros@uic.eduPaper submitted for potential presentation and publication at the 88th Annual Meeting of theTransportation Research BoardAugust 1st, 2008Word Count: 5,430 2 Tables 6 Figures 7,430 words* Corresponding author
Biagioni, Szczurek, Nelson and Mohammadian1Tour-Based Mode Choice Modeling: Using AnEnsemble of (Un-) Conditional Data-Mining ClassifiersJames P. Biagioni, Piotr M. Szczurek, Peter C. Nelson and Kouros MohammadianABSTRACTThis study aims to take the lessons learned from the history of applying data-mining techniquesto mode choice modeling and extend it with the characteristics inherent to tour-based datasets. Indoing so, a novel adaptation of existing data-mining methods is developed through the use of anensemble of conditional and un-conditional classifiers. By defining the notion of an “anchormode” as the mode selected on the first trip of a tour, this ensemble of classifiers is trained withand without knowledge of the anchor mode respectively. This allows the un-conditional model tomake mode predictions without pre-condition for the first trip on a tour, followed by theconditional model which then makes mode predictions for the subordinate trips on a tour, giventhe knowledge of the selected anchor mode from the previous trip. This method was tested on thenew Chicago Travel Tracker Survey dataset, and prediction performance was evaluated acrossfour different data-mining algorithms where the best performing solution was arrived at using acombination of Naïve Bayes for the un-conditional classifier and C4.5 for the conditionalclassifier. Performance was measured using metrics from the field of information retrieval, andable to demonstrate an appreciable gain by using this method. For the purposes of evaluating thistechnique compared to traditional discrete choice methods, (un-) conditional multinomial logitmodels were also constructed and compared to the data-mining based solution. While theperformance of the multinomial logit was reasonable, the data-mining solution proved to havebetter prediction performance overall.KEYWORDSData Mining, Ensemble Method, Travel Mode Choice, Decision Trees, Naïve Bayes, LogisticRegression, Support Vector Machines, Multinomial Logit Models
Biagioni, Szczurek, Nelson and Mohammadian2INTRODUCTIONMode choice modeling is an integral part of the four-step travel demand forecasting procedure,and as such, has received tremendous attention from statisticians in an attempt to predict thedistribution of mode selection across a population. For years, discrete choice models (1) havedominated this area of research, however, more recently increasing attention has been paid todata-mining techniques borrowed from the artificial intelligence and machine-learningcommunities (2, 4, 5, 6, 7), who boast a menagerie of powerful predictive models capable ofhandling the same multi-attribute data used by traditional models.This study extends the long lineage of existing research that has successfully applieddata-mining methods to the problem of mode choice modeling in comparison to existingstatistical techniques. An early example of this comparison can be found in Wets et al. (2) wherethey compare the performance of decision-tree algorithms C4 and CHAID against themultinomial logit model (MNL), for predicting mode choice across the activity-based traveldiary data collected for the development of the Albatross (3) system. The data was collectedfrom 1,500 households, of which 2,974 person-day diaries were selected and augmented withcomplementary data, including shortest-route travel times. After building the three models,experimentation determined that while there was no appreciable difference in terms of predictionaccuracy, that the decision-tree methods tend to be more robust than the MNL model, and benefitfrom being free from predefined utility functions.Hensher and Ton (4) then compared the performance of nested logit models against thatof artificial neural networks, for the purpose of predicting commuter mode choice. Models werebuilt based upon a stated-choice experimental dataset collected in Sydney and Melbourne,Australia, as part of a broader effort to examine the potential impact of two new transport modes.The researchers point out that while the nested logit models outperform neural networks at anaggregate level, neural networks outperform nested logit models at an individual level – givingno clear indication as to which method is better overall. Despite this ambivalence however, theydo note that neural network models might be preferable in certain situations, as they feature agreater resistance to noise in the data.In Xie et al. (5) they compare the performance of decision-tree algorithm C4.5 and themulti-layer feed-forward neural network (MLFNN), against the multinomial logit model, for thepurpose of predicting work travel mode choice. Models were built on the two-day travel diariesof the San Francisco Bay Area Travel Survey (BATS) 2000 data set, using two sets of variables:individual/household socio-demographic and trip level-of-service. Experimental results betweenthe data mining techniques show that although the MLFNN model outperforms the C4.5decision-tree in terms of prediction accuracy, it shows worse transferability due to overfitting thedata. When compared to the MNL model, experiments show similar performance across all threemethods on an aggregate dataset, while the MLFNN model performs best on an individualprediction level. The authors conclude that both data-mining methods outperform the MNLmodel overall, with the MLFNN model being best for prediction accuracy, while the C4.5 modelbest for interpretability.Zhang and Xie (6) then compared the performance of support vector machines (SVM)and multi-layer feed-forward neural networks (MLFNN) against the multinomial logit model, forthe purpose of predicting commute mode choice over the San Francisco Bay Area dataset,consisting of 5029 home-to-work commute trips. This paper is the first to introduce SVM’s forthe purpose of mode choice modeling, driven by the theoretical underpinnings of the method,
Biagioni, Szczurek, Nelson and Mohammadian3which ensure a globally optimal solution and greater generalization ability than other existingmachine-learning algorithms. In their experiments they find that SVM has better performancethan the other two models in predicting mode choice; even though MLFNN’s fit the training databetter, they suggest it might be overfitting as its predictions on unseen data are worse. Theauthors favor the fact that SVM’s do not assume a model structure apriori, but dislike the factthat it is a black box model – especially when compared to the transparency of the MNL model.They suggest that work on sensitivity analysis of neural networks might be applied to SVM’s inorder to determine its econometric features.Lastly, Moons et al. (7) compared the performance of support vector machines (SVM)and classification and regression trees (CART) against (semi-) linear statistical models, for thepurpose of predicting mode choice across the activity-based travel-diary data collected for thedevelopment of the Albatross (3) system. The dataset, which consists of 1025 observations, issplit into three sets: one for prediction of slow transport, one for prediction of public transport,and one for prediction where the automobile is used to drive. Explanatory variables includeperson and household characteristics, as well as characteristics of the work pattern. In theirexperiments on the public transport dataset they find that the logistic regression model providesthe best prediction quality, with SVM coming in second (although with obvious overfittingproblems), followed by CART. On the slow transport dataset, SVM performs the best with noobvious overfitting this time, followed by logistic regression in second and CART in third. Onthe auto-drive dataset they again find that SVM performs the best, this time followed by CART,with parametric models performing worst. The authors conclude that on very skewed datasets the(semi-) linear models usually outperform SVM and CART, while on better balanced datasets theperformance of SVM and CART is comparable, and often somewhat better than the (semi-)linear models.This study aims to take the lessons learned from the history of applying data-miningtechniques to mode choice modeling and extend it with the characteristics inherent to tour-baseddatasets. Close attention has been paid to the relationship between mode and trip-tours in thetransportation literature, in particular Cirillo and Axhausen (8) analyzed mode choice at the tourlevel using the Mobidrive data set, which consists of six-week travel diaries from 145 individualsand 67 households. Examination of the dataset revealed that travelers tend not to change modesduring a tour, or even for a whole day – a finding which supports the long-held belief thattravelers maintain their mode during a tour, especially if they use an individual vehicle (car,motorcycle or bicycle). The authors suggest that mode choice models take this into considerationwhen building predictive models, going so far as to build their own discrete choice modelswherein the assumption is explicitly made that travelers do not switch modes within a tour.In light of these findings, Miller et al. (9) constructed a tour-based model of travel modechoice, using an agent-based architecture to represent individual trip-makers within the contextof their household demands. This model establishes the concept of an anchor point, which isused as a decision point for individual agents to decide whether or not to take a vehicle for theircurrent tour. If the agent decides to take a vehicle, they are bound to using it for the entire tripchain, whereas if they select another mode of transportation they are free to select any othermode independently throughout the tour. In addition to this mode selection logic, the model alsotakes into account household demands in the form of vehicle allocation (whereby overallhousehold utility is maximized if there is contention over which agent should take the vehicle),ride-sharing and joint travel tasks (i.e. where household members share the auto for whole/part ofa tour). The authors’ prototype implementation featured the mode-choice and vehicle allocation
Biagioni, Szczurek, Nelson and Mohammadian4logic (leaving the ride-sharing and joint travel components for future work), allowing it to worksuccessfully as part of a microsimulation framework.This study investigates a novel adaptation of the data-mining methods aforementioned,by using an ensemble of (un-) conditional classifiers, focused around the notion of an anchormode for tour-based trips, in order to predict mode choice at the trip level. This research aims toprovide a boost in predictive power for mode choice modeling using data-mining techniques,without necessitating the development of an explicit agent-based framework such as that foundin Miller et al. (9). For the purposes of evaluating this technique compared to traditional discretechoice methods, (un-) conditional multinomial logit models are also constructed, and aperformance comparison to the data-mining method given.(UN-) CONDITIONAL CLASSIFIERSTaking the key lesson learned from Cirillo and Axhausen (8) – that travelers tend not to changemodes during a tour – the notion of an “anchor mode” is used in this study. Similar to theconcept of an “anchor point”, as used in Miller et al. (9), anchor mode simply refers to the modeselected when departing from an anchor point (usually home). To incorporate this informationinto the raw data, it is augmented to include the anchor mode attribute for all subordinate trips ina tour.A distinction must be drawn between the way “anchor mode” is used in this study, asopposed to the way it is used in Cirillo and Axhausen (8): namely, rather than mandating thateach subordinate trip in a tour use the anchor mode as the selected mode, it is simply included asan additional attribute in the dataset, allowing the data-mining algorithms to draw data-drivenconclusions about the relationship between anchor mode and the selected mode for a trip, ratherthan assuming a 1:1 correspondence exists apriori. Such an assumption would be particularlyundesirable for cases where a mode such as public transport is chosen as the anchor mode, asCirillo and Axhausen (8) point out: a lot of mode variability exists in such tours, as travelers caneasily include walking or taxi trips as they do not have to return to their parked vehicles.The key component of the mode choice prediction method developed in this study, is thenotion of using an ensemble of un-conditional and conditional classifiers. “(Un-) conditional”classifiers, refers to the manner in which they are used for classifying instances: namely, an unconditional classifier is used to predict the selected mode used for the first trip on a tour withoutany pre-conditions (i.e. where no anchor mode exists), followed by the conditional classifier,which then incorporates (i.e. is conditioned on) the predicted anchor mode in order to predict theselected mode used for each subsequent trip on the tour. In this way, the model incorporates theanchor mode in a flexible, data-driven (i.e. it relies on the relationship derived between anchorand selected mode by the data-mining algorithms) manner, that doesn’t necessitate thedevelopment of an explicit agent-based mode-choice framework.DATA MININGIn order to build the un-conditional and conditional classifiers used in this study, four differentdata-mining algorithms were leveraged and tested with respect to their predictive performance:decision trees, naïve bayes, simple logistic and support vector machines. A description of each,including pointers to further information, follows.
Biagioni, Szczurek, Nelson and Mohammadian5Decision TreesDecision trees, one of the most widely used data-mining techniques, are constructed by means ofrepeated attribute partitioning. At each level of the tree (starting with the root), the algorithmselects the attribute whose partitioning will maximize the class-homogeneity among the datainstances being used for construction (typically through the use of a heuristic function, such asinformation gain ratio). The ultimate goal of the decision-tree algorithm is to partition allinstances into purely homogenous subgroups – allowing the series of partitions to formconvenient If-Then rules from root to leaf, that fully-describe all of the instances containedtherein. In order to avoid overfitting the training data, the tree is then typically pruned in order toincrease the generalizability of the decision structure. See (2, 5, 6, 8, 10) for more information.Naïve BayesThe Naïve Bayesian approach to data-mining takes a purely probabilistic perspective on things.Rather than attribute partitioning (like decision-trees), classification is simplified into the task ofestimating class posterior probabilities, i.e. for an example d (a vector of attributes: A1 a1, A2 a2, An an ), compute Pr(C cj d A1 a1, A2 a2, An an ), for all classes cj andsee which one is most probable (11). By making the assumption of conditional independence(i.e. all attributes are conditionally independent given the class C cj), Bayes’ rule simplifiesinto:nPr(C cj d A1 a1, A2 a2, An an ) Pr(C cj) Pr(Ai ai C cj)i 1Since we only need a decision on the most probable class for each instance, we only keepthe numerator (since the denominator is the same for every class). From here, the prior Pr(Ai ai C cj) can be easily estimatedprobabilities Pr(C cj) and conditional probabilitiesfrom the data by occurrence counts (for nominal attributes), and class predictions made. In caseof numeric attributes, the probability density function needs to be estimated. For this, the use ofkernel density functions is used in this work. See (10) for more information.Simple LogisticThe Simple Logistic method, as its name implies, is based on simple linear logistic regression.However, as a means to boost performance, the logistic regression model is supported by theLogitBoost algorithm (11) which fits a succession of logistic models, each of which learns fromthe classification mistakes made by the previous model, in order to fine-tune the modelparameters and find the best (least error) fit. The LogitBoost algorithm also performs crossvalidation on the dataset as a means to automatically select the best attributes for prediction,resulting in a simplified, best-fit logistic regression model. See (11) for more information.Support Vector MachinesSupport vector machines (SVMs) are binary classifiers that work by finding the maximummargin hyperplane that can separate two classes. Finding the maximum margin hyperplane isposed as a quadratic programming optimization problem which can be solved relatively
Biagioni, Szczurek, Nelson and Mohammadian6efficiently. To handle cases where data is not linearly separable, the use of soft margins isemployed, which modify the formulation of the problem to allow for misclassifications in thedata. The degree to which misclassifications are allowed is specified via a tunable complexityparameter. Additionally, the so-called “kernel trick” can be used in support vector machines toallow non-linear separation boundaries. The “kernel trick” refers to replacement of the dotproduct used in the problem formulation with a kernel function, which allows for transformingthe data into a higher dimensional space. The idea is, that data which is not linearly separable inthe given dimension, will become linearly separable in some higher dimensional space. Supportvector machines are thus capable of handling a variety of data in a robust manner. While beinginherently binary classifiers, SVMs can also be used for multi-class problems by usingtechniques such as pairwise coupling. See (12, 13) for more information.Ensemble MethodIn an attempt to increase the accuracy of classification, ensemble methods build multipleclassifiers and use their outputs as a form of voting for final class selection. One of the mostpopular of these methods is known as AdaBoost. This algorithm works by training a sequence ofclassifiers, each of which is dependent on the previous one by re-weighting the dataset to focuson the previous one's errors (10). Typically, those examples that are classified incorrectly aregiven higher weights. Classification is performed by passing each example to the set ofpreviously built classifiers, and combining their (weighted) output to determine the final class.See (10, 14) for more details.DATAIn order to build the classification models developed in this study, a large activity-based datasetwas drawn from the Chicago Travel Tracker Survey, provided by the Chicago MetropolitanAgency for Planning (CMAP). It consists of 1- and 2-day activity diaries from 32,118 peopleamong 14,315 households in the 11 counties neighboring Chicago, and features 35,548 toursdecomposed into 218,005 trip-links, complete with rich socio-demographic and trip-basedattributes. This study marks one of the first uses of this data for building experimental modechoice models.Pre-ProcessingThe raw survey data was pre-processed (i.e. cleaned) to remove attributes and rows thatcontained a large number of missing values. Great care was taken to ensure that complete tourswere preserved – thus, those rows that contained missing values were removed along with theircontaining tour in order achieve this goal. As a result of the pre-processing steps completed, thecleaned data used for experimentation contained a total of 19,118 tours decomposed into 116,666trip-links.Supplementary Data
Biagioni, Szczurek, Nelson and Mohammadian7In order to supply values for non-selected modes, supplementary data was obtained from CMAPthat contained inter-zonal travel times. Based on the geocoded activity-locations in the TravelTracker Survey data, a mapping between these two datasets was easily established.Dependent VariableThe dependent variable in this study is the selected mode for a given trip. From the TravelTracker Survey data eight modes were identified for predictive modeling: walk, bike, auto-drive,auto-passenger, Chicago Transit Authority (CTA) bus (i.e. urban bus), CTA train (i.e. urbantrain), Pace bus (i.e. suburban bus), Metra train (i.e. commuter rail).Independent VariablesThree sets of independent variables were used in this study: 1) trip-level variables: departuretime, arrival time, activity duration, primary trip purpose and total number of people traveling;2) mode-specific variables: travel time and average out-of-pocket cost; and 3)individual/household socio-demographic variables: gender, age, disability status, driver’s licensestatus, employment status, student status, number of vehicles in the household, age of vehicles,number of bicycles in the household, number of people in the household and household income.CLASSIFIER IMPLEMENTATIONSData Mining ToolkitFor the purpose of implementing the data mining algorithms, the Weka Data Mining Toolkit (15)API was leveraged within a custom-built Java application. This API provides commonimplementations of all of the data mining methods used in this paper. Parameter selection for thealgorithms was carried out by experimentation in order to optimize classification performance.Discrete Choice ModelThe discrete choice modeling software, Biogeme (16), was used for building the multinomiallogit models in this study. Both conditional and unconditional MNL model specifications weredeveloped, with and without the anchor mode attribute respectively. They were then tested in anexperimental framework that combines and evaluates the MNL models in a manner identical tothat of the data mining algorithms, on the same tour-based dataset.PERFORMANCE MEASURESIn order to appropriately evaluate the performance of the data-mining algorithms andmultinomial logit model, three metrics from the information-retrieval (IR) literature will beleveraged: accuracy, precision and recall. Precision and recall are commonly used when interestcenters around classification performance on a particular class (10) – in this case, we areinterested in the classification performance on 8 particular classes (modes) – as it allows a finegrained view of how precise and complete the classification is. Accuracy complements precisionand recall as it provides an aggregate representation of performance across all classes.
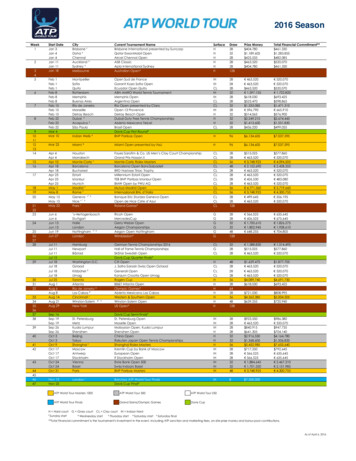
Biagioni, Szczurek, Nelson and Mohammadian8AccuracyWhereas precision and recall allow classification performance to be evaluated at an individualclass level, accuracy essentially summarizes these statistics into one comprehensive measure thatdescribes the percentage of correctly classified instances in a dataset. It is computed as thenumber of correctly classified instances, divided by the total number of instances classified (10).PrecisionPrecision measures the proportion of correctly classified instances among all of those instancesthat were similarly classified (18). It is computed as the number of correctly classified instancesof a particular class A, divided by the total number of instances classified as class A (10).RecallRecall measures the proportion of instances of a particular class that are correctly classified (18).It is computed as the number of correctly classified instances of a particular class A, divided bythe total number of actual class A instances in the dataset (10).For the purposes of evaluating performance on mode choice prediction, recall is the mostimportant evaluation metric of the three, as it precisely measures the behavior we are striving toachieve: being able to correctly identify the distribution of trips among the modes. It is superiorto the accuracy measure, since the mode choice problem is not so much a classification task, butrather, a problem of distribution estimation. As such, a good measure of performance for thisproblem would clearly be a sum of the deviation for each mode from the real distribution, whichis captured by the mean recall measure.EVALUATIONThe classifiers were evaluated in several stages. To test the usefulness of the anchor mode(ACRMODE) attribute for determining mode of transportation for a given trip, several classifierswere built with and without knowing the anchor mode. While in reality, the anchor mode willnever be known with 100% certainty, these tests provided the upper bound for any expectedperformance gain that could be achieved. The classifiers tested were: C4.5 decision trees, NaïveBayes, Simple Logistic, and SVM. The C4.5 decision trees were built using the defaultparameters supplied by the Weka software, which includes a confidence factor of 0.25 andminimum of 2 instances per leaf. Naïve Bayes classifier was implemented using kernel densityfunctions for numeric attributes. The Simple Logistic classifier also used default Weka values:cross validation is used and the maximum number of boosting iterations is 500. Support VectorMachines employed default values from Weka, except for the following: logistic models werebuilt to support proper probability estimates. Several kernel functions were tested, with the linearkernel demonstrating the best overall performance.The results, shown in Figures 1 through 3, show that the anchor mode is, in fact, a keyattribute for determining mode for a given trip. For every performance measure, knowing theanchor mode improves the classification performance of all tested techniques.
Biagioni, Szczurek, Nelson and Mohammadian9Accuracy Performance10.80.6w/o ACRMODE0.4w/ ACRMODE0.20C4.5Naïve BayesSimpleLogisticSVMFIGURE 1 Accuracy Performance with and without anchor mode attribute.Mean Recall Performance10.80.6w/o ACRMODE0.4w/ ACRMODE0.20C4.5Naïve BayesSimpleLogisticSVMFIGURE 2 Mean recall performance with and without anchor mode attribute.Mean Precision Performance10.80.6w/o ACRMODE0.4w/ ACRMODE0.20C4.5Naïve BayesSimpleLogisticSVMFIGURE 3 Mean precision performance with and without anchor mode attribute.
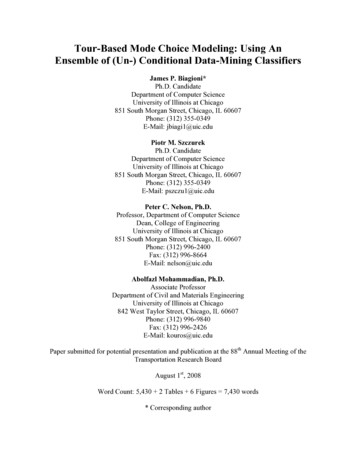
Biagioni, Szczurek, Nelson and Mohammadian10Given the performance gains shown by these tests, a second stage of testing was performed usingthe (un-) conditional models. As previously described, in this method, two classifiers are used:one (un-conditional) for estimating the mode on the first trip and another (conditional) forestimating the mode on subsequent trips. In the initial tests, both the conditional andunconditional classifiers are of the same type. All types of classifiers used in the first stage oftesting were used for these tests, along with the AdaBoost classifier. Two versions of theAdaBoost classifier were used: one was built using C4.5 decision trees, the other employed naïveBayes classifiers. The results of the tests are shown in Figures 4 through 6.Mean Accuracy Performance10.90.80.70.60.50.40.30.20.10w/o ACRMODEw/ Estimated ACRMODEFIGURE 4 Mean accuracy performance with and without estimated anchor mode.Mean Precision Performance10.90.80.70.60.50.40.30.20.10w/o ACRMODEw/ Estimated ACRMODEFIGURE 5 Mean precision performance with and without estimated anchor mode.
Biagioni, Szczurek, Nelson and Mohammadian11Mean Recall Performance10.80.60.40.20w/o ACRMODEw/ Estimated ACRMODEFIGURE 6 Mean recall performance with and without estimated anchor mode.The results, as can be seen in the figures, show that using the (un-) conditional models did notprovide any major improvements in performance. In fact, the performance measures of mostclassifiers are actually lower. Despite this, the results do show that using AdaBoost with C4.5decision trees provides the best accuracy (85.85%), and AdaBoost with Naïve Bayes providesthe best mean recall (49.96%). This observation suggested the idea of using different techniquesfor the conditional and un-conditional classifiers in order to combine the high accuracy ofAdaBoost-C4.5 with the high recall value of AdaBoost-Naïve Bayes. To evaluate this method, anumber of combinations of classifiers were used. The best performance was achieved whenusing AdaBoost-NaiveBayes as the unconditional classifier and AdaBoost-C4.5 as theconditional classifier (AB-NB/AB-C4.5). Other combinations were able to achieve similarperformance in terms of accuracy, but could not match the mean recall of AB-NB/AB-C4.5,which was over 4% higher when compared to the next highest performing model. Table 1summarizes the performance of these tests and compares it to the highest performing classifiersfrom the previous tests.
Biagioni, Szczurek, Nelson and llBest accuracy without using ACRMODE85.85%0.4453AdaBoost-C4.5 (w/ oattributeACRMODE)83.92%0.4945AdaBoost-NaiveBayes Best recall without using ACRMODEattribute(w/ o ACRMODE)Best accuracy with estimating ACRMODE 85.84%0.4363AdaBoost-C4.5 (w/byanunconditionalclassifierest. ACRMODE)84.31%0.4996AdaBoost-NaiveBayes Best mean recall with estimatingACRMODEbyanunconditionalclassifier(w/ est. ACRMODE)Best accurac
This study aims to take the lessons learned from the history of applying data-mining techniques to mode choice modeling and extend it with the characteristics inherent to tour-based datasets. In doing so, a novel adaptation of existing data-mining methods is developed through the use of an ensemble of conditional and un-conditional classifiers.