Transcription
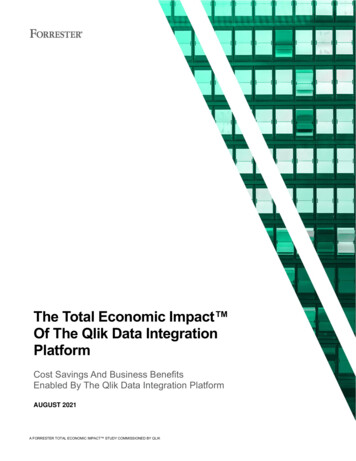
The Economic Impact of College BowlGamesSeptember 2016
TABLE OF CONTENTSContentsExecutive Summary 1Introduction 2Bowl Game EI Studies 4Analysis 5Limitations 7Research Team 8
EXECUTIVE SUMMARYExecutive SummaryThe following report provides a summary of the economic impact (EI) of college bowl gameson the US economy. Some 40 bowl games were played in 2015 in addition to the College FootballPlayoff National Championship. 1 This report uses both primary and secondary data collected fromthe 2014 and 2015 bowl game seasons. For the purposes of this report, total EI is defined as theexpenditure of money from sources outside the bowl game area that resulted from hosting theevents. Both direct EI from non-local attendees, such as spending on lodging, shopping andentertainment, and food and beverage is used to determine the total economic impact, as well asindirect impact which includes additional spending generated in the local area resulting from thebowl games.Bowl games were categorized by matchup and stratified to gain a more accurate assessmentof EI. The average bowl game EI ranged from 12,650,000 at the low end for Group of 5 vs. Group of5 to 93,773,880 at the high end for New Year’s Six matchups with an average of 40,372,220 perbowl. The total estimated economic impact of bowl games per year is story/ w-bowl-games1Page 1
INTRODUCTIONIntroductionSince the Rose Bowl was the first played in 1902 college bowl games have emerged fromcoast-to-coast and beyond in the United States. The term “bowl game” comes from this historicgame as well as the bowl shape of stadiums where the games are played. These post-seasoncontests are generally played by NCAA Division 1 schools and recently have helped to determine thebest team in the country. In 2015 40 college bowl games took place with an additionalchampionship game for a total of 41 bowl games. 2College bowl games are played at neutral sites all across the United States. From Texas toCalifornia, from Hawaii to Florida, these post-season contests are draws for team fans who travel, aswell as local spectators who attend the game every year. A critical component of bowl gameeconomic impact (EI) is the team matchup for the game. The teams who earn a bowl game selectionare different in terms of division, school size, number of fans, past success, national reputation andfan commitment. Consequently, a bowl game with top-tier teams and fans who travel en masse willlikely generate a larger EI than the reverse.For the purposes of this study, stratifying bowl games by matchup seemed appropriate sothat similar bowls could be compared. In 2015, the bowl games took place as follows:New Year’s Six: These six games are top-tier bowl games that are often used as a semi-finalfor the National Championship. This group includes Rose, Sugar, Orange, Peach, Fiesta andCotton BowlsPower 5 vs. Power 5: This group encompasses some of the best football programs in thecountry. Bowl games are matched up between the five power conferences including AtlanticCoast Conference (ACC), Big Ten (B1G), Big 12, Pac-12, and Southeastern Conference (SEC).Power 5 vs Group of 5: The next tier of bowl games includes selections from the Power 5group vs Group of 5. Group of 5 includes Mid-American, Mountain West, Sun Belt, Americanand Conference USA.Group of 5 vs Group of 5: The final group includes matchups drawn from Group of 5 only.http://espn.go.com/college-football/story/ yoff-bowl-schedule2Page 2
INTRODUCTIONTable 1 provides a list of all bowl games played in 2015 3.2015 Bowl GamePeach BowlOrange BowlFiesta BowlSugar BowlRose BowlCotton BowlCFP Championship GameHoliday BowlTexas BowlAlamo BowlMusic City BowlCitrus BowlOutback BowlLiberty BowlBelk BowlSun BowlPinstripe BowlFoster Farms BowlRussell Athletic BowlTaxslayer BowlCactus BowlLas Vegas BowlHeart of Dallas BowlMilitary BowlIndependence BowlArmed Forces BowlQuick Lane BowlBirmingham BowlNew Mexico BowlCamillia BowlCure BowlNew Orleans BowlMiami Beach BowlPotato BowlBoca Raton BowlPoinsettia BowlGo Daddy BowlBahamas BowlHawaiiSt. Petersburg BowlArizona BowlGroupingNew Year’s SixNew Year’s SixNew Year’s SixNew Year’s SixNew Year’s SixNew Year’s SixNew Year’s SixPower 5 Vs. Power 5Power 5 Vs. Power 5Power 5 Vs. Power 5Power 5 Vs. Power 5Power 5 Vs. Power 5Power 5 Vs. Power 5Power 5 Vs. Power 5Power 5 Vs. Power 5Power 5 Vs. Power 5Power 5 Vs. Power 5Power 5 Vs. Power 5Power 5 Vs. Power 5Power 5 Vs. Power 5Power 5 Vs. Power 5Power 5 Vs. Group of 5Power 5 Vs. Group of 5Power 5 Vs. Group of 5Power 5 Vs. Group of 5Power 5 Vs. Group of 5Power 5 Vs. Group of 5Power 5 Vs. Group of 5Group of 5 Vs. Group of 5Group of 5 Vs. Group of 5Group of 5 Vs. Group of 5Group of 5 Vs. Group of 5Group of 5 Vs. Group of 5Group of 5 Vs. Group of 5Group of 5 Vs. Group of 5Group of 5 Vs. Group of 5Group of 5 Vs. Group of 5Group of 5 Vs. Group of 5Group of 5 Vs. Group of 5Group of 5 Vs. Group of 5Group of 5 Vs. Group of 5LocationAtlanta, GAMiami Gardens, FLGlendale, AZNew Orleans, LAPasadena, CAArlington, TXGlendale, AZSan Diego, CAHouston, TXSan Antonio, TXNashville, TNOrlando, FLTampa, FLMemphis, TNCharlotte, NCEl Paso, TXBronx, NYSanta Clara, CAOrlando, FLJacksonville, FLPhoenix, AZWhitney, NVDallas, TXAnnapolis, MDShreveport, LAFort Worth, TXDetroit, MIBirmingham, ALAlbuquerque, NMMontgomery, ALOrlando, FLNew Orleans, LAMiami, FLBoise, IDBoca Raton, FLSan Diego, CAMobile, ALNassau, BahamasHonolulu, HISt. Petersburg, FLTucson, AZTable 1: 2015 NCAA Bowl tchup-information3Page 3
BOWL GAME EI STUDIESBowl Game EI StudiesBowl games conduct EI studies to determine how much money is brought in to the localeconomy from outside the local area. Perhaps the best way to look at the impact is to determinehow much money would be lost in the local area if the game did not take place. Identifying thisimpact is important for a variety of reasons. For example, bowl games that generate significanteconomic impact may get assistance from local government in the form of cost recovery forincreased police, fire or sanitation services. These bowls may be able to generate funding in theform of marketing dollars from local tourism districts. In addition, positive impact provides greateropportunity for both sponsorships and charitable endeavors.Not all bowls conduct EI reports but those that do follow a similar methodology. Theapproach detailed here provides a solid model for those seeking to explore EI. The goal of the studyis to determine the spending generated from non-local spectators who traveled to the local areaspecifically for the bowl. In some cases, spending by teams, coaching staffs, media, bands andcheerleaders who travel for the game would be included as well. Data are collected eitherelectronically or by intercept interview. Traditionally the following question would be included onan EI survey: Spectator place of residenceHotel stay or otherNumber of hotel nights stayingAverage daily rate of hotel (ADR)Bowl impact on travel to the local area (if Bowl was main reason for travel)Average daily spending on food and beverage, shopping, entertainment and often localtransportation.Other attractions attended during stayIntentions to return to the Bowl and the cityMiscellaneous demographic informationOnce the data are collected, the total attendance number is filtered to identify non-locals whotraveled specifically for the game and total expenditures are determined. This “direct” spending isonly one component of EI. The “indirect” expenditures or domino effect of these dollars entering thelocal economy is calculated through the use of a multiplier. These well-researched multipliers takeinto consideration the industry and geographic location to determine additional spending.Consequently, total EI is the combined total of direct and indirect impact. In some cases, inducedimpact is included, which accounts for individual spending (vs. firms directly involved) that resultedin the local economy, as a result of the bowl.Page 4
ANALYSISAnalysisTo determine the combined EI of college bowl games, the previously described steps werefollowed. In essence 4 analyses were conducted stratified by matchup. Each grouping of bowl gamematch ups (i.e., New Year’s Six, Power 5 vs. Power 5, etc.), was broken out and assessed individuallyto account for differences in each category. It is reasonable to assume that New Year’s Six bowlgames would likely generate greater EI than Group of 5 games. Consequently, these groupings wereinvestigated separately.Data CollectionBoth primary and secondary data were used in this study. Those bowl games that did indeedconduct EI studies from 2014- 2015 seasons were identified and contacted. A total of 16 studieswere used to create the estimate presented in this study. Each grouping had a minimum of 4 studiesto create the category average. The average and total economic impact of each category is presentedin Table 2.CategoryNew Year’s SixPower 5 Vs. Power 5Power 5 Vs. Group of 5Group of 5 Vs. Group of 5TotalAverage EI per CategoryTotal EI 93,773,880 34,804,413 20,260,588 12,650,000Mean 40,372,220 656,417,158 487,261,775 141,824,113 164,450,000 1,449,953,046Table 2: Average and total EI per categoryThe range of bowl game EI was from a low of 12,650,00 to a high of 93,773,880 with anaverage of 40,372,220. The average taken as shown can be deceptive given the range of EI. Lookingat EI by category provides a more accurate picture of how bowl games contribute to their localeconomy.Page 5
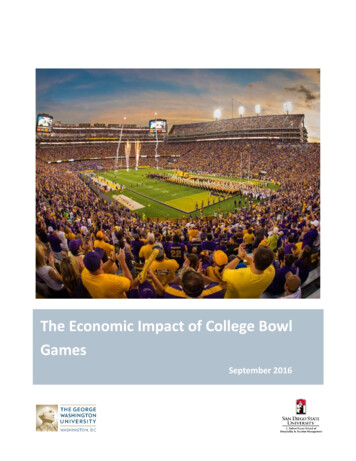
ANALYSISIn addition to assessing the average and total EI, the breakdown of spending in eachcategory was identified as shown in Table 3. Clearly, lodging and food and beverage are the greatestexpenditures at bowl games. Interestingly, the cost of a hotel seems to increase with the prestige ofthe match up with expenditures steadily increasing moving from Group of 5 Vs. Group of 5 to NewYear’s Six.CategoryNew Year’s SixPower 5 Vs. Power 5Power 5 Vs. Group of 5Group of 5 Vs. Group of 5Food 4%23%12%19%23%13%Table 3: Percent spending by categoryRetail andShopping14%22%26%19%Chart 2 provides a summary of spending in comparison with other categories. Over 70% ofspending at New Year’s Six bowls was derived from food and beverage and lodging, while only 50%for Power 5 Vs. Group of 5.100%90%80%70%60%Retail and Shopping50%Entertainment40%Lodging30%Food and Beverage20%10%0%New Year’sSixPower 5 Vs.Power 5Power 5 Vs. Group of 5 Vs.Group of 5Group of 5Chart 1: Spending by categoryPage 6
LIMITATIONSLimitationsWhile every attempt was made to ensure that an unbiased assessment wasconducted here, several limitations exist.First, in the majority of cases, the researchers had to rely on secondary datacollected by another organization for the conclusions drawn here. While the organizationsthat conducted the studies were vetted to ensure the research process was similar, andequally rigorous as the others included, it is impossible to know that every study was biasfree. During interviews with each study author, questions were posed on question type,data collection methodology, focus on non-local spending only, determination that the gamewas the primary reason for travel and the data analysis process utilized.Next some studies used here did not include full information. In two cases, onlytotals were provided rather than the complete study and a breakdown of the methodologyused. The totals in these two cases fell within an acceptable standard deviation and werethus included in the study.Lastly, one area that some studies differed on was the method used to calculateindirect spending. Some studies used the RIMS II multiplier for their particular region andcategory, while others used the IMPLAN model. There are pros and cons to using eachmethod and subsequent differences in the results. Both methods are consideredacademically rigorous. And, given the tremendous variance in geographic location used tohost these bowl games, it was determined that each organization used the best method fortheir location. That is, geographic location is a significant, uncontrollable variable in theultimate EI resulting from a bowl game. For example, the Average Daily Rate (ADR) is likelyto be much higher in San Diego than in Idaho. By using the method identified as mostappropriate by each research organization, this study accounts for those variances.Page 7
RESEARCH TEAMResearch TeamCARL WINSTONPROGRAM DIRECTORPAYNE SCHOOL OF HOPITALITY ANDTOURISM MANAGEMENTSAN DIEGO STATE UNIVERSITY5500 CAMPANILE DR.SAN DIEGO CA, 92182619-594-5254CWINSTON@MAIL.SDSU.EDUPage 8MARK R. TESTA, PH. D.PROFESSOR, COORDINATOR CENTERFOR HOSPITALITY RESEARCHPAYNE SCHOOL OF HOPITALITY ANDTOURISM MANAGEMENTSAN DIEGO STATE UNIVERSITY5500 CAMPANILE DR.SAN DIEGO CA, 92182858-349-5229MTESTA@MINDSPRING.COMLISA DELPY NEIROTTIDIRECTOR, MASTER OFTOURISM ADMINISTRATION,ASSOCIATE PROFESSORGEORGE WASHINGTONUNIVERSITY2201 G ST. NW WASHINGTON,DC 20052(202) 994-6623DELPY@GWU.EDU
Power 5 Vs. Power 5 Phoenix, AZ Las Vegas Bowl Power 5 Vs. Group of 5 Whitney, NV Heart of Dallas Bowl Power 5 Vs. Group of 5 Dallas, TX Military Bowl Power 5 Vs. Group of 5 Annapolis, MD Independence Bowl Power 5 Vs. Group of 5 Shreveport, LA Armed Forces Bowl Power 5 Vs. Group of 5 Fort Worth, TX Quick Lane Bowl Power 5 Vs. Group of 5 Detroit, MI