Transcription
PENTAHO DATAINTEGRATIONSCALING OUTLARGE DATA VOLUMEPROCESSING IN THE CLOUDOR ON PREMISEA White Paper Presented by:http://www.bayontechnologies.comOpen Source Business Intelligence ExpertsAuthor:Nicholas GoodmanPrincipal Consultant and Founderngoodman@bayontechnologiesPlease post any questions, comments on this paperto the Pentaho ForumCopyright Bayon Technologies, Inc 20091 / 20PDI Scale Out White Paper
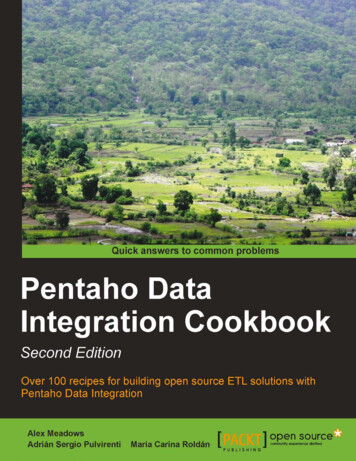
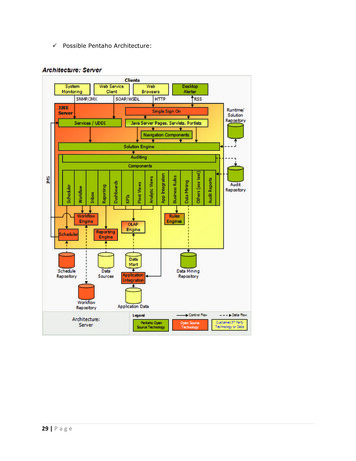
IntroductionPentaho Data Integration (PDI) 3.2 provides advanced clustering and partitioning capabilities thatallow organizations to “scale out” their Extract, Transform and Load (ETL) deployments instead of“scaling up” on expensive single node machines. Data volumes grow consistently but batchloading windows have remained the same creating challenges for any data warehouse. Scale outcapabilities in PDI can reduce this risk in addition to being exceptionally cost effective comparedto proprietary solutions. In this paper we'll review the performance of PDI scale out capabilitiesand it's ability to process billions of rows across as many as 40 nodes. This paper explores usingAmazon Elastic Compute Cloud (EC2) as an infrastructure for building PDI clusters “on demand”demonstrating some compelling price / performance metrics for doing data processing in thecloud.This paper answers the following questions:Question 1 : Does PDI scale linearly when adding additional nodes to a cluster?If it takes 4 hours to do our processing on 1 node will it take 1 hour to do it on 4 nodes? We wantto see if we can simply add additional compute nodes to our cluster to decrease our batchprocessing time. It is desirable to have this linear scalability so that we can deploy the correctnumber of nodes to meet our batch time requirements.Question 2 : Does PDI scale linearly when processing more data?If we double the size of the dataset we're processing, does PDI take twice as long to process thatdata? We want to see if a PDI cluster can handle increased amounts of data gracefully.Question 3 : What are the key price and performance metrics of ETL in the cloud?We want to see some overall performance and cost numbers from our cloud experiments. We willeventually want to compare this to a physical in house deployment scenario but for now we justwant to get some high level metrics such as “ per billion rows sorted and aggregated.”Question 4: What does someone deploying PDI on Amazon EC2 need to know?We want to develop a set of well known issues and any best practices that can be used to deployPDI clusters on the cloud. What information is helpful for these deployments?In addition to providing summarized results and analysis of these four questions, there are severalsections that explain in greater detail the specific test cases, datasets, and results fromexperiments performed on EC2. The PDI transformations and test dataset generators areavailable for download to explore the test cases and results presented here (see Appendix B –References for the download link).Pentaho Data Integration (PDI) ClustersPDI clusters are built for increasing performance and throughput of data transformations; inparticular they are built to perform classic “divide and conquer” processing of datasets in parallel.Clustering capabilities have been in PDI since version 2.4, with new features being added withevery release. The new cluster capabilities in PDI 3.2 improve the ability to dynamically createCopyright Bayon Technologies, Inc 20092 / 20PDI Scale Out White Paper
clusters of available servers, greatly reducing the amount of work necessary to manage a PDIcluster at runtime. These “dynamic cluster” capabilities make the cloud deployments we discussin this paper far more simple and straightforward to manage.PDI clusters have a strong master/slave topology. There is ONE master in cluster but there canbe many slaves. Transformations are “broken” into master/slaves at run time and deployed to allservers in a cluster. Each server in the cluster is a running application called “Carte.” Carte is asmall PDI server running a very lightweight web service interface to receive, execute, and monitortransformations.PDI clusters are not, however, intended as a “high availability” or “job management” system tohandle fault tolerance and load balancing. The PDI clustering and partitioning mechanisms arerelatively naïve at runtime; PDI clusters do not do any optimizations based on CPU/load orobserved performance of nodes in the cluster.PDI clustering is a capability in the software; it is not dependent on any particular cloud vendorsAPI/implementation. It can just as easily, and regularly is, deployed on internal dedicatedhardware.Amazon EC2EC2 allows for dynamic provisioning of compute resources such as servers, block devices, IPaddresses, etc. This infrastructure allows for companies to provision machines when they needthe compute capabilities and then release those resources when they are no longer needed. Therate for services is tied only to use and you only pay for what you use. The price of using 100machines for 1 hour is the same as using 1 machine for 100 hours.In addition to providing raw compute resources (servers), EC2 also provides a block device calledElastic Block Storage (EBS). This service acts like a Storage Area Network (SAN) for EC2 thatallows block devices to be mounted to EC2 servers and filesystems to be created and used.Since you pay for only what you use with no long term hardware commitments this can be a veryattractive model for those who need a lot of compute resources for short periods of time.Consider some of these approximate costs: 40 small servers (1.7 GB of memory with 1 virtual core) for 1 hour 4.0020 TB of block storage used for 1 hour 2.80ETL and Cloud : A Superb MatchThis profile of compute resource needs is an ideal match for nightly, weekly and monthly ETLbatch processing which typically needs a surge of compute resources during the batch window.Daily batch ETL processing usually kicks off in the middle of the night, and processes the settleddata from the previous day. The batch window is the amount of time from the beginning of theprocess (data available to process) to the time when the data processing is completed (reports areready for users). The batch window remains relatively fixed (you can start processing at 12:01am and people look at reports at 8:00am) but the volume of data for processing is growing at asignificant rates in many organizations.The attractive cloud computing costs coupled with the periodic surge of ETL compute needs makesthe cloud an ideal location for deployment.Copyright Bayon Technologies, Inc 20093 / 20PDI Scale Out White Paper
ExperimentsTest Data : TPC-HWe chose to use the TPC-H data set from the Transaction Processing Council. We chose thisdataset for the following reasons: TPC provides a data generator that allows generating different scales of data. In ourexperiments, we generated THREE datasets. Scales 50, 100, 300 (in GB). TPC-H is a relatively well known DSS dataset. Rather than invest time and effort inbuilding our test dataset we could use something that is a relatively known dataset for datawarehouse database benchmarks. It's a test dataset that is independent of these tests; readers can be guaranteed thisdataset wasn't intentionally built to perform well with these tests.Please Appendix B – References for links to TPC-H documents that contain specifics of thedatafiles we used in the experiments. These documents also include a diagram of therelationships between the files (similar to an ER diagram).The “lineitem” file is the main set of transaction records and is the largest in the TPC-H dataset.It contains information on items purchased in a retail store. There are some relatinships that willbe used in our experiments: Lineitems have a “party/supplier” dual value foreign key to the Part / Supplier data files.Suppliers have a foreign key to the country of origin.The files are “flat” files with varied data types (characters, integers, and numbers) that aredelimited by a pipe ( ). The data files used in the experiments were not modified in any way aftergeneration using the TPC provided “dbgen” program.File# of Fields Scale Size in GB# of 4ALL0.0024NOTE: This experiment is in NO WAY to be an official TPC-H benchmark. TPC-H Benchmarks havevery specific requirements for databases performing them. This experiment does none of thesethings.ETL ScenariosIn order to answer our experiment questions, we needed ETL that: Was relatively simple so readers not familiar with PDI would still be able to understand theCopyright Bayon Technologies, Inc 20094 / 20PDI Scale Out White Paper
overall ETL processing.Did some non trivial processing.Matched to a relatively common use case.Several different ETL scenarios were evaluated, and eventually two ETL transformations weretested. Some high level explanations of the transformations are presented here, along with fullscreenshots in Appendix A.READ (read lineitems lazy.ktr)READ is a baseline to see how fast the cluster can simply read the entire file. It reads records anddoes no additional processing on those records. READ ends the slave portion of the transform andthen returns some information on how this particular slave server performed.READ won't map to a real world use case; it's simply used for us to evaluate the infrastructureand get a baseline for reading large data files.READ OUTPUT FILE (out read lineitems)READ outputs some useful information about individual node performance on the server(out read lineitems). It includes the server name, the # of records processed, and the per serverthroughput.Slave# of Records Elapsed Time (s) Throughput/nodeDynamic slave [10.250.15.69:8080]3014442889433718.60Dynamic slave [10.251.199.67:8080]2991689790133204.10Dynamic slave [10.250.19.102:8080]2991712390333130.81Dynamic slave [10.250.47.5:8080]3014473990833199.05Dynamic slave [10.251.42.162:8080]2998840692032596.09Dynamic slave [10.251.71.159:8080]2991694794231758.97Dynamic slave [10.251.122.49:8080]2991568594931523.38Dynamic slave [10.250.11.95:8080]2991615895031490.69Dynamic slave [10.251.203.114:8080]29916164104428655.33Dynamic slave [10.250.137.204:8080]30229264109527606.63SORT (sort lineitems group by nationkey.ktr)Copyright Bayon Technologies, Inc 20095 / 20PDI Scale Out White Paper
SORT represents a real world need for sorting, joining, and aggregating large transaction files.SORT is similar to READ in that it reads the datafile but then it SORTs and aggregates the file tobuild a “COUNT OF LINEITEMS by SUPPLIER” total.SORT is also doing another read and sort of another large file (supplier). In this case, there is noaggregation but the data is sorted to join it with the “COUNT OF LINEITEMS by SUPPLIER” branch.SORT then does a join with another large file (supplier) using the shared “suppkey” value fromboth files. After matching the “COUNT OF LINEITEMS by SUPPLIER” to the full supplier record wesort/aggregate by nationkey.We aggregate the results (to build combined totals) on the master and output the result to adatafile on the master server.Copyright Bayon Technologies, Inc 20096 / 20PDI Scale Out White Paper
SORT OUTPUT FILE (out sort lineitems group by nationkey)The output is a summary of the number lineitems by supplier country, a simple 25 line file withone record per nation and the total # of records in the lineitem data file. For instance, for theTPC-H scale 300 file the output file looks like this:Nation KeyCount of 0722014772172056815Copyright Bayon Technologies, Inc 20097 / 20PDI Scale Out White Paper
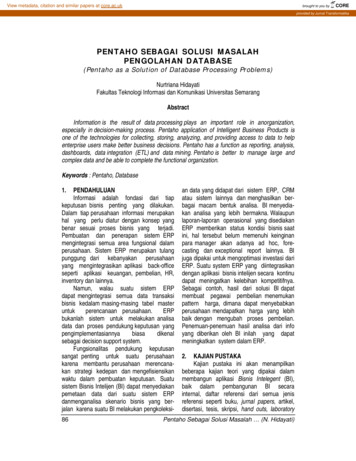
227187300523724328712471876343With each test, we verified we had the correct results in the files. This included checking rowcounts (both READ and SORT) and results (SORT).Parallel File ProcessingThe designation of Cx0 indicates that this step will be run on the cluster. By default, most stepsdon't need any additional cluster configuration. Most discreet units of work (Calculations,decodes, filtering, etc) work independently and need no special cluster configuration but inputsand outputs, if run on the cluster, need to be configured to operate on a portion of the data.The CSV Input Step has a configuration parameter “Running in Parallel?” which will instruct thestep to read only it's “segment” of the file if deployed on a cluster. This enables each node to readapproximately 1 / N part of a file.FILEN EADS100READS100READS100READS100READSThis also means that for “Running in Parallel?” all nodes need read access to the same file(lineitem.tbl) at the same location (/data) to each have the chance to process a different sectionof the file.Copyright Bayon Technologies, Inc 20098 / 20PDI Scale Out White Paper
EC2 ClusterInstance Image (AMI)EC2 provides three instance sizes: small, large, xlarge. Small is a 32 bit image, Large and XLarge are 64 bit images. In this experiment we used small instances, with the following hardwarespecifications: 1.7 GB of memory 1 EC2 Compute Unit (1 virtual core with 1 EC2 Compute Unit) 160 GB of instance storage, 32-bit platformWe built our own machine server image (AMI), based on Fedora 8. This machine image was builtusing the standard Amazon EC2 build tools. The machine was built to accept “user data” atstartup time that serves to “configure” the machine at startup. The AMI image remained static(untouched) throughout this experiment but we delivered varied slave server configuration valueswhen we started sets of servers.We passed in the following configurable parameters when we started our servers: pdi-distribution-urlThe URL of where to get PDI. The AMI downloads and dynamically installs PDI so thatupgrading versions of PDI does not require changing the AMI.Example: r10482.zip carte-slave-server-xmlThis is the XML that the AMI will start “Carte” with. For the MASTER this contains nospecializations. For the SLAVE servers, this needs to contain the hostname of the MASTERso that the SLAVE servers can register themselves with the MASTER.Example: slave config slaveserver name carte-slave /name hostname localhost /hostname network interface eth0 /network interface !-OPTIONAL -- port 8080 /port username cluster /username password cluster /password master N /master /slaveserver /slave config data-volume-deviceThe device location of the EBS block device that has been attached to this instance.Example:/dev/sdl data-volume-mount-pointThe location to mount the EBS block device.Example:/data java-memory-optionsMemory options for starting Carte-Xmx1024mThis “user data” is passed to EC2 as part of the request to start servers.EBS VolumesEBS was the mechanism which provided all nodes in the cluster the ability to read parts of samefile. EBS volumes can be attached to only one running server at a time and can range in size from1 to 1000 GB.We created a 1000 GB EBS volume and installed an XFS filesystem on it. XFS was used instead ofCopyright Bayon Technologies, Inc 20099 / 20PDI Scale Out White Paper
ext3 to enable large file ( 2.4GB) support. We generated three different scales of TPC-H dataonto this same volume so any scale could be run from mounting a single volume.Since an EBS volume can only be attached to one server at a time, we needed a way to quicklyclone and mount individual volumes to running instances. We took a snapshot of our volumeusing EBS snapshot capabilities. EBS also allows for quick creation of new volumes fromsnapshots so we can quickly create N volumes, one for each of our N nodes that has the dataseton it.ScriptsWe built scripts to help manage the life cycle of a PDI EC2 cluster. This included major functionssuch as: Creating Master and Slave Instances Creating Master and Slave Volumes from the TPC-H dataset snapshot Attaching the Volumes to Instances Status Reporting on all Instances Executing of clustered transformationsA PDI cluster of N machines was CREATED using the following process: Master Volume was created from snapshot (ec2-create-volume) N Volumes were created from snapshot (ec2-create-volume) Master Slave was started (ec2-run-instance) Once Master was running, attach volume (ec2-attach-volume) N Slaves were started (ec2-run-instance) N Volumes were attached to N slaves (ec2-attach-volume) Slaves automatically registered themselves with MasterA PDI cluster was DESTROYED using the following process: Slave Instances were terminated (ec2-terminate-instances) Slave Volumes were detached (ec2-detach-volume) Master Instance was terminate (ec2-terminate-instances) Master Volume was detached (ec2-detach-volume) Slave Volumes were deleted (ec2-delete-volume) Master Volume was deleted (ec2-delete-volume)Using the lifecycle scripts, clusters of 10, 20, and 40 machines were CREATED and DESTROYED inminutes.NOTE: The scripts include private security credentials; they are not included in thepdi scale out benchmark kit.zip.Copyright Bayon Technologies, Inc 200910 / 20PDI Scale Out White Paper
ResultsWe ran the experiments for all three scales (50, 100, 300) using three different cluster sizes (10,20, 40) for both SORT and READ. The results are summarized in the following table.Scale # of LinesNodes (N)Elapsed TimeRows / secTransform50300005811101095273978 READ5030000581120836358859 READ5030000581140640468759 READ100600037902101787335779 READ100600037902201736345644 READ100600037902401158518167 READ3001799989091106150292681 READ3001799989091205460329668 READ3001799989091403835469358 READ50300005811102588115922 SORT50300005811201389215987 SORT5030000581140704426145 SORT100600037902104615130019 SORT100600037902202680223895 SORT100600037902401318455264 SORT30017999890911015252118017 SORT3001799989091208390214540 SORT3001799989091404014448428 SORTThe full results of the experiments are included in an Excel file in the Benchmark Kit and are notpresented in their entirety here. We will examine the test results in the context of our experimentquestions.Copyright Bayon Technologies, Inc 200911 / 20PDI Scale Out White Paper
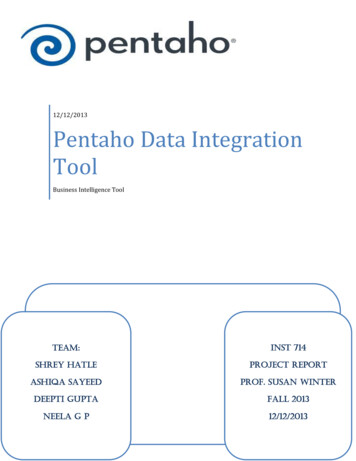
Question 1 : Does PDI scale linearly when adding additional nodes to a cluster?SORT: Elapsed 025002000150050010002505000300 / SORTElapsed Time (s)100 / SORT5000Elapsed Time (s)Elapsed Time (s)50 / 0NSORT: Throughput (rec/s)100 / SORT300 / 00300000250000200000150000100000500000Throughput (rec/s)450000Throughput (rec/s)Throughput (rec/s)50 / 40NThe results from SORT fit the assumption that adding more nodes to a cluster improvesthroughput and overall processing close to linear but not exactly.Consider the 100 / SORT across the three cluster sizes. If we start with the baseline of N 10then we can project out how long 20, and 40 should take (N 10 * 2, and N 10 * 4) to come upwith the projected pure linear scaling numbers.Copyright Bayon Technologies, Inc 200912 / 20PDI Scale Out White Paper
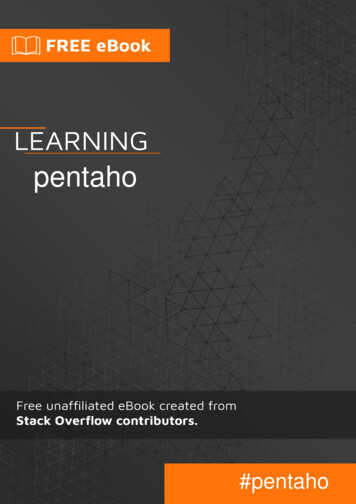
300 / SORT550000500000Throughput 00000500000102040NOur performance doesn't match our projections exactly, and does start to show some diminishingreturns on adding more nodes. Some of this is likely to be variations in cloud compute resources(discussed in Question 4 results) since we had some samples that actually BEAT their projectedperformance. For example, 300 SORT / N40 was faster than the projected N10 * 4 numberindicating that there were variations on underlying hardware conditions during the experiments.However, the data indicates there is not a direct linear relationship on adding more nodes.READ: Elapsed Time100 / READ50 / READ1100180010001600800700600500400300200Elapsed Time (s)1400Elapsed Time (s)Elapsed Time (s)900300 / 0NREAD: Throughput (rec/s)Copyright Bayon Technologies, Inc 200913 / 20PDI Scale Out White Paper
100 / READ300 / 00300000250000200000150000Throughput (rec/s)550000Throughput (rec/s)Throughput (rec/s)50 / 00005000000102040N01020N40102040NThe performance of N40 isn't even close to the projected N10 * 4. In fact, N40 never even showsmore than twice the performance of N10.On the READ transformation, there is no inter-node communication and the nodes all operateindependently on a different section of the file. There is no real processing and only a smallamount of data (a few Kb) is passed from the slaves to the master. This seems to indicate thatour underlying storage system (EBS) wasn't scaling linearly on read performance to volumesbased on the same snapshot. We did not, unfortunately, do any sort of OS level benchmarks onthe mounted volumes for raw performance on EBS outside of PDI which would have been able todetermine if this was indeed accurate.ANSWER: Our experiment was not a 100% controlled environment and we think our underlyingcloud infrastructure skewed the results. Even so, our SORT (which will throttle I/O a bit) showedclose to linear scaling and significantly improved performance when adding new nodes. PDI onEC2 scales nearly linearly, but not exactly likely due to EBS variations.Copyright Bayon Technologies, Inc 200914 / 20PDI Scale Out White Paper
Question 2 : Does PDI scale linearly when processing more data?The results for different scales and nodes have already been presented. Let's look at theperformance of SORT to see how well it scaled with the increasing scales (50, 100, 300).Elapsed Time e values for all node sizes at 100 are approximately 50 * 2. The values for all node sizes at 300are approximately 50 * 6. We observed better than linear results on some values which alsoindicate a variation in underlying compute resources/EBS performance.ANSWER: PDI scales linearly with increasing data sizes in the cluster sizes and data scales wetested.Copyright Bayon Technologies, Inc 200915 / 20PDI Scale Out White Paper
Question 3 : What are the key price and performance metrics of ETL in the cloud?Let's first arrive at some overall performance metrics for our cluster. We looked at the overallSORT performance for each node for all three scales and arrived at an average, per node SORTperformance of 11,373 records per second. This is the average sort performance on our relativelylinear scaling transformation which means we can use this figure with relative confidence atdifferent scales (data sizes) and cluster sizes (instances in cluster).NodesThroughputThroughput / .1712131.92Average SORT throughput / node11373.64Here is the loaded cost of our “small” EC2 instance:EC2 CostCost / HourServer Time 0.10EBS Volume (1000 GB) 0.14EBS Load from S3 0.01Bandwidth 0.00TOTAL 0.25How many rows can we SORT in 1 hour on one node?11373 X 60 (seconds) X 60 (minutes) 40,942,800 Sorted Rows / Hour / Small NodeWhat is the price per billion rows processed on the cloud?( 0.24 * 1000000000) / 40,942,800 5.86 compute cost to SORT a billion rows on EC2NOTE: These calculations do not take into account cluster startup time (approximately 20 minutesfor 40 node cluster) and smaller negligible bandwidth costs.Copyright Bayon Technologies, Inc 200916 / 20PDI Scale Out White Paper
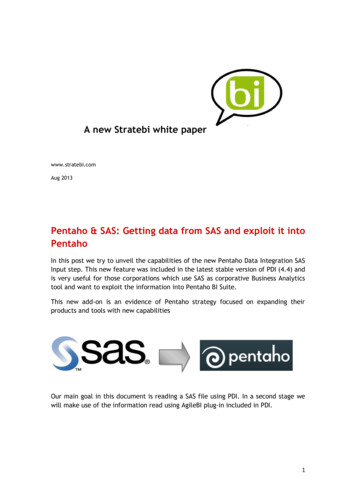
Question 4: What does someone deploying PDI on Amazon EC2 need to know?All Instances are Not Created EqualOur READ transformation produced individual node performance metrics. We observed somesignificant variations on individual node performance. It is unclear if the difference in individualperformance was the instance (cause by other virtual machines on the same physical server) orit's connection to EBS (reading the file) but we saw some nodes taking up to 58% longer thanothers even though they were processing a similar size/number of rows.100 / READ / 40 Nodes12001100Elapsed Time (s)10009008007006005004003002001000NodesMost are relatively smooth, with nodes 1-38 completing within 100 seconds of each other. Nodes39 and 40 toke significantly longer causing the overall performance of the transformation to beequal to the “slowest” node. The full test results show the averages on a per node basis ofthroughput which gives a more accurate per node performance number but is irrelevant forpractical use. PDI clusters are only as fast as their slowest node.PDI assumes a homogenous set of compute resources. It's division of file segments and allocationto nodes does not take into account any variations in performance or sizing of the machines.Systems like MapReduce / Hadoop have built in an optimizations to accommodate this andreallocates chunks of works to different servers based on load and failures. PDI has no suchcapabilities.EBS Volume PerformanceBased on our READ performance we observed EBS performance degradation with more nodesreading from a volume created from a snapshot. This is likely due to the fact that EBS behind thescenes loads the snapshot from S3 asynchronously and we were hitting blocks ahead of thembeing loaded. Each EBS volume is hitting different parts of the files and thus would be hittingdifferent EBS/S3 blocks.We should do a follow on experiment of parallel read performance from S3 directly, bypassingEBS.Private IPs vs Public IPsCopyright Bayon Technologies, Inc 200917 / 20PDI Scale Out White Paper
Amazon EC2 has two IP addresses for every machine; a private and a public. Private IP is used tocommunicate internally within Amazon EC2 networks and is believed to be the faster of the twonetworks. Public IP is used to communicate with the outside world.In our cluster startup/monitoring scripts we needed to use the Public IP to communicate with theserver but we wanted the servers to communicate with each other using their Private IPs. Inaddition to being faster, there are no bandwidth charges for using the Private IP while there is anAmazon EC2 charge for using the Public IP – even if it's within EC2 networks. This prevents usfrom running our clustered transformation directly via the PDI visual designer to the remoteservers; we created a wrapper Job and shipped it to the master and ran it from the command linethere. PDI 3.2 has the ability to export and ship the job, but it wasn't available on the commandline “kitchen.sh” when we ran these experiments.Readers should take care to setup their PDI cluster to use private IP addresses for inter nodecommunication to save money and maximize network performance.Copyright Bayon Technologies, Inc 200918 / 20PDI Scale Out White Paper
Appendix A – Test Transformationssort lineitems group by nationkey.ktr is available in pdi scale out benchmark kit.zipread lineitems lazy.ktr is available in pdi scale out benchmark kit.zipCopyright Bayon Technologies, Inc 200919 / 20PDI Scale Out White Paper
Appendix B – References Benchmark Kithttp://www.bayontechnologies.com/bt/ourwork/pdi scale out benchmark -H Data generatorhttp://www.tpc.org/tpch/spec/tpch 2 8 0.tar.gzTPC-H Amazon com/ebs/PDIhttp://kettle.pentaho.org/Dynamic c clustersCopyright Bayon Technologies, Inc 200920 / 20PDI Scale Out White Paper
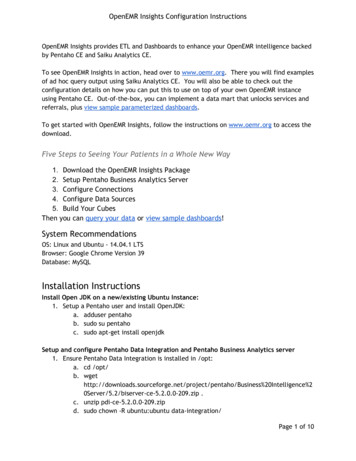
Pentaho Data Integration (PDI) Clusters PDI clusters are built for increasing performance and throughput of data transformations; in particular they are built to perform classic "divide and conquer" processing of datasets in parallel. Clustering capabilities have been in PDI since version 2.4, with new features being added with every release.