Transcription
F I NAN CI AL A IDR EPO RTFISCAL YEAR 2021
This page intentionally left blank
ABOUT THIS REPORTThe Arizona Board of Regents fiscal year 2021 Financial Aid Report, filed in compliance with A.R.S.§15-1650, provides detailed information on financial aid trends at Arizona’s public universities. Thisreport is an important tool for the board as it continues to address higher education access andaffordability issues. Data was obtained from Arizona’s public universities – Arizona State University,Northern Arizona University and the University of Arizona. Supplementary information is from theU.S. Department of Education, U.S. Census Bureau 2019 Community Survey and the IntegratedPostsecondary Education Data System (IPEDS). All years referenced in this report are fiscal years,unless otherwise indicated.ABOUT THE ARIZONA BOARD OF REGENTSThe Arizona Board of Regents is committed to ensuring access for qualified residents of Arizona toundergraduate and graduate institutions; promoting the discovery, application, and dissemination ofknowledge; extending the benefits of university activities to Arizona’s citizens outside the university;and maximizing the benefits derived from the state’s investment in education.MEMBERSLyndel Manson, ChairFred DuVal, Chair ElectCecilia Mata, SecretaryLarry E. Penley, TreasurerRobert J. HerboldJessica PachecoBill RidenourRon ShoopmanNikhil Dave, Student RegentRachel Kanyur, Student RegentGov. Doug Ducey, Ex-OfficioSuperintendent Kathy Hoffman, Ex-OfficioABOR EXECUTIVE DIRECTORJohn ArnoldNovember 18, 2021TA B L E O F C O N T E N T S1 Executive Summary2 Arizona Public University Enterprise Fast Facts1 5 Arizona State University3 1 Northern Arizona University4 7 University of Arizona
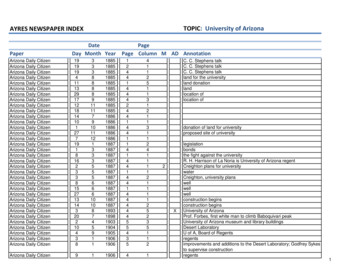
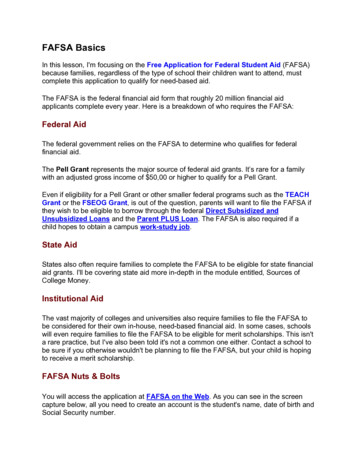
Arizona University Enterprise ‐ Fast FactsEXECUTIVE SUMMARYTuition and Mandatory Fees(in thousands) 11.3 ASU Debt upon graduation for students in Arizona with financial aid loans remains lowcompared to other public universities.2 Concerted efforts by the board and theuniversities have led to real savings for students and increased tuition predictabilityand transparency.Only 11 states in the union have lower rates of student loan debt than Arizona. Universitygraduates are also more likely to be employed and have stronger earning power fiveyears after graduation – even after accounting for student loan repayments.3Additional key findings from the 2021 Financial Aid Report include: Since 2017, systemwide financial aid from all sources has increased 21 percent from 2.6billion to 3.1 billion, outpacing enrollment growth of 19 percent over the same period.The number of Pell-Grant eligible students attending Arizona’s public universitiescontinues to rise with enrollment growth, while the percentage of the national studentpopulation that is Pell eligible has declined as the number of students entering highereducation has decreased.4Average need awards for undergraduates remained consistent in 2021. Since 2017, theseare up 11 percent.Direct Cost of Attendance(in thousands) 26.0Financial aid remains essential for students at Arizona’s public universities. The primary goalof financial aid programs is to ensure a university education at Arizona’s public universitiesremains financially accessible to all academically eligible Arizona students. Several indicatorssuggest the public universities are meeting this objective in 2021:While more students are relying on financial aid, default rates for students at Arizona’spublic universities are below the national average and remain the lowest among allArizona higher education institutions.1Average Tuition & M.F.Payment (in thousands) 11.9NAUNet Cost of Attendance(in thousands) 26.8 23.7 16.5 14.2 12.7UArizona 3.9 2.2ASUNAU 11.2 4.8UArizonaASUNAUUArizonaASUNAUUArizona 107 1,038Institutional Gift Aid (in millions)2021 5852020 563201920182017 346 310 501 257 443 223 405NeedAverage Financial Aid Awards for Resident UndergraduatesNeed Gift Aid: 11,010Need Self Help: 4,272Need Loans: 4,018Merit Gift Aid*: 7,195Average Aid Package: 14,487 99Non‐Need 106 102 204 107 981 864 767 707GraduatePercent of Undergraduates Receiving Financial Aid**81%80%20192020202174%75%76%20172018Loan Default Rates for Undergraduate Borrowers (2018 Cohort) Forty-five percent of ASU, 45 percent of NAU and 53 percent of UArizona undergraduatestudents graduate with no debt.In 2021, Arizona’s public universities collectively provided 1,037.8 million in institutionalgift aid. Since 2017, total institutional gift aid has increased 330.3 million or 47 percent.Additional data is available at azregents.edu.U.S. Department of Education (2019). Official Cohort Default Rates for Schools. Available: t/cdr.html2Lendedu (2019). Average Student Loan Debt Statistics by School by State 2019. Available: state-2019/3Carnevale, A. P., Cheah, B., Hanson, A. R., (2015) The Economic Value of College Majors, Washington, D.C: Georgetown University Centre onEducation and the Workforce. Available: -Summary-web-B.pdf Taylor, P., Fry, R., Oates, R.(2014).4College Board (2020). Pell grants: recipients, maximum Pell and average Pell. Available: ell-and-average-pell11 FINANCIAL AID ional:7.3%Average Debt Per Degree Recipient for Undergraduate BorrowersASU: 24,646NAU: 21,508UArizona: 25,590National: 29,927*Merit Gift Aid and Waivers, Excluding QTR and Athletic WaiversAverage Percent of Need Students with need who were awarded any aid and undergraduate students without need awarded non‐need institutional gift aid, excluding QTR and AthleticsFINANCIAL AID REPORT 2
ADDRESSING COST AT ARIZONA’S PUBLIC UNIVERSITIESIn 2021, 199,444 students attending Arizona’s public universities received some sort offinancial aid. In total, more than 3.1 billion in financial aid was provided to students.The total cost of university attendance – including tuition and fees, room and board, and books– rose significantly from 2010 to 2012 in response to sharp declines in state funds. Since then,Arizona’s public universities have redesigned their financial models to slow the rate of tuitionincreases and improve cost competitiveness. In 2021, the average direct cost of attendance forresident undergraduate students was 25,500, which amounts to a 300 or 1.2 percent increasefrom the prior year. These increases were primarily a result of general inflation and risinghousing costs, as tuition and fees have increased at a modest rate since 2012.Each year, the universities report the direct cost of attendance to the board. Direct costof attendance is calculated by taking the total costs of attendance, which is published oneach of the universities’ websites, and subtracting travel costs, miscellaneous fees andpersonal expenses from the total cost. Charts and graphs contained in each of the universitysections of this report are calculated using the direct cost of attendance. Included below forreference purposes is the average on-campus total cost of attendance for resident studentsat each university.Average On-Campus Undergraduate Student Budget for Arizona Residents FY 2021CostsTuitionBooks and SuppliesRoom and BoardOther (Travel, Misc. Fees, Personal, Etc.)Total Cost of AttendanceThe board and Arizona’s public universities have added several lower-cost pathways to adegree, including more community college partnerships, expanded online education andadditional affordable degree programs. Nonetheless, financial aid remains the primary meansby which the universities achieve their mission of providing high quality, affordable education.Arizona University EnterpriseExhibit FA.AUE.1: Undergraduate Tuition by ResidencyAverage Enterprise Resident Undergraduate Tuition(in thousands) 24.3 23.0 23.6 9.5ASU TempeNAU FlagstaffUA Tucson 11,338 11,896 12,711 1,300 1,000 800 13,510 10,534 13,050 3,358 4,720 3,500 29,506 28,150 30,061Average Enterprise Non‐Resident Undergraduate Tuition(in thousands) 9.7 25.5 27.1 28.5 29.3 30.9 30.9 30.9 12.0 12.0 11.1 11.4 11.6 10.0 10.4 10.72012 2013 2014 2015 2016 2017 2018 2019 2020 20212012 2013 2014 2015 2016 2017 2018 2019 2020 2021Average On-Campus Graduate Student Budget for Arizona Residents FY 2021CostsTuitionBooks and SuppliesRoom and BoardOther (Travel, Misc. Fees, Personal, Etc.)Total Cost of Attendance3 FINANCIAL AID REPORTASU TempeNAU FlagstaffUA Tucson 12,608 11,726 11,061 1,054 1,000 1,200 11,808 10,534 12,250 6,808 4,720 7,900 32,278 27,980 32,411FINANCIAL AID REPORT 4
FINANCIAL AIDARIZONA PUBLIC UNIVERSITIES’ EDUCATION FINANCING MODELArizona University EnterpriseThe total cost of attendance is determined by:Exhibit FA.AUE.2: Need Aid Awards by Residency Expected family contribution: Families are expected to contribute based on theiravailable resources as defined by a federal formula that considers parental incomeand assets, family size, number of family members in college and other factors.Families with limited means are not expected to contribute. Grants from federal and state programs: Students are expected to apply for allapplicable federal and state grant programs to help cover the cost of attendance. A reasonable student contribution from work and borrowing: Students are expectedto contribute toward the cost of their education through manageable levels of work and/or borrowing. University financial aid needed: Once the above items are taken into consideration, astudent’s financial need is determined and their eligibility for all forms of financial aidis assessed. Based upon this assessment, a financial aid award package is created thatconsiders the student’s qualifications for scholarship awards and eligibility for grants.Providing access to education for students across the socio-economic spectrum is vital toArizona’s economic future. As the demographics of Arizona’s college-going populationshift, more students require financial aid to make ends meet. Research shows that studentswho are overburdened financially are significantly less likely to persist through graduation.5Financial aid awards are therefore imperative to the universities enterprise goals for studentsuccess and raising educational attainment.Average Resident Undergraduate Need Gift Aid(in thousands) 9.4 10.1 10.5Average Non‐Resident Undergraduate Need Gift Aid(in thousands) 11.0 11.3Number of Resident Undergraduates Awarded Need GiftAid (in thousands)41.242.743.144.7Total Resident Undergraduate Need Gift Aid(in millions) 387.3 453.4Financial aid determinations should acknowledge the total cost of attendance, includingresident student fees, living expenses, books and supplies, transportation and health care. Financing an education at an Arizona public university is a shared endeavor betweenstudents, families, federal and state governments, and the universities.Gift aid from institutional and other sources significantly reduces the cost of obtaining adegree for the vast majority of students. In 2021, financial aid awards from all sources(institutional, federal, state and philanthropy) reduced the cost of attendance for Arizonaresident undergraduates by an average of 45.6 percent at ASU; 52.7 percent at NAU; and38.6 percent at UArizona.Nguyen, T.D., Kramer, J.W., & Evans, B. J. (2018). The Effects of Grant Aid on Student Persistence and Degree Attainment: A Systematic Review andMeta-Analysis of the Causal Evidence (CEPA Working Paper No.18-04). Retrieved from Stanford Center for Education Policy Analysis: http://cepa.stanford.edu/wp18-0455 FINANCIAL AID REPORT201720182019 10.6 10.9 10.743.315.8 430.7 10.3Number of Non‐Resident Undergraduates AwardedNeed Gift Aid (in thousands)16.217.419.520.4Total Non‐Resident Undergraduate Need Gift Aid(in millions) 492.5 491.1AWARDING AID GOVERNED BY PRINCIPLES 10.120202021 160.1 167.8 184.2201720182019 213.6 217.620202021THREE CATEGORIES OF FINANCIAL AIDArizona’s public universities classify financial aid according to the basis on which the aid isawarded. There are three categories of financial aid - need, merit (or non-need-based) andneed/merit.Need-based aid, administered by the universities, considers the student’s total cost ofattendance, the expected family contribution and other factors when determining a student’sfinanical aid award.FINANCIAL AID REPORT 6
In 2021, 817 million in need-based gift aid awards were provided to 83,562 students –51.1 percent of all degree seeking students enrolled in Arizona’s public universities. Ofthis amount, 491.1 million was provided to 43,309 resident students. Since 2017, fundingprovided to resident students for need-based gift aid has increased by 103.8 million or 26.8percent. The average amount of need-based gift aid awarded per student has decreased 1.7percent from 9,949 to 9,777.The majority of federal gift aid is administered through the Pell Grant program, whichprovides grants to undergraduate students with financial need to help pay the costs ofattending postsecondary institutions. Pell Grants are the first financial aid awarded beforeeligibility for other federal student-aid programs is determined. Pell Grant amounts aredetermined by educational costs and the family’s ability to contribute. In 2020-21 themaximum Pell Grant award was 6,345.Despite increases in the total amount of need-based aid and a decrease in the average awardamount, the average percentage of need met for resident students has remained relativelyflat. Rising costs of attendance eroded the proportion of need met, despite more financialaid dollars awarded. The average amount of financial need that is met for an average residentstudent is 65 percent. By comparison, the amount of financial need met for an average nonresident student is 52 percent.The total number of Pell-eligible students attending Arizona’s public universities continuesto rise. In 2021, there were 55,885 Pell-eligible undergraduate students enrolled in Arizona’spublic universities, a 18 percent increase since 2017. The federal Pell Grant program provided 272.9 million or 73.9 percent of all federal gift aid in 2021.Merit or non-need based aid includes scholarships, grants and gifts that are awarded solelyon the basis of academic achievement or other demonstrated merit. These awards providecompetitive levels of support to attract and retain highly talented students. In 2021, 40,373merit-based awards were dispersed totaling 307.2 million. Of this amount, 20,221 awardswere provided to resident students totaling 139.3 million.Need/merit-based aid is awarded to students with demonstrated need and merit.These awards provide meritorious students with limited means opportunities to pursuea public university education in Arizona. In 2021, 62,849 awards were distributed totaling 328 million.TYPES OF FINANCIAL AIDThere are two types of financial aid – gift and self-help aid. Gift aid, often referred to asscholarships or grants, does not need to be paid back. In 2021, gift aid was awarded to199,444 Arizona public university enterprise students. Since 2017, gift aid has increasedby 480.4 million or 39.8 percent.Self-help aid is generally comprised of federal work-study and student loans fromgovernments, banks or other lending institutions. In 2021, self-help aid was available to105,573 enterprise students. Self-help aid has increased by 66.3 million or 6.5 percentsince 2017.Federally funded self-help aid totaled 870 million in 2021. Of this total, federal studentloans accounted for 856.1 million and were offered to 85,025 enterprise students. Since2017, the amount of federal student loans awarded increased by 42.9 million or 5.3 percentand the number of students borrowing through federal student loan programs decreased by878 or 1 percent.In addition to federal student loans, 13.9 million in federally funded self-help aid wasprovided in 2021 through federal work-study, which offers federally subsidized part-time jobsto help students pay for part of their college costs. In total, 3,561 enterprise students in 2021received financial aid through federal work-study.Institutional Financial AidIn 2021, Arizona’s public universities collectively provided 1,037.8 million in institutionalgift aid to 140,363 students. Institutional aid is the second largest source of financial aidfor enterprise students. This category of aid encompasses grants and scholarships thatuniversities offer prospective students and may include academic scholarships, leadershipgrants, achievement grants, art and music scholarships, special talent grants, athletic grantsand need-based grants.Since 2017, total institutional gift aid has increased significantly by 330.3 million or 46.7percent. The number of students receiving institutional gift aid increased by 36,585 or 35.3percent – significantly outpacing enrollment growth. This dramatic increase represents a shiftfrom a low financial-aid model to a high financial-aid model. Under this new model, growth ininstitutional gift aid has dramatically exceeded growth in federal student loans.SOURCES OF FINANCIAL AIDFinancial aid for students at Arizona’s public universities comes from a variety of sourcesincluding the federal government, the universities, private entities and state government.Federal Financial AidThe federal government is the primary source of both gift and self-help financial aid. In2021, federally funded gift aid totaled 369.4 million and was provided to 71,249 students.Federally funded gift aid has increased by 99 million – 36.6 percent since 2017.7 FINANCIAL AID REPORTFINANCIAL AID REPORT 8
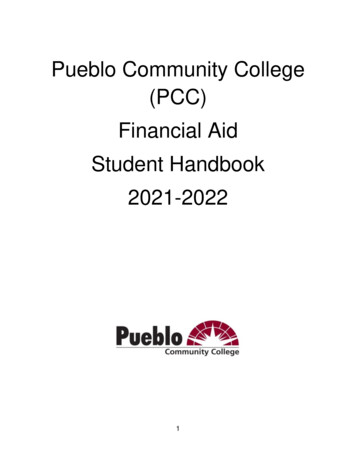
Arizona University EnterpriseExhibit FA.AUE.3: Financial Aid AwardsFinancial Aid Awards by Source and Type (in billions) 2.6 2.9 2.7 3.1 ivate and ExternalState and AFATFederalInstitutionalLoansExhibit FA.AUE.4: Pell and Institutional Gift AidTotal Pell Grants Awarded by Institution (in millions)Regents Set-AsideThe Regents Set-Aside is a percentage of board-designated tuition revenue retained or“set aside” at each university for awards to students with demonstrated financial need.Current board policy stipulates the Regents Set-Aside amount for each university at 14percent of the resident tuition for the academic year multiplied by the resident amount oftuition paid in full by resident and non-resident students at a minimum. 205.1 45.9 40.6 118.6 266.9 272.9 51.8 51.9 41.6 39.0 155.5 173.5 834.838.241.643.3 249.5 233.6 50.7 49.1 43.3 43.2 141.3Total Pell Grant Awards by Institution (in thousands)Regents Set-Aside awards are considered gift aid and the universities award these fundsto students with demonstrated financial need as part of their financial-aid award package.Priority is given to undergraduate Arizona resident students. In 2021, the universitiesawarded 266.6 million in Regents Set-Aside funds to students.Since 2017, the Regents Set-Aside for residents has increased by 38 million or 16.6 percent.The number of recipients has increased by 4,759 or 11.9 percent. In 2022, the Regents SetAside for residents is projected to grow by 4.9 million or 2.9 percent and by 1,517 recipientsor 3.4 percent.Private Financial AidIn recent years, financial aid awards from private or external sources have also increased.Since 2017, private or external gift aid has risen from 208.2 million to 237 million, anincrease of 13.8 percent. In 2021, gift aid from private or external sources was awarded to38,276 enterprise students – an increase of 8,874 students in the past five years.Private loans totaling 339.6 million were provided to 19,879 students in 2021. Private loanshave decreased 13.5 million or 3.8 percent since 2017 with 1,133 less students borrowing.52.511.010.431.1Total Institutional Gift Aid Awarded by Institution (in millions) 707.5 196.6 863.8 767.3 227.4 206.7 150.2 267.2 1037.8 278.8 165.3 168.7 117.4 132.3 393.5 428.2 486.1 548.7 590.320172018201920202021ASU9 FINANCIAL AID REPORT 981.2NAUUArizonaFINANCIAL AID REPORT 10
SELECTED STATUTORY GIFT-AID PROGRAMSArizona Financial Aid Trust FundThe Arizona Board of Regents, in partnership with the ArizonaStudents’ Association and the Arizona State Legislature, createdthe Arizona Financial Aid Trust Fund (AFAT) program in 1989. AFATprovides state-based financial aid to university students whosecircumstances clearly warrant financial assistance. Since 1990,AFAT has been funded by a fee charged to students.The AFAT fee was approved by student referenda at the threepublic universities.AFAT awards comprise less than one percent of all financial aidawarded to students at Arizona’s public universities. In 2021, theAFAT program awarded 28.3 million to students, an increase of 8million since 2017.WaiversArizona’s public universities support students who are statutorilyeligible for the following tuition waiver categories: Children and spouses of peace officers, firefighters, paramedics,military service personnel, correctional officers, and ArizonaNational Guard members killed in the line of duty as defined inA.R.S. §15-1808(D)(4). Qualifying members of the Arizona National Guard, includingPurple Heart recipients, as specified by A.R.S. §15-1808. Arizona military service personnel who received a Purple Heartcitation as specified by A.R.S. §15-1808. Non-resident tuition waiver scholarships for students fromSonora, Mexico, as authorized by A.R.S. §15-1626. Students in the foster care system at the age of 14, asauthorized by A.R.S. §15-1809.The amount of institutional funding awarded to support the waiversfor fiscal year 2021 was 1,170,829.The number of statutory waiver scholarships awarded by eachuniversity are included in university sections of this report.In addition , the universities receive state support to provide ArizonaTeachers Academy Scholarships (A.R.S 15-1655) and AZ PromiseAwards (A.R.S. 15-1701)11 FINANCIAL AID REPORT
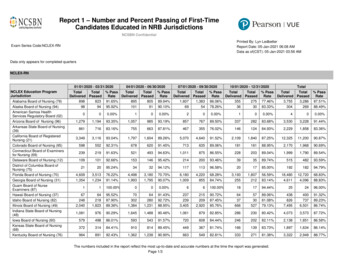
Arizona University EnterpriseSTUDENT DEBT AT ARIZONA’S PUBLIC UNIVERSITIESLevels of student debt at Arizona’s public universities remain below the national average.Over the past five years, student debt levels have remained essentially flat, after accountingfor inflation. From 2017 to 2021 the number of students taking out new loans grew from106,947 to 104,937, a 1.9 percent decrease.Student debt is a significant concern in Arizona, as it is nationally. However, Arizonacontinues to rank among the lowest debt states. In 2021, 45 percent of undergraduates fromASU, 45 percent from NAU and 53 percent from UArizona graduated with no debt. Amongthose who took on debt to finance their education, the average debt load at graduation was 24,447 at ASU; 21,461 at NAU; and 25,343 at UArizona. In all cases, students’ debt wasbelow the national average of 28,950 in 2019. Debt levels at Arizona’s public universitiesalso compare favorably with national averages for all very high research and high researchpublic universities.In real dollars, student debt levels have declined. The Bureau of Labor Statistics ConsumerPrice Index reports inflation of 12.7 percent between fiscal years 2017 and 2021.Exhibit FA.AUE.5: Worst Student Loan Default Rates by State and Arizona State Public Universities, Fiscal Year WyomingSTUDENT DEFAULT RATESStudent loan default rates at Arizona’s public universities compare favorably with nationaltrends. According to the most recent data from the federal government, 7.3 percent ofstudent-loan borrowers who entered repayment in 2018 are defaulting on student-loanpayments. Default rates at Arizona’s public universities are as follows: Arizona State University: 4.5 percentNorthern Arizona University: 4.6 percentUniversity of Arizona: 5.4 percentNationally, individuals who borrowed in order to fund a private college education defaultedthe least (5 percent), followed by public college borrowers (7 percent) and for-profit collegeborrowers (10 percent).While the public universities are performing well, the picture in Arizona at large is notencouraging. A report by the U.S. Department of Education on the national student defaultrate for 2018 finds that Arizona has one of the highest loan default rates at 8.1 percent owingto high default rates among students at for-profit and two-year public colleges. For the 2018loan repayment cohort, default rates for Arizona’s community colleges ranged between 4.9and 16.3 percent.CONCLUSIONThe Arizona Board of Regents and Arizona’s public universities make concerted efforts toensure a university education is available to all qualified Arizona residents. Financial aid is acritical component in maintaining affordability for students.9.7%Mississippi11.3%Louisiana11.5%Exhibit FA.AUE.6: Lowest Student Loan Debt by State and Arizona State Public Universities, Class of 2019, UndergraduatesUtahNAU Residents* 17,935 19,758New Mexico 20,991ASU Residents* 21,089Nevada 21,254California 21,485UArizona Residents* 23,331Wyoming 23,444Hawaii 23,577Florida 24,629Washington 24,645Arizona 24,712Louisiana 25,512*Resident undergraduate students attending either Arizona State University, Northern Arizona University or University of Arizona.Student Loan Debt Statistics . Retrieved November 1, 2021, from debt‐statistics‐updated‐march‐2021/.13 FINANCIAL AID REPORTFINANCIAL AID REPORT 14
Arizona State University ‐ Fast FactsFINANCIAL AID AT ARIZONA STATE UNIVERSITYIn 2021, ASU students received 1.9 billion in financial aid – a 28.1 percent increasesince 2017.In 2021, 129,453 undergraduate and graduate students received some form of financial aid.In the past five years, the number of aid recipients has increased by 34,724 students or 36.7percent. During the same period, ASU enrollment increased by 31.2 percent from 98,146students in 2017 to 128,788 students in 2021.ASU awarded 551.5 million in need-based financial gift aid in 2021, of which Arizonaresidents received 315.7 million or 57.2 percent of the gift aid awarded. Since 2017 needbased gift aid increased by 171.8 million and the total number of recipients increased by15,204 or 35.9 percent.ASU met 63.8 percent of all resident students’ financial aid needs and 53.2 percent of allstudents’ needs. Since 2017, need-based awards to resident students have increased by33.6 percent. Need-based awards to non-resident students have increased 64.4 percent.Over the same period, total spending on non-need based awards increased by 80.2 percentand the number of awardees increased by 92.5 percent. The average non-need-based awardto resident undergraduates was 6,949. The average non-need based award to non-residentswas 9,876.In 2021, average tuition and fees at ASU for resident undergraduates totaled 11,338, with adirect cost of attendance of 26,019. After gift aid, the average resident undergraduate paid 3,866 in tuition and fees with a net total cost of attendance of 14,160. This amounts to anaverage reduction of 65.9 percent.Tuition and Mandatory Fees(in thousands)Average Tuition & M.F.Payment (in thousands)Net Cost of Attendance(in thousands) 25.7 26.0 23.1 23.1 24.6 12.8 12.0 13.2 14.1 14.2 10.6 10.8 10.8 11.3 11.3 4.0 3.82017 2018 2019 2020 2021 3.8 3.8 3.92017 2018 2019 2020 20212017 2018 2019 2020 20212017 2018 2019 2020 2021Institutional Gift Aid (in millions)202120202017 47 106 240NeedNon‐Need 549 428 48 117 264 590 486 47 141 2982018 44 173 3322019 44 188 358 393GraduateAverage Awards for Resident Undergraduates 11,890 4,483 4,303 6,949 14,516Need Gift Aid:Need Self Help:Need Loans:Merit Gift Aid and Waivers, Excluding QTR and Athletic Waivers:Average Aid Package:Percent of Undergraduates withLoans at GraduationPercent of Graduates with Loans atGraduationPercent of Undergraduates ReceivingFinancial 202120172018201920202021Average Undergraduate Debt atGraduation (in thousands)Average Graduate Debt at Graduation(in thousands) 47.215 FINANCIAL AID REPORTDirect Cost of Attendance(in thousands) 24.2 24.6 24.9 24.6 24.4201720182019202020212017 49.12018 50.82019 51.2202076%78%79%85%82%20172018201920202021Average Percent of Need Met ts with need who were awarded any aid and undergraduate students without need awarded non‐need institutional gift aid, excluding QTR and Athletics
Arizona State UniversityArizona State UniversityExhibit FA.ASU.1: FY 2021 Payment Sources for Tuition and Mandatory Fees by Income for Resident Undergraduates (in thousands)Exhibit FA.ASU.2: FY 2021 Direct Cost of Attendance and Average Gift Aid by Family Income for Resident Undergraduate DegreeRecipients (in thousands)Institutional Gift AidFederal Gift AidPrivate and External Gift AidStudent PaymentTuitionDirect Cost of Attendance 26.0 0.6 1.0 0.8 0.9State Gift Aid 26.0 26.0Net Cost of Attendance 26.0 26.0 26.0 26.0 0.7 0.6 11.3 14.9 1.1 5.8 6.5 3.0 0.9 0.5 4.6 0.9 0.6 2.7 1.2 6.6 6.2 5.4 6.1 5.7 4.2 4.6 0.8 0.5 0.5 9.0 5.7 0.4 0.5 5.8 5.5Average Institutional Gift Aid‐ 2.5 20 20 ‐ 34.9 35 ‐ 49.97.1 120 50 ‐ 64.94.1 20 ‐ 34.9State Gift Aid Recipients(in thousands) 80 ‐ 119.90.04.77.5Average Student Payment(in thousands)0.60.3 5.71.20.5 4.60.70.4 50 ‐ 64.90.40.5 203.4Private and External Gift AidRecipients (in thousands)0.4 20 ‐ 34.92.06.3 65 ‐ 79.9 35 ‐ 49.90.84.58.00.91.92.517 FINANCIAL AID REPORT 4.2 3.0 1.10.60.71.2‐ 1.2‐ 2.3‐ 2.2 8.0 80 ‐ 119 120 14.5 11.1 9.1 9.3 9.2 8.3 7.4 7.2 7.6 20 20 ‐ 34 35 ‐ 49 50 ‐ 64 65 ‐ 79 80 ‐ 119 12020170.4
The Arizona Board of Regents fiscal year 2021 Financial Aid Report, filed in compliance with A.R.S. §15-1650, provides detailed information on financial aid trends at Arizona's public universities. This . of financial aid programs is to ensure a university education at Arizona's public universities