Transcription
Modern Applied Science; Vol. 13, No. 1; 2019ISSN 1913-1844 E-ISSN 1913-1852Published by Canadian Center of Science and EducationStudy on the Topic Mining and Dynamic Visualization in View ofLDA ModelTing Xie1, Ping Qin1,2 & Libo Zhu11Economics and Management, Nanjing University of Aeronautics & Astronautics, 210000, Nanjing, China2Evaluation Center for Think Tank of Industry and Information Technology, ChinaCorrespondence: Jiangjun Rd. Campus: 29 Jiangjun Ave., Nanjing, 211100, Nanjing. Tel: 1-515-067-6279. E-mail:chilli6279@163.comReceived: October 19, 2018doi:10.5539/mas.v13n1p204Accepted: November 1, 2018Online Published: December 31, 2018URL: https://doi.org/10.5539/ mas.v13n1p204The research is financed by the basic scientific research business fee of the central university, This research is oneof the research results of the project "Research on Performance Evaluation and Application of University ThinkTanks Based on Deep Learning" (No. NK2018009).AbstractText topic mining and visualization are the basis for clustering the topics, distinguishing front topics and hottopics. This paper constructs the LDA topic model based on Python language and researches topic mining,clustering and dynamic visualization,taking the metrology of Library and information science in 2017 as anexample. In this model,parameter and parameter are estimated by Gibbs sampling,and the best topic numberwas determined by coherence scores. The topic mining based on the LDA model can well simulate the semanticinformation of the large corpus,and make the corpus not limited to the key words. The bubble bar graph of thetopic-words can present the many-to-many dynamic relationships between the topic and words.Keywords: dynamic visualization, LDA model, metrology, Python, topics mining1. IntroductionText content mining and semantic modeling are the research hotspots and core content in the field of informationrecommendation and data mining [1]. Mining text themes is a key and basic work in the field of text mining.Through text mining, the text is reduced from word space to topic space. Under the current network environment,information content has dynamic interaction and evolution with time. Therefore, it is of great significance toinnovate information mining methods and visualize the dynamics of information. This article will conduct LDAmodeling through Python, implement topic mining in depth at the abstract level, and dynamically visualize itthrough Python's pyLDAvis package and jupyter.2. Related Research StatusIn 2013, Shi Qiankun studied text topic mining and text static visualization analysis based on LDA model[2]. In2014, Hu Jiming and other LDA models for dynamic text content mining explored the evolution of content topicsover time from the perspective of topic similarity and intensity[1];Jing Chen et al. The 1990-2014 literature includedin the WOS database The data is the research object, using Cite Space for data visualization analysis, showing thepower distribution and journal distribution of topic mining research, and analyzing the key academic literaturesupporting the topic mining[3]. In 2015,Liu Jinhua used the word frequency statistics and keyword clusteringmethod based on co-occurrence relationship to construct the map, and visualized the clustering results through thevisualization tool VOSviewer[4]; Wang Peng et al. based on the LDA model, estimated the text theme throughGibbs algorithm. Probability distribution, using JS (Jensen-Shannon) distance as the similarity measure of text,using hierarchical clustering method for clustering. The validity of the method is proved by clustering purity andFscore value[5]. In 2016, Wang Yufen and others used a method based on the quantitative analysis of the recall rate,the precision rate, the F value and the information entropy, and the qualitative analysis of the breadth of the subjectmatter extraction and the subjective granularity. The LDA theme extraction effect is better than the keyword andabstract as the corpus LDA theme extraction effect[6]; Yang Chao et al. based on the patent-structured SAO(subject-action-object (SAO) structure LDA model to achieve the patent subject structure Identification and204
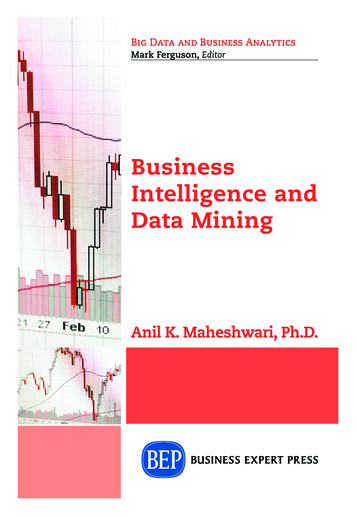
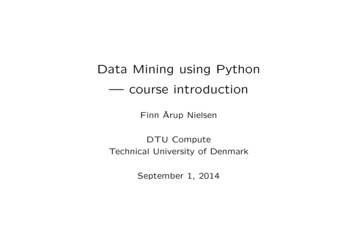
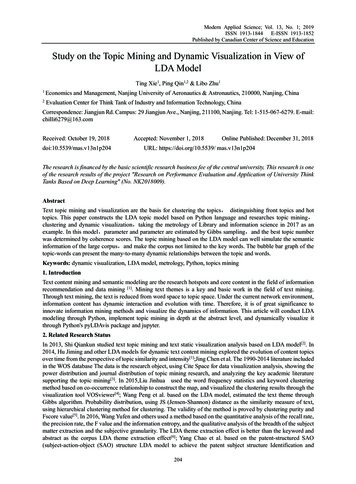
mas.ccsenet.orgModern Applied ScienceVol. 13, No. 1; 2019analysis[7]. The 2017 LDA theme model is widely used in topic recognition, topic clustering, and topic mining,trend analysis, and correlation analysis.In summary, the commonly used topic mining and visualization research tools are CiteSpace and VOSviewer. Therelated papers based on LDA model research mainly focus on topic mining and topic clustering of text data in acertain field. The visualization is mainly document- Static rendering of two matrices of topics, topics, andvocabularies, dynamic visualization analysis has not been covered. This article will use the LDA model to modelthe topic mining and dynamic visualization of the 2017 library information field through Python modeling.3. Title Page Subject Recognition Based on LDA Model3.1 Basic Principles of the LDA ModelIn 2003, Blei et al. proposed the latent Dirichlet Allocation model, which is a three-layer Bayesian probabilitygeneration model, which uses iterative estimation to calculate the subject vocabulary of the document[8]. The mainidea is to assume that each document is a mixture of multiple topics, and each topic is a probability distributionover multiple vocabularies. There are D-documents and W-vocabulary in the corpus. Assuming that the documentshave a K-topic, the process of generating the LDA model theme is:(1) For each document dϵD, according to the Dirichlet distribution θ Dir(α), the subject distribution parametersof the document d are obtained;(2) For each topic zϵK, according to the Dirichlet distribution φ Dir(β),the multi-distribution of the vocabularyon the subject z is obtained;(3) For the i-th vocabulary in document D, the subject is obtained according to the polynomial distributionZ , Mult(θ ).In the LDA model, parameter settings, parameters, and most empirical studies are based on the rule of thumb, ie,settingα 50/K, β 0.01; the number of topics K is constrained by the subject consistency score, that is, when theconsistency score is the highest, K takes the most Excellent value; two Dirichlet distributions θ 、φ , whichcannot be directly obtained, are estimated by Gibbs sampling algorithm in actual research.3.2 Principle of Topic Recognition Based on LDA ModelThe topic contribution rate is the weight of the topic in the document collection and is a quantitative indicator ofthe research topic. The topic contribution rate can be expressed by the ratio of the sum of the weights of the researchtopic in the document collection to the volume of the document.For each topic, the formula for calculating lexical saliency based on the word frequency and the conditionalprobability distribution of the subject in the vocabulary is as follows:Saliency 𝑤 frequency 𝑤 𝑠𝑢𝑚 𝑃 𝑡 𝑤 𝑙𝑜𝑔 𝑃 𝑡 𝑤 𝑝 𝑡(1)The formula for calculating the relevance of the vocabulary for each topic distribution is as follows:Relevance 𝑤 𝑡 𝜆*P 𝑤 𝑡1𝜆 *𝑃 𝑤 𝑡 𝑃 𝑤Figure 1. topic identification and visualization flow chart205(2)
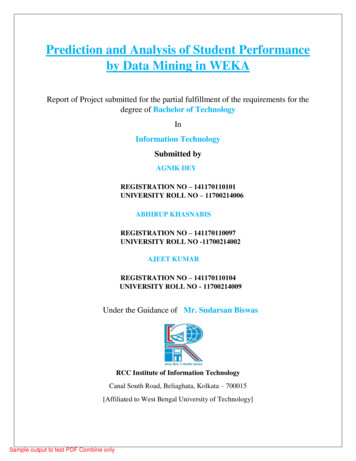
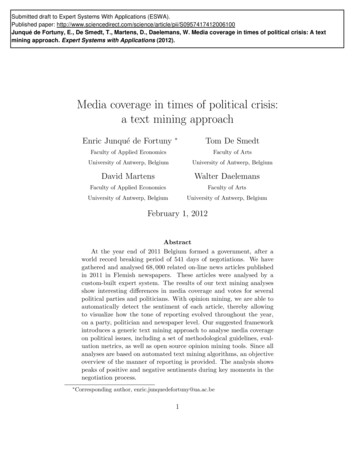
mas.ccsenet.orgModern Applied ScienceVol. 13, No. 1; 2019In equations (1) and (2), t represents the subject, w represents the vocabulary, P is the probability, Saliency issignificant, frequency is frequency, and Relevancy is correlation. According to formulas (1) and (2), the pyLDAvisfunction can be called in Python language to get a bubble-bar graph of the dynamic visualization of the subjectvocabulary. One of the bubbles represents a topic and the bar chart is the vocabulary distribution under the topic.Different subject bubbles correspond to different vocabulary bar charts, and different words correspond to differentsubject bubbles.3.3 Based on LDA Model Theme Recognition ProcessLDA-based research topic recognition mainly includes: data acquisition and processing, extraction based on LDAmodel theme and identification of cutting-edge topics. The identification process is shown in Figure 1.Data acquisition and processing stages. First, the acquired data is divided into words, deactivated words, and otherdata processing operations. The word segmentation uses Python's jieba data package; the stop word list uses theHarbin Institute of Technology stop vocabulary, Sichuan University Machine Intelligence Laboratory stop wordlist and Baidu stop vocabulary to de-emphasize, the stop word will also use Python get on.Construction and recognition based on the theme of the LDA model. LDA modeling is performed by Pythonlanguage. The Gibbs sampling algorithm is used to estimate the topic distribution parameters of the document dand the multi-distribution of the vocabulary on the topic z. The consistency number is used to select the optimalnumber of topics, and the topic number consistency score curve is drawn. Find the optimal number of topics andperform topic recognition in the case of optimal values.Visualization based on the theme of the LDA model. The pyLDAvis package in Python is used in conjunction withthe jupyter notebook to implement a dynamic visualization of the topic-vocabulary and to plot a breakdown of thetopic-related information for each article.4. Empirical research4.1 Data SourceIn the Chinese Knowledge Network database search, the chapter titled “Metrics” or “Metrics” was published in2017. The subject was a library of information and digital libraries. A total of 857 results were retrieved. The title,author, keyword, abstract and time fields of the results were extracted as the data source for the study.4.2 Data ProcessingThe word segmentation uses Chinese word segmentation component jieba, which supports three wordsegmentation modes: precise mode, trying to cut the sentence most accurately, suitable for text analysis; full mode,scanning all the words in the sentence that can be worded, very fast , but can not solve the ambiguity; the searchengine model, based on the precise mode, split the long words again, improve the recall rate, suitable for searchengine segmentation. The corpus based on this paper is in the form of text, so the text in each time slice issegmented by the precise mode. The specific code is shown in Figure 2, and the result is shown in Figure 3.Figure 2. Python language word segmentation codeFigure 3. word segmentation resultsTo stop words: remove punctuation, function words, quantifiers, conjunctions and other words that have nopractical meaning. This article uses Baidu stop vocabulary, Harbin Institute of Technology stop word list andSichuan University Machine Intelligence Laboratory stop word list and Baidu's preposition table, conjunction table,206
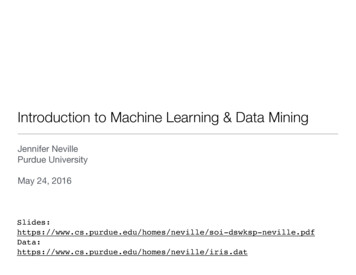
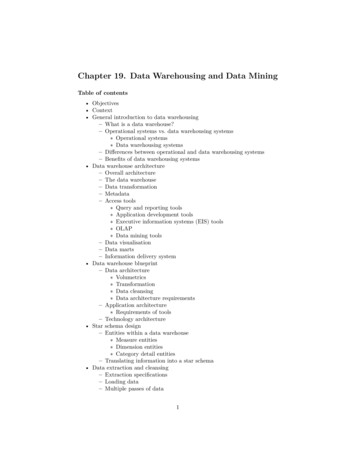
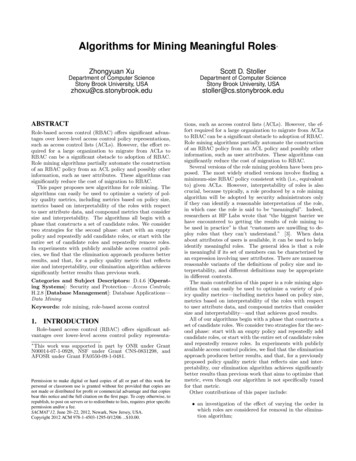
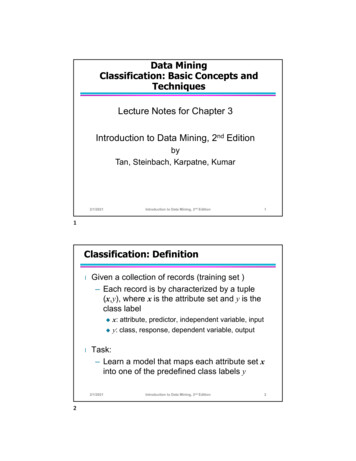
mas.ccsenet.orgModern Applied ScienceVol. 13, No. 1; 2019quantifier. Pre-run the results, the meaningless words involved are manually added to the deactivation table, andlater added; distribution, China, domestic, utilization, this article, reveal, etc., to stop the word Python code asshown in Figure 4. Show.Figure 4. Python language to stop word processing code4.3 Determination of the Number of TopicsIn order to determine the number of topics in the text set, this paper uses the evaluation index consistency score inthe statistical language model to determine the optimal number of topics. The formula for consistency score isdescribed as follows[9]:coherence(V) ,,𝑠𝑐𝑜𝑟𝑒 𝑣 , 𝑣 , 𝜖score 𝑣 , 𝑣 , 𝜖 𝑙𝑜𝑔 𝑝 𝑣 , 𝑣𝜖 𝑝 𝑣 𝑝 𝑣(3)(4)In formulas (3) and (4), the probability of each word appearing in the text set, and N is the number of all wordsappearing in the text set. The consistency score is calculated by the co-occurrence frequency of the words in thesliding window, which increases with the increase of sentence similarity, so the higher the consistency score is, thebetter[10].According to formulas (3) and (4), this paper uses Python to write a consistency score program for the theme ofLDA model to calculate the value of the consistency score under different subject numbers, and display it in theform of a broken line. 5 is shown. In the Gibbs sampling algorithm, the number of topics is selected, thehyperparameter is set to 50/K, the hyperparameter is set to 0.01, the number of sampling iterations is set to 1000,and multiple clustering experiments are performed using different subject numbers. From Figure 5, the number oftopics with the highest consistency score is 20, so the optimal number of topics is determined to be 20.Figure 5. topic consistency score4.4 LDA Model Theme VisualizationUse the built LDA topic model for topic mining, and determine the best number of topics by consistency score of20. The presentation of the theme visualization mainly includes: topic-vocabulary dynamic visualization map, sublist of related information about each topic of the article, and topic category-the article list with the highestcontribution rate of the topic.Use Python's pyLDAvis package to work with jupyter notebook to visualize the topic-vocabulary dynamics, asshown in Figure 6.207
mas.ccsenet.orgModern Applied ScienceVol. 13, No. 1; 2019Figure 6. Topic-Dynamic Visualization of Vocabulary (Topic 1)Figure 7. Topic-Dynamic Visualization of Vocabulary (Topic 10)Figures 6 and 7 are the subject-vocabulary visualization maps for Topic 1 and Topic 10, respectively. The bubbleon the left side of the map is the theme distribution, and the bubble represents a theme. The larger the bubble is,the more vocabulary belongs to the theme. The right side will dynamically display the vocabulary of thecorresponding theme. The blue bar on the right represents the frequency of vocabulary occurrence under all themes.Indicates how often the vocabulary appears under this topic. Different bubbles represent different themes, andcorresponding keywords and words are presented in descending order of relevance. The dynamic visualization ofthe subject-vocabulary not only shows the vocabulary with the highest contribution rate under each topic, but alsothe topic of each vocabulary contribution.Table 1. Article Topic - Vocabulary - Source Information Schedule (Top 10)Document NoDominant Topic05Topic PercContrib0.451190.9824220.8228KeywordsNursing, fund, database,metrology, author, funding,clinical, trend, hospital,regionAuthor, hotspot, keyword,institution, visualization,education, map, CNKI,network, dataDisease, database, treatment,patient, metrology, clinical,infection, 2016208TextResearch status ofhospital management inforeign countries:abibliometric analysisA quantitative analysis ofthe research on collegecounselors’professionalability based on CNKIdatabaseBibliometric analysis onadolescent myopiaprevention and control
mas.ccsenet.orgModern Applied ScienceVol. 13, No. 1; 20193140.9623International, Hotspot,Institution, Web of Science,Plant, Science4140.99275130.6224670.7456International, Hotspot,Institution, Web of Science,Plant, ScienceCollege, foundation,moxibustion, science,innovation, resources,training, culture,mathematics, teamReading, Keywords, Heavymetal, Medical, Author,Institution, Database,Pollution, Humanities7140.6722International, Hotspot,Institution, Web of Science,Plant, Science890.4059Author, hotspot, keyword,institution, visualization,education, map, CNKI,network, data990.5144Author, hotspot, keyword,institution, visualization,education, map, CNKI,network, dataEvolution and Researchof International HealthPromotion:BibliometricAnalysis andVisualization Based onCiteSpace VA bibliometric appraisalof research on Artemisiafrom 1986-2016Bibliometric Analysis onthe Reaearch Hotspots ofBlockchain in ChinaA Bibliometrical Analysisof the ExplorationResearch ofSimultaneous Adsorptionof Organic Pollutants andHeavy Metal lonsBiblimetrics Analysis onthe Trend of InternationalEarth Sciences in Recent5 yearsComparisons of MicroGovernment at Home andAbroad Based onBibliometric andVisualizationRetrospection of Hotspotin EducationalManagement Research inchinaTable 1 is one of the applications of the LDA model, which is to determine the theme of each document.Pythonbuilds one containing: Document No (article number), Dominant Topic (the subject of the article),Topic Perc Contrib (the topic's contribution rate), and Keywords (the subject) ), Text (Article source) List ofseveral elements, by calling the function of the LDA model, generate a predefined list and save it as EXCEL formatand save it. The actual generated EXCEL document contains information on the 20 subject papers, the subject ofthe article, the topic contribution rate, the subject words and the article source of the 857 articles compiled in 2017.Table 1 captures the first 10 articles presented.As can be seen from Table 1, the articles with the serial numbers 3, 4, and 7 are grouped into the topic 14. Thekeywords of the class are: international, database, hotspot, institution, Web of Science, plant, science, meaningthat these keywords appear together. The probabilities in these articles are the greatest, and the subject contributionrates are 0.9623, 0.9927, and 0.6722, respectively.Table 2. Topic-Vocabulary-Source of Contributions with the highest contribution rateTopicNum0Topic PercContrib0.994410.99730.9927KeywordsTextTheme, metrology, communitysports, science, hotspots, CSSCI,library, article, authorTeam, coronary heart disease,author, library, Chinese medicine,Chinese medicine, trend, databaseService, library, agriculture, scholar,2005-2015 , our country communitysports research analysis of the literaturemetrologyBibometrics analysis of status quo ofnursing research of colostomyirrigation in China from 2005 to 2015Bibliometric analysis in agricultural209
00027Modern Applied Sciencepatent, culture, science, metrology,theoryInnovation, metrology, cooperation,socialsciences,humanities,assessment, author, journal, , wisdom, knowledgeflow, innovation, governanceAuthor, metrology, , service, titution, SCI, author, Web ofScience, collaboration, ation, resources, training,culture, mathematics, teamEvaluation,indicator,data,metrology, influence, citation,science, AltmetricsDisciplinary structure, discovery,characteristics, keywords, co-words,knowledge mapVol. 13, No. 1; 2019Internet of Thing based in CitespaceAnalysis of Literature Measurementand Co-word Analysis Research Basedon I-U-R Collaborative Innovation inChinaFrom social manegement to socialgovernance:A quantitative analysis ofknowledge flow and topic evolutionEcono metric Analysts of authorcollaboration and research hotspots ofknowledge service domainHotspots and Frontier Themes ofTeacher Education Research in ChinaBased on Bibliometric Analysis ofCSSCI Database Papers from 1998 to2015A bibliometric analysis of SCI paperspublished by a medical Universitybased on the Date from 2010-2014A Biblimetrics Analysis on the Studiesof Mathematical Culture in ChinaResearch on Altmetrics Index ofHighly Cited Papers based on Articlelevel metricsResearch on Disciplinary Structure andEvolutionaryTrackbasedonMultidimensional MetrolodhMerge the topics of subject 1、2、5、7、10、11、15、17、18 which refer to medical vocabulary,such as drugtherapy, clinical infection, hospital care, medical institutions, liver orthopedics, glaucoma, medicine, chronicgastritis, coronary heart disease etc,and merge topics 3 and 14 containing agriculture and plants, so the remaining11 topics for metrology in 2017.Topic 0: The application of scientometrics in the field of sports, using CSSCI data for the analysis of topic hotspots;the highest contribution rate is Quan Huifang using literature, bibliometrics, mathematical statistics, comparativeanalysis, logical reasoning, etc. to CSSCI Sports The source of the journal is a data source, and a bibliometricanalysis of the community sports direction in China from 2005 to 2015.Topic 1: Econometric analysis in the medical field, including author, team and trend analysis; the highestcontribution rate is Xue Dongqun et al. using bibliometric analysis, 2005-2015 Chinese biomedical literaturedatabase, Chinese journal full-text database, VIP and The literature related to "colostomy lavage care" in thedatabase was analyzed and systematically analyzed, and the development trend of colostomy lavage nursingresearch in China was systematically analyzed to provide evidence-based evidence for clinical practice.Topic 3: The application of scientometrics in agriculture is based on patent data; the highest contribution rate isGuo Xiangyun and others using CNKI's 2010-2016 patent data as the research object, using Cite Space to analyzefrom the literature and social network. From the perspective of the agricultural Internet of Things research team,keyword characteristics were analyzed.Topic 4: The application of scientometrics in the field of humanities and social sciences; the highest contributionrate is Chuanwangwang's method based on bibliometric analysis and co-word analysis, which is produced in theChinese Social Science Citation Index (CSSCI) source journals collected in the past 10 years. 1407 papers withthe theme of academic research and collaborative innovation are analyzed and researched. Through the distributionof journals in statistical literature, high-yield institutions and high-frequency keywords and co-word matrixconstruction of the literature, factor analysis, cluster analysis, strategic coordinates and other methods are used for210
mas.ccsenet.orgModern Applied ScienceVol. 13, No. 1; 2019domestic Hotspot analysis and framework classification were carried out in the field of collaborative innovation.Topic 6: Applied metrology methods for social policy research; the highest contribution rate is Li Jinxi's CNKIdatabase as a data source, starting with the results of social management and social governance research literature,using scientometric methods, with Bib excel and Cite Space Related functions, quantitative research on theretrieved documents.Topic 8: Thematic discovery of the metrology method and the cooperation of the authors; the highest contributionrate is Gao Yang's analysis of the authors and cooperation in the field of knowledge services, including thedistribution of journals in the field, the number of authors added, the number of posts, High-yield researchers,source regions and institutions, cooperation and co-production rates, types of cooperation, and author cooperationnetworks.Topic 9: Visualization analysis of CNKI's educational data and related hotspot research; the highest contributionrate is Wang Hao's analysis of the growth trend of literature in the field of teacher education in China, thedistribution of journals, the author's publication volume, cooperation, and team growth. The degree of authoractivity, as well as the distribution of authors and sources of cited literature, and the research knowledge base andfrontier topics of ground-breaking literature, high-frequency citation analysis, citation literature clustering, andkey node literature.Topic 12: Analysis of author cooperation and institutional cooperation on WOS and SCI data; the highestcontribution rate is based on the comprehensive search of web of science database, JCR and ESI, and the collectionis completed with a medical university. The first or correspondent author of the unit published the SCI paper, andanalyzed the SCI paper high frequency author, high frequency cooperation organization and high frequencykeyword co-occurrence in the form of science and technology map.Theme 13: Quantitative analysis of scholars and papers in college mathematics disciplines; the highest contributionrate is the number of mathematics cultural papers published by Yan Changgen et al. in core journals, the author'ssource, the subject of interest, and the subject of research. Systematic analysis and quantitative analysis werecarried out in terms of research methods and other aspects.Topic 16: Using scientometrics for evaluation analysis (influence) and citation analysis; the highest contributionrate is Huang Xiao's top papers in the field of “social science and synthesis”, which is obtained through ESIdatabase and Altmetric.com. The article details of the social science, comprehensive "field literature", citedfrequency, Altmetrics indicators and other data. The high-cited papers construct the influence index system andstratify the Altmetrics index. Then the feature analysis and usability analysis of the Altmetrics index reveals thatthe Altmetrics score can comprehensively reflect the social influence of the highly cited papers. The Altmetricsscore is mainly recommended. , citation, discussion of the typical indicators in the three types of indicators, thenumber of news mentions, the number of blog mentions, the number of tweets mentioned, and from the statisticalanalysis results and usability indicators, policy mentions, Facebook mentions, wikis Encyclopedia citations,Google mentions, and readings in Mendeley are also worthy of attention.Topic 19: Analysis of the evolution of disciplinary structure based on co-word analysis; the highest contributionrate is Li Huizhen's analysis of key words, topics, authors, literature and other knowledge units in the core journalsof the past five years in the field of library and information, using content analysis Various co-word analysis,cluster analysis, co-citation and cooperative network analysis, etc., analyze the disciplinary structure and disciplineevolution from the micro, meso and macro perspectives.5. ConclusionBased on LDA's topic mining model, this paper can cluster domain topics in depth and visualize the clusteringtopics. The 2017 metrology data is used as an example to verify. Through data analysis, it can be confirmed that:1. Combining the LDA mining model with the Python-based pyLDAvis visualization method can not onlydynamically render the theme and corresponding vocabulary in both directions, but also the topic saliency andvocabulary. The presentation of contribution rate is also clear to achieve a better user experience; 2. The topicvocabulary-source list can present all the documents in the form of topic categories, topic contribution rates,keywords and document source titles, subject-vocabulary- The highest contribution rate source table presents eachtopic with the subject category, the highest contribution rate, the highest contribution rate document source titleand keywords.Inadequacies: 1. In terms of data, the lack of data sources in the data source has led to a large proportion of thesources of literature with the highest contribution rate. Data processing can be considered by machine learningmethods based on part-of-speech tagging and training, more intelligent use of useless words (such as verbs,211
mas.ccsenet.orgModern Applied ScienceVol. 13, No. 1; 2019quantifiers, conjunctions, etc.); 2. About model optimization, through the consistency score to select the optimalnumber of topics, there are some optimization methods that can improve the consistency score of the model.ReferencesBlei, D. M., Ng, A. Y., & Jordan, M. I. (2003). Latent dirichlet allocation. J Machine Learning Research Archive,3, 993-1022.Chen, J., & Lu, Q. (2015). Visualization analysis of topic mining research. Library Science Research, 14, .2015.14.001Cui, J., Du, W., & Guan, Y., et al. (2017). Research on the Evolution of Micro-blog User Information nki.is.2017.08.032Fen, J., & Zhang, Y. (2017). Research on the Method of Detecting and Analyzing Scientific Fronts Based on 0-7490.2017.08.009Guan, P., Wang, Y., & Fu, Z. (2016). Effect Analysis of Scientific Literature Topic Extraction Based on LDA .0252-3116.2016.02.018Guo, L., Li, Y., & Mu, D. et al. (2016). A LDA Model Based Topic Detection Method. Journal of NorthwesternPolytechnical University, 34(4), 698-702.Hu, J., & Chen, G. (2014). Mining and Evolution of Centent Topics Based on Dynamic LDA. Library andInformation Work, 58(2), 138-142. 023Li, X. D., Zhang, J., & Yuan, M. (2014). On Topic Evolution of a Scientific Journal Based on LDA Model. Journalof Intelligence, 7, 115-121.Lin, F., Xiahou, J., & Xu, Z. (2016). TCM clinic records data mining approaches based on weighted-LDA 2-016-3363-9Liu, J. H., & Cui, J. M. (2016). Domain-based hot research topic mining based on VOS viewer. IntelligenceExploration, 2, 13-16.Pavlinek, M., & Podgorelec, V. (2017). Text classification method based on self-training and LDA topic models.Pergamon Press, Inc. https://doi.org/10.1016/j.eswa.2017.03.020Ruan, G., & Xia L. (2017). Retrieval Results Clustering Application Research Based on LDA. Journal ofIntelligence, 36(3), 179-184.Shi, Q. K. (2013). Document tipic mening and document static visualization based on LDA. Master’s thesis,Guangxi University, Guangxi province, China.Song, Kai, Li., Xiu, xia., & Zhao, S., et al. (2017). International Knowledge Flow Analysis Based on LDA Model.Journal of Intelligence, 36(6), 55-60.Stevens, K., Kegelmeyer, P., & Andrzejewski, D. et al. (2012). Exploring topic coherence over many models andmany topics//Conference on Empirical Methods in Natural Language Processing.Tang, X. B., & Xiang, K. (2014). Hotspot Mining Based on LDA Model and Microblog Heat. Library andInformation Service, 58(5), 58-63. https://doi.or
Keywords: dynamic visualization, LDA model, metrology, Python, topics mining 1. Introduction Text content mining and semantic modeling are the research hotspots and core content in the field of information recommendation and data mining [1]. Mining text themes is a key and