Transcription
March 16, 2017Dr. Bradley Borum, Director of Research, Policy, and PlanningMr. M. Bob Pauley, Chief Technical Advisor of Research, Policy, and PlanningJeremy Comeau, Assistant General CounselIndiana Utility Regulatory Commission101 West Washington Street, Suite 1500 EIndianapolis, Indiana c.in.govElectronically deliveredRe:Public Version of the Selected Assumptions Summary Report for the Indiana 2016 IRPsDear Director Borum, Chief Technical Advisor Pauley, and Assistant General Counsel Comeau,Pursuant to the Indiana Utility Regulatory Commission’s (“IURC” or “Commission”)draft Integrated Resource Planning Rule, 170 IAC 4-7, Citizens Action Coalition of Indiana(“CAC”), Earthjustice, Indiana Distributed Energy Alliance (“IndianaDG”), Sierra Club, andValley Watch (collectively, “Commenters”) hereby submit the attached public version of theSelected Assumptions Summary Report for Indiana 2016 IRPs by Anna Sommer with SommerEnergy, LLC, and Elizabeth A. Stanton, PhD, with Applied Economics Clinic. We appreciatethe opportunity to comment, as well as Commission Staff’s willingness to provide us withextensions of time that allowed us to seek information from the utilities through an informaldiscovery process.The attached summary report highlights some of the key efficiency, commodity, andprice projections used by Indianapolis Power & Light (“IPL”), Northern Indiana Public ServiceCompany (“NIPSCO”), and Southern Indiana Gas & Electric Company d/b/a Vectren EnergyDelivery (“Vectren”) in their 2016 IRPs, to the extent that they are comparable. This material ispresented separately from our reports reviewing each of these individual IRPs because it includesinformation that is considered confidential to each utility and therefore cannot be viewed by theother utilities and/or information that is only meaningful within the context of comparing it toanother utility.We will be filing the confidential version of this report under seal in the utilities’ threeconfidentiality dockets, Cause Nos. 44873 (IPL), 44874 (NIPSCO), 44890 (Vectren); however,the utilities will not be served the fully unredacted version due to the above stated confidentialityissue.Thank you very much for this opportunity. We look forward to the issuance of andopportunity to comment on the Director’s Draft Report. Please feel free to contact JenniferWashburn, Counsel at Citizens Action Coalition, with any questions or concerns.1
Respectfully,Kerwin Olson, Executive DirectorJennifer Washburn, CounselCitizens Action Coalition of Indiana603 E. Washington Street Suite 502Indianapolis, Indiana .orgSteve Francis, ChairpersonSierra Club, Hoosier ChapterJodi Perras, Senior Campaign RepresentativeSierra Club, Indiana Beyond Coal1100 W. 42nd Street, Suite 218Indianapolis, Indiana s@sierraclub.orgLaura Ann Arnold, PresidentIndiana Distributed Energy Alliance545 E. Eleventh StreetIndianapolis, Indiana 46202317-635-1701Laura.Arnold@IndiananDG.netThomas Cmar, Staff AttorneyEarthjustice1101 Lake Street, Suite 405BOak Park, IL 60301(312) 257-9338tcmar@earthjustice.orgShannon Fisk, Managing AttorneyEarthjustice1617 John F. Kennedy Blvd., Suite 1130Philadelphia, PA 19103(215) 717-4522sfisk@earthjustice.orgJohn BlairValley Watch800 Adams AvenueEvansville, Indiana 47713(812) 464-5663ecoserve@valleywatch.net2
Summary Report for Indiana 2016 IRPsSubmitted to the IURC on March 16, 2017PublicConfidential Selected AssumptionsSummary Report for Indiana 2016 IRPs(Public Version)Submitted to the IURC on March 16, 2018Authors:Anna Sommer, Sommer Energy, LLCElizabeth A. Stanton, PhD, Applied Economics Clinicon behalf of CAC, Earthjustice, Indiana Distributed Energy Alliance,Sierra Club, and Valley Watch1
Summary Report for Indiana 2016 IRPsSubmitted to the IURC on March 16, 2017PublicOverviewThis summary report highlights some of the key efficiency, commodity, and price projectionsused by Indianapolis Power & Light Company (“IPL”), Northern Indiana Public Service Company(“NIPSCO”), and Southern Indiana Gas & Electric Company d/b/a Vectren Energy Delivery(“Vectren”) in their 2016 IRPs, to the extent that they are comparable. This material is presentedseparately from our reports reviewing each of these individual IRPs because it includesinformation that is considered confidential to each utility and therefore cannot be viewed by theother utilities and/or information that is only meaningful within the context of comparing it toanother utility.The report begins with a discussion of the adoption rates used in the energy efficiency potentialstudies performed by AEG on behalf of IPL and NIPSCO. AEG did not perform a potential studyfor Vectren for purposes of its 2016 IRP. The remainder of the report compares the capacity,power, gas, and coal prices used by these utilities.Analysis1. Adoption Rates in AEG Energy Efficiency Potential StudiesWe are concerned about AEG’s ability to produce a truly independent analysis of energyefficiency potential—particularly given: the current importance of energy efficiency potential studies to the determination of costeffective energy efficiency savings in Indiana IRPs; andthe current interpretation of how those IRP results should be translated to Indiana DSMplans.Many elements of these potential studies are a “black box” to us—that is, little or no explanationis provided of these studies’ rationale, assumptions, and methodology. AEG’s explanation ofTechnical Potential—found in both the IPL and NIPSCO 2016 Market Potential Studies1-provides an example of the functional impact of AEG’s lack of transparency in its modeling andpresentation:Technical Potential is the theoretical upper limit of energy efficiency potential,assuming that customers adopt all feasible measures regardless of cost orcustomer preference. At the time of existing equipment failure, customersreplace their equipment with the most efficient option available. In newconstruction, customers and developers also choose the most efficientequipment option. (AEG 2016 MPS for IPL, p.4; AEG 2016 MPS for NIPSCO,p.5)1AEG’s 2016 DSM Market Potential Study for IPL is Attachment 5.6 to the IPL 2016 IRP (“AEG 2016MPS for IPL”); AEG’s 2016 DSM Market Potential Study for Electricity for NIPSCO is Attachment B,Exhibit 1 to the NIPSCO 2016 IRP (“AEG 2016 MPS for NIPSCO”).2
Summary Report for Indiana 2016 IRPsSubmitted to the IURC on March 16, 2017PublicConceptually, AEG’s explanation is understandable to us, although we dispute theappropriateness of limiting potential by assuming that equipment is only replaced when it fails.2AEG’s use of this limiting definition will not lessen total technical potential over the life of anyparticular measure. It will, however, limit energy efficiency potential in the near term and iscounter-intuitive since customers can and do replace measures before they fail as a result ofenergy efficiency programs.Transparency would be an issue even if AEG had not made this limiting assumption. It would bevery difficult for any stakeholder to verify whether AEG’s estimates of technical potential actuallyconstitute a “theoretical upper limit of energy efficiency potential” because (a) the dataunderlying this estimate are not provided as part of the IRP, and (b) these data would beextremely time-consuming to review even if a stakeholder had them in their possession. Thesame critique could be made regarding the transparency of other potential levels estimated byAEG, e.g., economic, achievable, etc.One small window into AEG’s black box is its adoption rates applied to help determine the levelof achievable potential, which are readily comparable between NIPSCO and IPL. AEG givesachievable potential one definition in its 2016 MPS for NIPSCO:Achievable Potential refines economic potential by applying customerparticipation rates that account for market barriers, customer awareness andattitudes, program maturity, and other factors that affect market penetration ofDSM measures. (AEG 2016 MPS for NIPSCO, p.5)And two definitions in AEG’s 2016 MPS for IPL—one for each of two levels of achievablepotential: “Maximum Achievable” and “Realistic Achievable”. IPL selected the MaximumAchievable Potential for the construction of its DSM bundles, and defines it as follows:Maximum Achievable Potential (MAP) estimates customer adoption ofeconomic measures when delivered through DSM programs under idealmarket, implementation, and customer preference conditions and anappropriate regulatory framework. Information channels are assumed to bewell established and efficient for marketing, educating consumers, andcoordinating with trade allies and delivery partners. Maximum AchievablePotential establishes a maximum target for the savings that an administratorcan hope to achieve through its DSM programs and involves incentives thatrepresent a substantial portion of measure costs combined with highadministrative and marketing costs. This leads measures in MAP to be lesscost effective than in RAP, described below. (AEG 2016 MPS for IPL, p.5)In contrast, Realistic Achievable Potential is defined in AEG’s 2016 MPS for IPL as:Realistic Achievable Potential (RAP) reflects expected program participationgiven DSM programs under more typical market conditions and barriers tocustomer acceptance, non-ideal implementation channels, and constrainedprogram budgets. The delivery environment in this analysis projects thecurrent state of the DSM market in IPL’s service territory and projects typical2Kramer, Chris, and Glenn Reed (2012) Ten Pitfalls of Potential Studies. Regulatory Assistance Projectand Energy Future Group. 2-oct-24.pdf), p.9.3
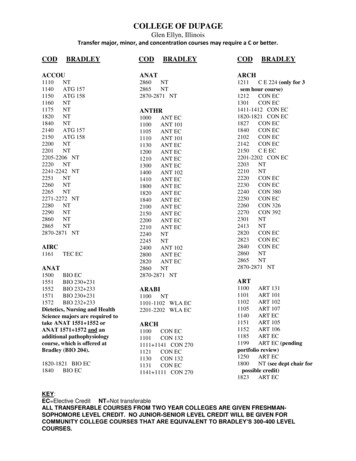
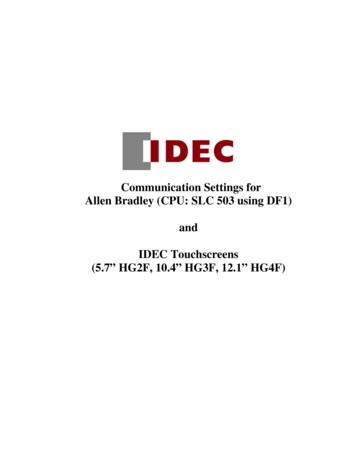
Summary Report for Indiana 2016 IRPsSubmitted to the IURC on March 16, 2017Publiclevels of expansion and increased awareness over time. (AEG 2016 MPS forIPL, p.5)These are not just semantic differences. The three definitions of achievable potentialcorrespond to three distinct sets of adoption rates. AEG’s adoption rates were provided asappendices to the NIPSCO and IPL 2016 DSM Market Potential Studies (see Figure 1). Neitherappendix is accompanied by any narrative describing how or on what basis these adoption rateswere developed.Figure 1. AEG 2016 NIPSCO and IPL MPS Residential measure achievable adoption ratesSource: AEG 2016 MPS for NIPSCO, Appendix B; AEG 2016 MPS for IPL, Appendix BFigure 1 raises several critical questions regarding AEG’s method for estimating achievablepotential:1. The NIPSCO “Achievable” adoption rates are very similar to the IPL Realistic Achievablerates. Can NIPSCO’s “Achievable” potential, therefore, be viewed as a lower boundaryon achievable potential? If it can, this means that any calculation of the MaximumAchievable potential is absent from NIPSCO’s study.2. The AEG Project Director was the same person for both the NIPSCO and IPL 2016MPSs; several other AEG staff members also worked on both reports. Why then dothese reports use different definitions of Achievable Potential?3. If there are data to back up this range of adoption rates as appropriate, then it wouldappear that different circumstances result in different adoption rates for the samemeasures. Can the circumstances associated with these divergent adoption rates speakto how efficiency programs are best designed so as to maximize participation and4
Summary Report for Indiana 2016 IRPsSubmitted to the IURC on March 16, 2017Publicsavings? Put another way, should Figure 1 be interpreted to reveal that NIPSCO isassuming that it will design its programs in a suboptimal manner?Differences between the commercial and industrial measure adoption rates between the twopotential studies also raise important questions. There is a single set of NIPSCO adoption ratesfor each of the commercial and industrial sectors. However, for IPL, adoption rates varydepending on the business type. For example, while an interior screw-in light bulb is assumed tohave the same adoption rate for every business type in the commercial sector in the NIPSCOstudy, different business types have different adoption rates for an interior screw-in light bulb inthe IPL study—and these differences are not limited to AEG’s so-called Maximum Achievableand Realistic Achievable potential. IPL’s business customers are assumed to have differentadoption rates depending on whether that light bulb is used in a small office, large office, school,college, and so on. Table 1 shows a selection of these adoption rates.Table 1. AEG 2016 MPS for NIPSCO and IPL Selected 2018 adoption rates for an interiorscrew-In lightbulbNIPSCO Commercial28%IPL Small Office (RAP)44%IPL Small Office (MAP)67%IPL Large Office (RAP)30%IPL Large Office (MAP)47%IPL School (RAP)25%IPL School (MAP)39%IPL College (MAP)7%IPL College (RAP)11%IPL Warehouse (MAP)16%IPL Warehouse (RAP)24%Source: AEG 2016 MPS for NIPSCO, Appendix B; AEG 2016 MPS for IPL, Appendix BNote: RAP is Reasonable Achievable Potential; MAP is Maximum Achievable Potential.For many other measures, AEG’s 2016 MPS for IPL assumes a similarly wide variety ofadoption rates depending on business type. AEG offers no substantiation for these very detaileddiffering adoption rates. Without further information and access to AEG’s underlying data, it isnot clear why the approach taken should be so different between the two utilities. It wouldappear that AEG has much more detailed adoption rate data available to it for IPL than it doesfor NIPSCO, but there’s no explanation for why that would be the case.Though certainly concerning, the purpose of this comparison is not to examine specific adoptionrates and try to determine which is appropriate, but rather to illustrate the lack of transparencythat characterizes AEG’s energy efficiency potential studies and the difficulty in providing athorough review of these studies even if they were more transparent. As we discuss in ourcomments on both the IPL and NIPSCO IRPs (see Section VI of our IPL report and Section IX5
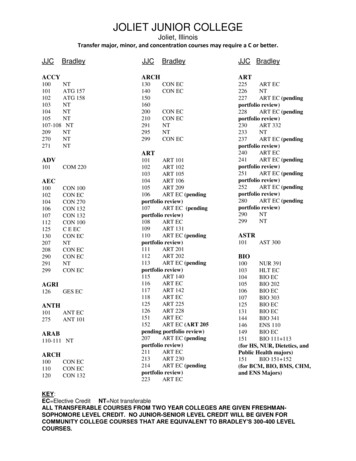
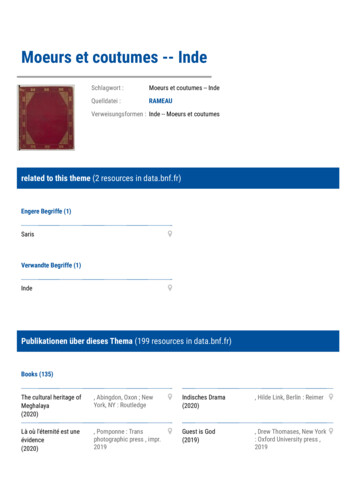
Summary Report for Indiana 2016 IRPsSubmitted to the IURC on March 16, 2017Publicof our NIPSCO reports), we think there is a better way to consider DSM within an IRP that doesnot place such a heavy emphasis on potential studies.2. MISO Capacity PricesMost of the capacity prices used by the three companies in their IRPs reach very high pricesrelative to recent historical prices in MISO Zone 6 (the zone in which Indiana is located): seeNIPSCO - retirement analysis, IPL, and Vectren ABB Fall 2015 Reference together with theMISO Zone 6 historical capacity price in Confidential Confidential Figure 2 below.Confidential Figure 2 also presents the NIPSCO capacity price used for “optimization,” which isvery different than that used for the retirement analysis for coal plants. In several instances,these forecasts take just three years toour estimated forecast of MISO’s Cost of New3Entry (CONE) going forward (shown in grey), which is noteworthy because CONE sets the capon MISO capacity prices in that it represents the highest offer price that can be made into theMISO Planning Resource Auction (PRA).Confidential Figure 2.Source: IPL 2016 IRP Confidential Attachment 5.10, NIPSCO Response to CAC 1-016 Attachment A,NIPSCO Base Preferred Plan.REP Strategist file provided in response to CAC 1-001, Vectren A-BusinessAs Usual GAF Input Summary Report provided in unnumbered informal discovery request, MISO andSNL Financial.3Note that we created this multi-year CONE projection by taking the 2017/2018 Planning Year CONEvalue and escalating it at 2% percent per year.6
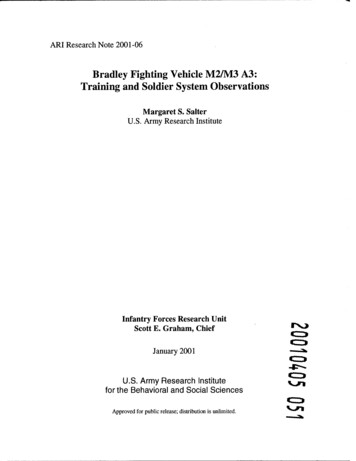
Summary Report for Indiana 2016 IRPsSubmitted to the IURC on March 16, 2017Public3. MISO Power PricesTo create the subsequent figures, we used an open access software called WebPlotDigitizer4 topull specific data points from confidential and public graphs in the NIPSCO and Vectren IRPs.We used this methodology because NIPSCO would not make available to stakeholders thespecific annual values for its commodity and power price inputs despite the fact that the graphsshowing this information are public. We followed the same practice for Vectren because thisinformation is only presented in graphical format in its IRP. IPL data was presented in tabularformat in ABB’s confidential report.As depicted in Confidential Confidential Figure 3 and Confidential Confidential Figure 4, all threeutilities presented base power price projections for both on and off-peak. These projectionsrepresent significant increases from historic levels by 2036. NIPSCO and IPL projected powerprices arethan those of Vectren.Confidential Figure 3.HistoricIPLNIPSCOVectren120 per 3420350Source: IPL 2016 IRP Confidential Attachment 2.2 – Table 2-1, NIPSCO 2016 IRP, Figure 8-7, Vectren2016 IRP Confidential Figure 6.6, and SNL Financial.4http://arohatgi.info/WebPlotDigitizer/7
Summary Report for Indiana 2016 IRPsSubmitted to the IURC on March 16, 2017PublicConfidential Figure 4.HistoricIPLNIPSCOVectren120 per 34203520360Source: IPL 2016 IRP Confidential Attachment 2.2 – Table 2-1, NIPSCO 2016 IRP, Figure 8-8, Vectren2016 IRP Confidential Figure 6.6, and SNL Financial.8
Summary Report for Indiana 2016 IRPsSubmitted to the IURC on March 16, 2017Public4. Natural Gas PricesIPL’s base natural gas price isthan those of the other two utilities (see ConfidentialConfidential Figure 5). There are some caveats to this comparison, however. While Vectren andIPL used Henry Hub forecasted prices, NIPSCO used a gas price projection for the ChicagoCity Gate. This means that a small amount5 of the difference between NIPSCO and the othergas prices can be attributed to the assumed delivery point.Confidential Figure 5.IPLNIPSCOVectren12 per 62025202420232022202120202019201820170Source: IPL 2016 IRP Confidential Attachment 2.2 – Table 3-1, NIPSCO 2016 IRP, Figure 8-3, andVectren 2016 IRP Confidential Figure 6.2.5For example, OTC Global Holdings show that Chicago forward prices are, on average, about 0.14 perMMBtu lower than Henry Hub prices.9
Summary Report for Indiana 2016 IRPsSubmitted to the IURC on March 16, 2017Public5. Coal PricesAgain, IPL’s Illinois Basin coal prices are muchthan those of Vectren and NIPSCO (seeConfidential Confidential Figure 6). We believe that all three forecasts are without transportationcosts and are in nominal dollars, so this should be a true apples to apples comparison. We havereason to question whether the coal forecast shown here for IPL is actually used in IPL’s IRP,however, because their modeling seems to show a muchprojection. We plan toinvestigate further and address this issue in our reply to the Director’s Draft report.Confidential Figure 6.IPLNIPSCOVectren4.54 per rce: IPL 2016 IRP Confidential Attachment 2.2 – Table 2-4, NIPSCO 2016 IRP, Figure 8-5, andVectren 2016 IRP Confidential Figure 6.3.10
sierrasteve@comcast.net jodi.perras@sierraclub.org Laura Ann Arnold, President Indiana Distributed Energy Alliance 545 E. Eleventh Street Indianapolis, Indiana 46202 317-635-1701 Laura.Arnold@IndiananDG.net Thomas Cmar, Staff Attorney Earthjustice 1101 Lake Street, Suite 405B Oak Park, IL 60301 (312) 257-9338 tcmar@earthjustice.org
![INDEX [gfgenealogy ]](/img/44/index-to-wills-cascade-county.jpg)