Transcription
VACCINEWASTAGEASSESSMENT
Vaccine Wastage AssessmentApril 2010Field assessment and observations fromNational stores and five selected states of India
Table of contentsExecutive summary .i123Background . 11.11.2Rationale of the assessment . 1Objectives of the assessment . 2Methodology . 32.12.22.32.42.52.62.72.8Selection of sites . 3Scope of data collection. 4Baseline assumptions . 4Timeline for retrospective data collection . 5Team preparation and field visits . 5Methods of data collection . 6Data compilation . 9Method of computation of wastage . 9Assessment results .113.1Wastage rates of vaccine at session site.123.2Wastage across type/form of vaccines .143.3Size of vaccine vial.153.3.1 Projected wastage rates with different vial sizes.153.3.2 Doses administered per session.183.3.3 Session held and availability of vials .193.4Cost impact of vaccine wastage .203.5Impact on vaccine storage volume .213.6Detailed analysis of individual vaccine at session site .223.6.1 BCG vaccine.223.6.2 Measles .243.6.3 OPV .273.6.4 DPT .303.6.5 TT .333.6.6 Hepatitis B .364Conclusion .405Recommendations .41
List of AbbreviationsANM: Auxiliary Nurse- MidwifeBCG: Bacillus Calmette- Guerin (vaccine against tuberculosis)DPT: Diphtheria, Pertussis, TetanusEPW: Empowered Procurement WingFIC: Fully Immunized ChildGMSD: Government Medical Store DepotHepB: Hepatitis BHQ: Head QuarterINR: Indian RupeesLHV: Lady Health VisitorMCH: Maternal and Child HealthMCHIP: Maternal Child Health Integrated ProjectMIS: Management Information SystemMoHFW: Ministry of Health and Family WelfareNIHFW: National Institute of Health and Family WelfareOPV: Oral Polio VaccinePHC: Primary Health CenterPROMIS: Procurement Management Information SystemTT: Tetanus ToxoidUIP: Universal Immunization ProgramUNICEF: United Nations Children’s FundUSD: United States Dollar ( )USAID: United States Agency for International DevelopmentWHO: World Health Organization
Executive summaryIndia has one of the largest Universal Immunization Programs (UIP)in the world. The program budgets more than USD 500 million everyyear for immunizing children against vaccine preventable diseases,including the polio eradication program.Effective vaccine utilization is an integral component of vaccinesecurity and vaccine wastage is one of the key factors to beconsidered with regards to vaccine forecasting and need estimation.The objectives of the vaccine wastage assessment were to provide anestimation of vaccine wastage rate, type and place of occurrence andrecommend measures to reduce wastage at various levels.This assessment was carried out in 5 states of India between October2009 and February 2010. The states were selected based on thedifferences in coverage rates of immunization and geographicdistribution. Retrospective data from a 6 months period betweenApril 2009 and September 2009 was collected through field visits toselected sites. Both qualitative and quantitative data were collected.Findings suggested that there were poor documentation of vaccinewastage at all levels. Wastage rates vary from state to state andamong different vaccines. Highest vaccine wastage occurs at servicedelivery level (27% for DPT and 61% for BCG at outreach sessionsite) as compared to the supply chain levels (Measles3.5%, others 1 %). Poor documentation of vaccine wastage at supply chain isone of the responsible factors for this very low value. Session size,vial size, formulation (liquid vs. lyophilized, oral vs. injectable) alsoinfluences vaccine wastage.To reduce vaccine wastage with optimal increase in cold chain spaceand management, it is recommended that the size of the outreachsessions should be optimized to cover target beneficiaries. Smallervials have lower wastage; however it should be balanced withavailable cold chain space. Any change in formulation should becoupled with refresher trainings of health workers and revisedmicro planning. WHO recommended multi dose vial policy may beconsidered in fixed sites.Vaccine Wastage Assessment
BACKGROUND1BackgroundIndia has one of the largest Universal Immunization Programs in theworld. The program budgets more than US 500 million every yearfor immunizing children against vaccine preventable diseases,including the polio eradication program. The country is presentlydeveloping new strategies to increase immunization coverage andreach more children with quality vaccines. These efforts arechallenged by the problems of securing adequate quality andquantity of vaccines for the program. In addition, deficiencies invaccine management and high wastage increase vaccine demand andinflate overall program cost.Vaccine management and logistics were some of the key issues thatwere critically appraised in the National UIP Review conducted in2004. Some of the specific shortcomings observed were:a. Large differences between reported and evaluated coverage wasimpacting vaccine supply;b. Instances of shortages and stock-outs of different vaccines wereaffecting the immunization activities at different levels;c. Wastage was high and not monitored;d. There was no matching of vaccine requirements and supplies atlower levels;e. Calculation of vaccine requirements was not linked to microplanning or realistic coverage or wastage data.The national cold chain assessment carried out in 2008 conducted byMinistry of Health and Family Welfare, Government of India andUNICEF recommended conducting vaccine wastage study to arrive atactual wastage rate.1.1Rationale of the assessmentEffective vaccine utilization is an integral component of vaccinesecurity and vaccine wastage is one of the key factors to beconsidered for vaccine forecasting and need estimations. The lack ofknowledge of wastage rates provides inadequate estimations ofneeds and subsequent stock-outs and/or overstocks. High vaccinewastage inflates vaccine demand and increases unnecessary vaccineprocurement and supply chain costs.Vaccine Wastage AssessmentPage 1
BACKGROUNDIn the context of India, any reduction of vaccine wastage will have apositive impact on the ongoing efforts towards vaccine security. Oneof the priority actions in India's multi-year strategic plan 2005-10 isto improve vaccine stock management through developing andimplementing guidelines to specify standard processes for orderingand maintaining stock levels; monitor stock-outs and wastage.A better sense of vaccine utilization and wastage rates can lead tobetter planning and management of vaccine stocks. This assessmentwill give some information about the current wastage level, whichcould then lead to appropriate guidance and trainings to reducevaccine wastage.1.2Objectives of the assessmentProvide an estimation of vaccine wastage rate, type and place ofoccurrenceProvide realistic estimates of vaccine wastage rates to guideprocurement and supply of vaccineRecommend measures to reduce wastage at various levelsVaccine Wastage AssessmentPage 2
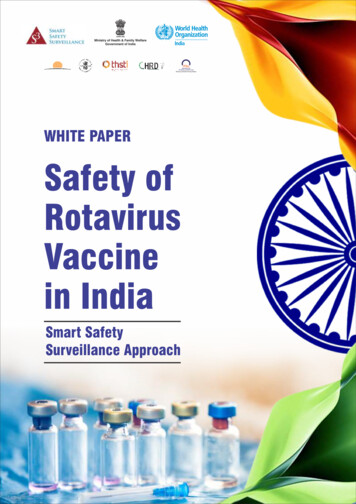
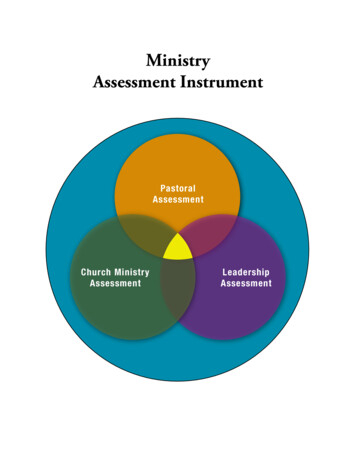
METHODOLOGY2Methodology2.1Selection of sitesThe assessment was carried out in 5 states of India. The states wereselected based on the differences in coverage rates of immunizationand were geographically distributed across the nation.Table 1: Criteria for selection of statesStateDPT-3coverage*Geographical zoneUttar mil Nadu95.7SouthHimachal Pradesh85.1Hilly and cold climate* NFHS 2005-2006Figure 1-: DPT-3 Coverage of selected states for assessment (NFHS 20052006)Vaccine Wastage AssessmentPage 3
METHODOLOGY2.2 Scope of data collectionThe assessment required data collection from all levels of the vaccinesupply chain network. The reasons of wastage of vaccine at supplychain level (national/state and district stores) are substantiallydifferent than at the service delivery level. This required separatepreparation of data collection forms for the supply chain level andthe service delivery level.Sites selectedFor studyGovernment Medical Store Depot :National level4 GMSDVaccine arrives mainly from international sourcesState levelVaccine arrives from National suppliers directlyand also from GMSDDistrict levelVaccine arrives from state store and issues toPHCs and CHCsPrimary Health Center5 States9 districtsOutreach sessions at sub center and Anganwadi centerForm A1Form A2(Quantitative)(Qualitative)17 PHCsVaccine arrives from district and issues toSub centers and mobile teams (last vaccine storage point)Sub center levelData collection forms forvaccine storage levelData collection forms forservice delivery level34 SubcentersForm B1Form B2(Quantitative)(Qualitative)Figure 2: Scope of data collection using the forms designed for assessmentA total of four data collection forms were developed to record thesupply and vaccination details of routine immunization. Broadly, datacollection forms were classified into quantitative and qualitative, oneeach for supply chain level and service delivery level. These formsare attached as annexes to this report.2.3Baseline assumptionsThe assessment covered all the vaccines in the nationalimmunization schedule of India. The assumptions of vaccine vial size(number of doses per vial and storage volume per dose of vaccines)is based on the vaccines supplied for UIP program in India. Tablebelow lists the baseline assumptions used in this assessment.Vaccine Wastage AssessmentPage 4
METHODOLOGYTable 2: Baseline assumptionsVaccineTypeNumberof dosesper FICNumber of Mode ofdoses per administrvialationStoragevolume perdose (cm3)CostperdoseIn TLiquid3.5HepBLiquidOPVLiquidFIC- Fully Immunized ChildThe assessment covered the data of vaccinations done at outreachsession sites only and it does not include the fixed vaccination sites inhospitals and PHCs (except in Tamil Nadu where vaccinationsessions were predominantly held in PHCs under supervision ofdoctors).2.4Timeline for retrospective data collectionThe study was conducted for the period of 6 months from April 2009to September 2009. The retrospective data was collected throughfield visits to selected sites.2.5Team preparation and field visitsThe field visits were planned in consultation with Ministry of Healthand Family Welfare (MoHFW), state governments and partneragencies. A total of 5 teams were formed. The field visits were carriedout in the period of October-November 2009, except Meerut districtof Uttar Pradesh that was visited in the month of February 2010.Visits were planned to cover two districts from each of the selectedstates except of Himachal Pradesh where only one district wasvisited. Himachal was selected for geographical challenges of hard toreach areas and sparsely populated terrain.Vaccine Wastage AssessmentPage 5
aduHimachalpradeshDistricts and their PHCsUnnaoMeerut Nawabganj Purva Daurala BhoorbaralKamrupDarrang Azara Hajo Siphajhar KhurapettaPuneSatara Khedshivpur Kunjarwadi Bhuinj Vadgaon HaweliKanchipuramCuddalore Ayyampetta Vallam Melpattapakam Tiruvadahevuran2 subcentersfrom eachPHCkinnaur Ribba SpillowFigure 3: Selected sites for assessment2.6Methods of data collectionThe quantitative data was collected from sources ranging from stockbook registers, indent challan books to ANMs record book ofimmunization activities. Wherever available, temperature logbooksand electronic temperature records were reviewed. This informationcan explain the reasons for vaccine wastage whether due to freezingor exposure of vaccine to high temperature. Following table lists thesources of data for various levels.Vaccine Wastage AssessmentPage 6
METHODOLOGYStateKey Programofficials metRecords andreports assessedTasks performedDistrictPHCState Immunization OfficerState Cold Chain OfficerStore-in-chargeLogistics managerComputer operator (MIS)District Immunization OfficerStore inchargeComputer operator (MIS)Vaccine stock booksVaccine Bin cardsMIS reportsPhysical stock of vaccineTemperature recordsVaccine stock booksMIS reportsIndentsPhysical stock of vaccineTemperature recordsVaccine stock booksMIS reportsIndentsPhysical stock of vaccineTemperature recordsBriefing about missionSelection of districtsCollection of vaccine transactionsCollection of temperature recordsBriefing about missionSelection of PHCsCollection of vaccine transactionsCollection of temperature recordsBriefing about missionBriefing about missionSelection of sub centersCollection of vaccinationCollection of vaccine transactions dataCollection of temperature recordsValidation ofdataCompilationof dataMedical officerCold chain handlerSub centerAnalysis ofdataMedical officerANMMIS reportsANM record booksMCH registerIndentsAssessment resultFigure 4: Key activities during assessmentVaccine Wastage AssessmentPage 7
METHODOLOGYTable 3: Records reviewed during assessmentLevelGMSDState storeDistrict storePHCSub centersStockmovementBin cards;Stock books;Monthly reports;Vaccine ArrivalReports;Stock books;Indents;Shipment logs;Monthly reports;Vaccine stock booksVaccine in and tenanceRecords of data loggers;Temperature trace records ofcold rooms;Manual temperature records;Not applicableManual temperature records;MCH registers;ANM record books;Micro plans;The qualitative data was collected by interviewing staff at all thelevels. Table 4 details the profile of staff interviewed with listedsubject of focus.Table 4: Baseline for qualitative assessment questionnaireStaffprofilePlanningManagement OperationalReportingInstances ofvaccinedamagesandcorrectiveactions;Instances r inchargeSource oftargetestimates;Schedule ofvaccine arrival;Temperaturemonitoring;Placementand trainingof humanresources;Store wledge ofvaccinemanagement;LHV orANMMicro plans;Waste disposalmethods;Tracking tools;Vaccinesupplynetwork;Stock cords;Sessionsplanned andheld;Vaccine Wastage AssessmentMonthlyreporting;Page 8
METHODOLOGYStaffprofilePlanningCold chainhandlerComputeroperatorManagement OperationalReportingMaintenanceschedules;POL supply forgenerators;Reportingof faultyequipment;MonthlyreportingData collectionfor PROMIS;Maintenanceoftemperatureand coldchainequipment;Data entryinto PROMISsystem;Monthlyreporting;2.7 Data compilationThe data collected during field visits was compiled using a MicrosoftExcel based database. Each site was given a unique number fortracing the data for verification. All the analysis and results includedin this report were directly produced through this custom made tool.The comments and qualitative data were captured in this report innarrative form though relative sections.2.8Method of computation of wastageVaccine wastage is an expected component of any immunizationprogram. In order to ensure that no child is missed during animmunization session, the vaccine is procured with estimatedwastage. However, this should be balanced with optimal wastage,safety concerns, and timely use of vaccines. The key in optimum useof vaccine supplied is by preventing vaccine shortages while limitingoverstocks. Vaccine wastage can be minimized by determiningavoidable causes of loss of vaccine and taking corrective action.Wastage is often defined as “loss by use, decay, erosion, or leakage orthrough wastefulness” .To understand vaccine wastage, it isimportant to understand vaccine usage. Vaccine usage is defined asthe proportion of vaccine administered against vaccine issued.Equation 1 illustrates formulae used for Computing vaccine usageand wastage. Vaccine wastage is the opposite of vaccine usage. Thus,the Vaccine Wastage Rate can be defined as 100 minus the vaccineusage rate. The wastage rate directly determines the “wastage factor”which needs to be established for each vaccine in the immunizationschedule to accurately plan vaccine needs.Vaccine Wastage AssessmentPage 9
METHODOLOGYVaccine wastage can primarily be divided into two categories of: (1)wastage in unopened vials; (2) wastage in opened vials. It is useful toknow what type of wastage is more prevalent in immunizationsettings to better plan corrective action. Common causes of wastagein unopened and opened vials of vaccines are listed in table below(source: Vaccine wastage in Bangladesh published in Elsevier 2010).Table 5: Reasons of vaccine wastageVaccine wastage in unopened vials Vaccine wastage in opened vialsThe expiry date has reached;Vaccine exposed to heat and vaccine;vial monitor (VVM) reached unusablestage;The vaccine has been frozen;Breakage;Missing inventory;Theft;Discarding unused vials returnedfrom outreach session.All the causes listed in the left columnand:Discarding remaining doses at the end ofthe session;Not being able to draw the number ofdoses in a vial;Poor reconstitution practices;Submergence of opened vials in thewater;Suspected contamination ;Poor vaccine administration practices.The wastage of vaccine happens at multiple levels duringtransportation, storage and at vaccination session sites (servicedelivery levels). The method of computation of wastage rates atsupply chain and session site is different, as shown in equation below.Wastage at supply chain levelTotal doses damaged or expired or lostduring the assessment periodVaccine wastage rate Total doses supplied during the assessment period(opening stock doses received)Wastage at Service delivery levelVaccine utilization rate Total doses immunized(Total doses issued-total doses returned)Vaccine wastage rate 100 - vaccine utilization rateEquation 1: Formulas used for computing vaccine wastage ratesVaccine Wastage AssessmentPage 10
ASSESSMENT RESULT3Assessment resultsThe assessment of vaccine wastage at all levels of the supply chainfor the six months period reflects that maximum wastage occurs atthe session site (BCG vaccine had the maximum wastage of 61%). Atsupply chain level, maximum wastage found was of Measles vaccine(3.46% of total supplied) at the state vaccine store. All other vaccineshad vaccine wastage of less than 1% at supply chain level.The other key findings from the field are:a. There has been poor documentation of vaccine wastage at alllevels. It is difficult to reflect the wastage rates based ondocumentation. The results in the assessment were derivedfrom computation based on stock movements andvaccination records (refer to equation 1 for formula ofderiving wastage).b. The wastage is different for each vaccine, but the supply ofvaccines is computed by 25% wastage rate for all vaccinesexcept BCG. BCG requirement is computed either based onsession size or using 50% wastage rate;c. The wastage rate varies across the states;d. Unopened vials were not returned from many sessions (7%of issued OPV vials discarded unopened);e. Data mismatch: Doses consumed and number of childrenimmunized1 does not match at few places;f. Each session should have at least one vaccine vial of eachantigen. This was not always followed as assessmentreflected that only 47% of sessions had atleast one vial of allthe vaccine available during the session.The vaccine wastage rates observed during assessment at variouslevels are summarized below.Assessment teams referred to various sources of information recorded atsession sites. Data reported had inconsistencies.1Vaccine Wastage AssessmentPage 11
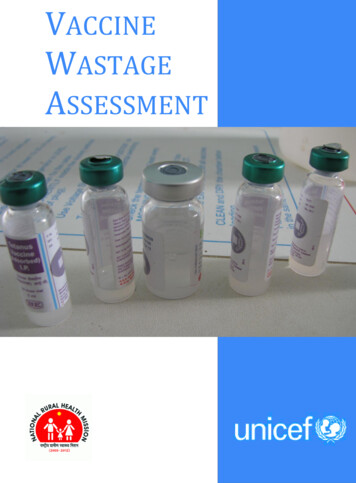
ASSESSMENT RESULTTable 5: Wastage ratesVaccine wastage rateVaccineState storeDistrict storePHCSession easles3.463%--35.09%3.1Wastage rates of vaccine at session siteThe BCG vaccine had the maximum wastage rates followed by OPVand Measles, TT, HepB and 9%34%The bars below shows the average wastage rate of each vaccine whilethe arrow line shows the maximum and minimum wastage as foundin states.Vaccine Wastage AssessmentPage 12
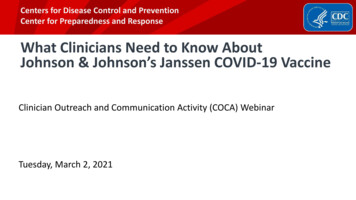
ASSESSMENT RESULT80%75%- Himachal Pradesh70%68%- Assam61%58% - Himachal60%58%- Himachal57%- Himachal55% - Maharashtra50%54%- Maharashtra 47%40%38% - Uttar Pradesh35%34%33%30%27%30%- Tamil Nadu26% - Uttar Pradesh20%20%- Uttar Pradesh17% Uttar Pradesh10%0%BCGOPVAverage wastage rateMeaslesUttar PradeshHimachal PradeshTTTamil NaduHepBDPTMaharashtraAssamFigure 5: Average wastage rate at session sitesHimachal Pradesh had maximum wastage of all the vaccine except forTT and BCG. TT and BCG are also at higher side compared to averagewastage of all the states. This high wastage of vaccine is clearly due tosparsely populated area of Himachal Pradesh. Uttar Pradesh beingthe most populated state had the lowest wastage rate. This impliesthat the wastage rate is inversely proportionate to density ofpopulation.The difference between the maximum and minimum wastage rate isas much as 39% (DPT) and as low as 14% (BCG). This demonstratethat the wastage of lyophilized vaccine remains high in all the statesbut wastage of vaccine, that can be used through multiple sessions,can be reduced through optimum planning of sessions.The detailed assessment of individual vaccine is included in section3.6 below.Vaccine Wastage AssessmentPage 13
ASSESSMENT RESULT3.2Wastage across type/form of vaccinesThe vaccines in immunization schedule are of different sizes andcome in liquid and lyophilized form. Comparison of wastage rateacross these different forms of presentation is explained below:Liquid and Lyophilized: Four vaccines, namely, OPV, DPT, TT andHepB are supplied in liquid form and two vaccines, BCG and Measlesare freeze dried or lyophilized vaccines. The average wastage rates ofliquid form were found to be less (38%) then the lyophilized form(50%). This is because the lyophilized vaccine needs to be discardedwithin four hours after TTHepB5038liquidLyophilizedOPV4735355 dose10 doseOPVBCGMeaslesDPTTTHepB473520 doseOralInjectableFigure 6: Wastage across type/form of vaccine at service delivery levelVial size: The vaccines are supplied in three different sizes of vials;five doses (Measles), 10 doses (BCG, DPT, TT and HepB) and 20 doses(OPV) per vial. Among these, there was negligible difference inVaccine Wastage AssessmentPage 14
ASSESSMENT RESULTwastage between five doses and 10 doses vials (both averagingapproximately 35%) whereas OPV in 20 dose vial had the wastagerate of 47%. This instigated the detailed analysis on the optimum vialsize for each vaccine, which is covered in section 3.3.Mode of Administration: All the vaccines except for OPV areadministered through injection. OPV is orally given. The averagewastage rate of injectable vaccine is 35% and oral (OPV) is 47%.Since OPV is the only vaccine that is supplied in size of 20 dose pervial and only vaccine that is administered orally, there is insufficientground to conclude that mode of administration affects vaccinewastage.3.3Size of vaccine vialThe vaccines used in India come in the different vial sizes (refer toTable 2). The number of doses per vial can be crucial in reducing thevaccine wastage. The combination of the average size of the outreachsessions, the cold chain storage space required and cost of vaccinecan help in deciding the optimum size of vaccine vials to be used inthe immunization program.3.3.1 Projected wastage rates with different vial sizesTable below shows the vial sizes typically available for each type ofvaccine in the UIP schedule.Table 7: Size of vaccine vials (doses per vial)VaccineBCGMeaslesDPTTTHepBOPVAvailable vial sizes (Doses per vial)1 25 10 20 Used inIndia10510101020The vaccination coverage data from the assessment (number of dosesimmunized per session) is used below with different vial sizes toarrive at projected wastage of vaccine. It is shown that the wastage isleast with a vial size of 5 doses. But the possible reduction of wastageVaccine Wastage AssessmentPage 15
ASSESSMENT RESULTby introducing smaller size vials should not result in incrementalneed of cold chain storage space.Figure 7 and 8 below show the comparative analysis of projectedwastage of vaccines against different vial sizes and the storagevolume required per dose.The storage volume of 5 doses per vial size is not available for mostof the vaccines. The incremental vaccine storage volume for 10 dosesvials from 20 doses vials is 20% for DPT and TT, 33% for HepB and100% for OPV. Considering the similar ratio between 10 doses vialsand 5 doses vials, the reduction of vial size will have a substantialincremental impact on storage volume requirements, which willincrease the demand of storage and transportation facilities.Projected wastage with different vial sizes% of vaccine wastage projected against vial sizesSize of vial as used in routine immunization program80%5 dose/vial10 dose/vial20/dose per MeaslesOPVTTFigure 7: Projected wastage with different vial sizesFigure 7 show that all the vaccine except OPV are suppliedusing the optimal size (number of doses per vial). The vaccinevials with less number of doses (5 for example) does reduce thevaccine wastage however, figure 8 show that vials with lesserdoses needed higher volume of storage. The equilibrium ofquantities wasted and optimizing storage space lies in twofactors of supply capacity of these vaccines by manufacturersand cost of procuring the vaccine.Vaccine Wastage AssessmentPage 16
ASSESSMENT tageCost 4.95Numberof dosesper FIC14513.53Cost perFIC (INR)1.9214.48.419.094.3814.8553.06Cost perFICincludingwastage4.927.211.514.06.622.286.4% sharein FICcost4%27%16%17%8%28%% sharein FICincludingwastage6%31%13%16%8%26%Even though Measles vaccine is the most expensive vaccine perdose, the OPV and HepB share the 55% of total cost of fullyimmunizing the child. Reduction in wastage of these twovaccines will have an impact on total budget for the program.Likewise, even though the wastage of BCG vaccine is highamong all the vaccine, BCG being the cheapest vaccine inimmunization schedule, the reduction in wastage of BCG willhave negligible impact on program budget.Storage volume per dose54.54.5445 DoseCubic Centimeter per dose3.5 3.510 Dose3.5320 Dose3332.52.52.5221.51.2 1.2110.50BCGDPTHepBMeaslesOPVTTFigure 8: Storage volume of various vial sizesVaccine Wastage AssessmentPage 17
ASSESSMENT RESULT3.3.2 Doses administered per sessionWastage of vaccines has a direct relationship with session size(number of beneficiaries per session) and vial size. Taking OPV as anexample, for about 17.5% of sessions where upto 5 doses per sessionwere given, the wastage was more than 75% (as less than 5 doseswere drawn from a 20-dose vial.)Percentage of sessions where the vaccine was opened for 74%23.38%0.38%* Only those sessions where the corresponding vaccine vial was openedUpto 5 doses administered per session held11 to 20 doses administered per session6 to 10 doses administered per sessionMore then 20 doses administered per sessionFigure 9: Percentage of sessions where the vaccine vial was openedAbout 36% of sessions, 11 to 20 doses of OPV were administered pervial, which means that vial size of 20 dose of OPV is suitable for only36% of the total sessions. For the remain
dose (cm3) Cost per dose In INR BCG Lyophilized 1 10 Injectable 1.2 1.92 Measles Lyophilized 1 5 Injectable 5.0 9.09 DPT Liquid 5 10 Injectable 3 1.68 TT Liquid 3.5 10 Injectable 3 1.25 HepB Liquid 3 10 Injectable 3.8 4.95 OPV Liquid 4 20 Oral 1 3.6 FIC- Fully Immunized Child