Transcription
FACT SHEETSAS ENTERPRISE MINER 5.3 Unearthing valuable insight—profitable data mining resultswith less time and effortWhat does SAS Enterprise Miner do?SAS Enterprise Miner streamlines thedata mining process to create highly accurate predictive and descriptive modelsbased on analysis of vast amounts ofdata from across an enterprise. Forwardthinking organizations today are usingSAS data mining software to detectfraud, anticipate resource demands,increase acquisition and curb customerattrition.Why is SAS Enterprise Miner important?SAS offers the industry’s most comprehensive suite of predictive analytics andinteractive visualization capabilities thatempower users to explore and exploitcorporate data for strategic businessadvantage.For whom is SAS EnterpriseMiner designed?SAS Enterprise Miner is designed for dataminers, marketing analysts, databasemarketers, risk analysts, fraud investigators, business managers, engineersand scientists who need to make useof increasing amounts of data to makefast and accurate decisions and thosewho play strategic roles in identifyingand solving critical business or researchissues.Turning increasing amounts of rawdata into useful information remainsa challenge for most organizationsbecause the answers that identify keyopportunities often lie buried in mountains of data.Which customers will purchase whatproducts and when? Which customersare leaving and what can be done toretain them? How should rates be setto ensure profitability? How are maintenance schedules and operationalinfluences affecting a component’stime-to-failure?To gain an edge in today’s competitivemarket, powerful advanced analyticsolutions are required to extract knowledge from vast stores of data. Discovering previously unknown patterns candeliver actionable strategies for decisionmakers across your enterprise. Thosewho choose to implement data mininginto their business processes will beable to stay competitive in today’s fastmoving markets.Unfortunately, digging through largevolumes of data without a properprocess and without the right toolscan be unwieldy and inefficient. Newapproaches and techniques for conducting data mining investigations arerapidly evolving. While one analyticalapproach may work well on one datacollection, it may not perform well givennew data sources or new businesschallenges.Thus, it is crucial to have a wide selection of analysis tools at hand. Differenttools produce different models andonly when you compare models sideby-side can you see which data miningapproach produces the best “fit.” If youstart with a workbench that has limitedanalytical tools (i.e., only regressionor only decision trees), the end resultcould be a model with limited predictive value.The demand for actionable analyticalinformation is growing in every industry,putting increased pressure on dataminers to produce more and bettermodels in less time. Functional andindustry-specific business issues canall benefit from incorporating analytics in a secure and scalable manner.This requires collaboration across theorganization, and calls for a powerful,multipurpose data mining solution thatcan be tailored to meet different needs.SAS Enterprise Miner provides anoptimized architecture so data minershave more time to create highly accurate predictive and descriptive models.Results can be shared throughoutan organization to deliver analyticalinformation and incorporate models intobusiness processes. SAS Analytics iskey component of the SAS EnterpriseIntelligence Platform. The SAS Enterprise Intelligence Platform extends thevalue of your existing systems, ensuresa clean, consistent view across yourenterprise and helps you predict withprecision to reduce uncertainty andgain competitive advantage in themarketplace.
Key benefits A broad set of tools supports thecomplete data mining process.Regardless of your data mining preferences or skill level, SAS providesflexible software that addresses complex problems. Going from raw datato accurate, business-driven datamining models becomes a seamless process, enabling the statisticalmodeling group, business managersand the IT department to collaboratemore efficiently. A powerful, easy-to-use GUI helpsboth business analysts and statisticians build more models, faster.SAS Enterprise Miner’s process flowdiagram environment dramaticallyshortens model development timefor both business analysts and statisticians. SAS Enterprise Miner 5.3includes an intuitive user interface thatincorporates common design principles established for SAS software andadditional navigation tools for movingeasily around the workspace. It supports user-defined entry notes, whichprovide a complete documentation trailof the analytical process flow and areuseful for version control. The GUI canbe tailored for all analysts’ needs viathe flexible, interactive property sheets,code editors and display settings. Enhance accuracy of predictionsand easily surface reliable business information. Better performingmodels with new innovative algorithmsenhance the stability and accuracyof predictions, which can be verifiedeasily by visual model assessmentand validation metrics. Both analytical and business users enjoy a common, easy-to-interpret visual view ofthe data mining process. Predictiveresults and assessment statistics frommodels built with different approachescan be displayed side-by-side for easycomparison. The created diagramsserve as self-documenting templatesthat can be updated easily or appliedto new problems without starting overfrom scratch.Product overviewSAS Enterprise Miner is delivered asa modern, distributed client-serversystem. To enhance the data miningprocess, this software is designedto work seamlessly with SAS’ dataintegration, analytics and businessintelligence technologies.An integrated, complete viewof all your enterprise dataData mining is most effective whenit is part of an integrated informationdelivery strategy that includes datagathered from diverse sources, including the Web, call centers, surveys,customer feedback forms, and transactional point-of-sale systems. With theaddition of SAS Text Miner, both structured and unstructured data analysiscan be incorporated into an integratedpredictive modeling solution thatencompasses a full spectrum of dataanalysis and knowledge discovery.Designed around an organized andlogical GUI for data mining successThe data mining power of SAS Enterprise Miner is delivered via an easy-touse, drag-and-drop interface designedto appeal to experienced statisticiansas well as less-seasoned business analysts. The advanced analytic algorithmsare organized under the core tasks thatare performed in any successful datamining endeavor. SAS’ data miningprocess encompasses five primarysteps: Sampling, Exploration, Modification, Modeling and Assessment.(SEMMA). In each step, you are guidedthrough an array of actions to performas the data mining project develops.By deploying nodes from the SEMMAmenu system, you can apply advancedstatistics, identify the most significantvariables, transform data elements withexpression builders, develop models topredict outcomes, validate accuracy,and eventually generate a scored dataset with predicted values to deploy intoyour operational day-to-day businessenvironment.An unmatched suite of modelingtechniques and methodsSAS Enterprise Miner provides superioranalytical depth with an unmatchedsuite of predictive and descriptive modeling algorithms, including decisiontrees, bagging and boosting, neuralnetworks, memory-based reasoning,hierarchical clustering, linear and logistic regression, associations, sequenceand Web path analysis, and more. Theassortment and breadth of analyticalalgorithms has grown to include stateof-the-art methods such as gradientboosting, partial least square regression and vector machine support.Sophisticated set of data preparation,summarization and exploration toolsPreparing data for mining usually isthe most time-consuming aspect ofdata mining endeavors, but not withSAS Enterprise Miner. Interactive datapreparation wizards include the interactive binning tool, the rules builder tooland numerous data transformationoptions. Quantitative experts no longer
need to struggle with manipulatingdisparate data sources before beginning to apply their expertise to buildingmodel. Merging data files, addressingmissing values, clustering, droppingvariables and filtering for outliers canall be performed easily within SASEnterprise Miner. Extensive descriptivesummarization features and interactive data exploration tools enable eventhe most novice users to examinelarge amounts of data in dynamicallylinked, multidimensional plots that support critical business decisions. Theoutcome? Quality data mining resultsthat are tailored and optimally suited tospecific business problems.Business-based model comparisons,reporting and managementAssessment features for comparingmodels in terms of lift curves and overall ROI profitability metrics offer valuablecollaboration opportunities for dataminers to discuss results with businessdomain experts. Models generated withdifferent modeling algorithms can beevaluated consistently using a highlyvisual assessment interface. An innovative Cutoff node examines posteriorprobability distributions to define theoptimal decisions for the businessproblem at hand.Reports that span the entire analysiscan be easily created and distributedfor internal documentation and externalreporting. Model result packages canbe created and centrally managedby the SAS Metadata Server. Dataminers, business managers and datamanagers alike can effectively managelarge model portfolios throughout theorganization via a Web-based modelrepository system.An automated scoring processdelivers faster resultsScoring is the process of regularly applying a model to new data for implementation into a real operational environment. This process can be tedious,especially when it entails the manualrewriting or converting of code, whichcan delay model implementation andintroduce potentially costly mistakes.Scoring code must mirror the entireprocess that led to the final predictivemodel, including every data preprocessing step. SAS Enterprise Minerautomatically generates score code inSAS, C, Java and PMML. The scoringcode can be deployed in a variety ofreal-time or batch environments withinSAS, on the Web or directly in relationaldatabases. Results from SAS Enterprise Miner can be passed directly toother SAS business solutions, such asSAS Marketing Automation, SAS ModelManager and SAS Real-Time DecisionManager for further deployment of datamining results into a real-time operational environment.edit and submit code interactively whileviewing the log and output listings.Default selection lists can be extendedwith custom developed tools writtenwith SAS code or XML logic, whichopens the entire world of SAS to dataminers.High-performance grid-enabledworkbenchThe innovative Java client/SAS serverarchitecture provides unprecedentedflexibility for configuring an efficientinstallation that scales from a singleuser system to very large enterprisesolutions. Powerful servers may bededicated to computing, while endusers move from office to home toremote sites without losing accessto mining projects or services. Manyprocess-intensive server tasks, such asdata sorting, summarization, variableselection and regression modeling, aremultithreaded and processes can berun in parallel for distribution across agrid of servers or scheduled for batchprocessing.Open, extensible designfor ultimate flexibilityModern, distributable data miningsystem suited for large enterprisesThe customizable environment of SASEnterprise Miner provides the ability toadd tools and include personalized SAScode via the Extension node. ExistingSAS models developed outside of theSAS Enterprise Miner environment canbe integrated easily into the customizable process flow environment whilemaintaining full control of each syntaxstatement. The Extension node facilityincludes interactive editor features fortraining and score codes. Users canSAS Enterprise Miner is deployable viaa thin-client Web portal for distributionto multiple users with minimal maintenance of the clients. Alternatively, thecomplete system can be configuredon a standalone PC. SAS EnterpriseMiner supports Windows servers andUNIX platforms, making it the softwareof choice for organizations with largescale data mining projects.
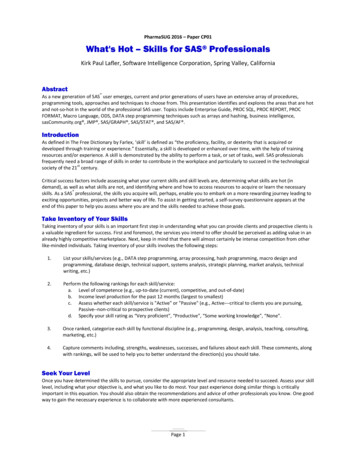
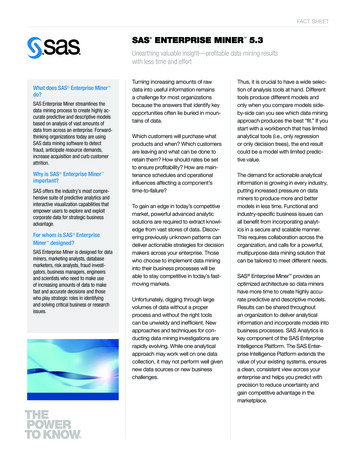
SAS Enterprise Miner Key FeaturesMultiple interfaces Easy-to-use GUI for building processflow diagrams: Build more and better models faster. Web deliverable. Access the SAS programmingenvironment. XML diagram exchange. Reuse diagrams as templates forother projects or users. Batch processing: Encapsulates all features of the GUI. SAS macro based. Embed training and scoring processes into customized applications.Scalable processing Server-based processing. Asynchronous model training. Stop processing cleanly. Grid computing: Distribute mining process acrossa cluster. Schedule training and scoring tasks. Load balancing and resource allocation. Parallel processing—run multiple toolsand diagrams concurrently. Multithreaded predictive algorithms. All storage located on servers.Accessing and managing data Access to more than 50 file structures. SAS Library Explorer and LibraryAssignment wizard. Drop variables node. Merge data node. Append node. Filter outliers: Apply various distributional thresholdsto eliminate extreme interval values. Combine class values with fewer thann occurrences. Interactively filter class and numericvalues. Metadata node for modifying columnsmetadata such as role, measurementlevel and order. Integrated with SAS Data Integration Studio and SAS Enterprise Guidethrough SAS Metadata Server: Build training tables for miningin SAS Enterprise Miner. Deploy SAS Enterprise Minerscoring code.(Figure 1) With SAS Enterprise Miner’s GUI, projects are persisted on the analytical server,enabling data miners to collaborate on the analyses. The process flow diagram is aself-documenting template that can be easily updated or applied to new problemsand shared with other analysts.(Figure 2) Filter extreme values interactively with the Filter node. The shaded regiondefines the variable range to keep.
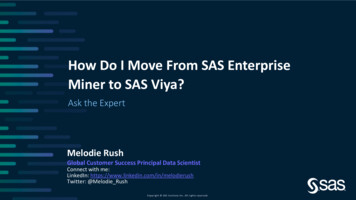
Sampling Simple random. Stratified. Weighted. Cluster. Systematic. First N. Rare event sampling.Data partitioning Create training, validation and testdata sets. Ensure good generalization of yourmodels through use of holdout data. Default stratification by the class target. Balanced partitioning by any classvariable. Output SAS tables or views.Transformations Simple: log, square root, inverse, square,exponential, standardized. Binning: bucketed, quantile, optimalbinning for relationship to target. Best power: maximize normality,maximize correlation with target,equalize spread with target levels. Interactions editor: define polynomialand nth degree interaction effects. Interactively define transformations: Define customized transformationsusing the Expression Builderor SAS code editor. Compare the distribution of the newvariable with the original variable. Predefine global transformation codefor reuse.(Figure 3) Develop customized transformations using the interactive Transform Variablesnode Expression Builder.Interactive variable binning Quantile or bucket. Gini variable selection. Handle missing values as a separategroup. Fine and coarse classing detail. Profile bins by target. Modify groups interactively. Save binning definitions.Rules Builder node Create ad-hoc data driven rules andpolicies. Interactively define the value of the outcome variable and paths to the outcome.(Figure 4) Interactively bin variables to maximize relationship with the target or conformto business policies. Split or combine bins interactively and save the grouping definitionsfor reuse.
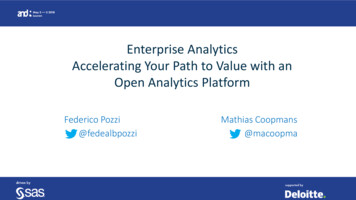
Data replacement Measures of centrality. Distribution-based. Tree imputation with surrogates. Mid-medium spacing. Robust M-estimators. Default constant. Replacement Editor: Specify new values for class variables. Assign replacement values forunknown values. Interactively cap extreme intervalvalues to a replacement threshold.Descriptive statistics Univariate statistics and plots: Interval variables: n, mean, median,min, max, standard deviation, scaleddeviation and percent missing. Class variables: number of categories,counts, mode, percent mode, percentmissing. Distribution plots. Statistics breakdown for each levelof the class target. Bivariate statistics and plots: Ordered Pearson and Spearmancorrelation plot. Ordered chi-square plot with optionfor binning continuous inputs inton bins. Coefficient of variation plot. Variable selection by logworth. Other interactive plots: Variable worth plot ranking inputsbased on their worth with the target. Class variable distributions across thetarget and/or the segment variable. Scaled mean deviation plots.Graphs/visualization Batch and interactive plots: scatterplots, scatter plot matrix plots box plots,constellation plots, contour plots, needleplots, lattice plots, 3D charts, densityplots, histograms, multidimensionalplots, pie charts and area bar charts. Segment profile plots: Interactively profile segments of datacreated by clustering and modelingtools. Easily identify variables that determine the profiles and the differencesbetween groups.(Figure 5) Explore your data interactively with parallel axis, density, 3D rotating scatterplots and other plots. Interactive graphs are automatically saved within the results of theGraphics Explore node. Easy-to-use Graphics Explorer wizard and Graphics Explore node: Create titles and footnotes. Apply a WHERE clause. Choose from several color schemes. Easily rescale axes. Surface the underlying data from standard SAS Enterprise Miner results to developcustomized graphics. Plots and tables are interactively linked supporting tasks such as brushing and banding. Data and plots can be easily copied and pasted into other applications or save as BMP files. Interactive graphs are automatically saved in the Results window of the node.Clustering and self-organizing maps Clustering: User defined or automatically chooses the best k clusters. Several strategies for encoding class variables into the analysis. Handles missing values. Variable segment profile plots show the distribution of the inputs and other factorswithin each cluster. Decision tree profile uses the inputs to predict cluster membership. PMML score code. Self-organizing maps: Batch SOMs with Nadaraya-Watson or local-linear smoothing. Kohonen networks. Overlay the distribution of other variables onto the map. Handles missing values.
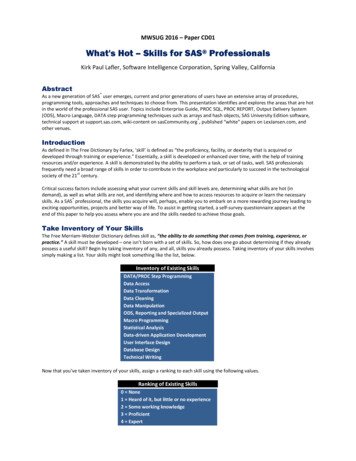
Market basket analysis Associations and sequence discovery: Grid plot of the rules ordered byconfidence. Statistics line plot of the lift,confidence, expected confidence,and support for the rules. Statistics histogram of the frequencycounts for given ranges of supportand confidence. Expected confidence versusconfidence scatter plot. Rules description table. Network plot of the rules. Interactively subset the rules based onlift, confidence, support, chain length,etc. Seamless integration of the rules withother inputs for enriched predictivemodeling. Hierarchical associations (experimental): Derive rules at multiple levels in thehierarchy. Specify parent and child mappings forthe dimensional input table.Web path analysis Scalable and efficient mining of themost frequently navigated paths fromclickstream data. Mine frequent consecutive subsequences from any type of sequence data.Dimension reduction Variable selection: Remove variables unrelated to targetbased on a chi-square or R2 selectioncriterion. Remove variables in hierarchies. Remove variables with many missingvalues. Reduce class variables with largenumber of levels. Bin continuous inputs to identifynonlinear relationships. Detect interactions. Principal components: Calculate Eigenvalues and Eigenvectors from correlation and covariancematrices. Plots include: principal componentscoefficients, principal componentsmatrix, Eigenvalue, Log Eigenvalue,Cumulative Proportional Eigenvalue.(Figure 6) View market basket profiles. Interactively subset the rules based on lift,confidence, support, chain length, etc. Interactively choose the number of components to be retained. Mine the selected principal components using predictive modeling techniques. Variable clustering: Divide variables into disjoint or hierarchical clusters. Eigenvalue or Principal Components learning. Includes class variable support. Dendogram tree of the clusters. Selected variables table with cluster and correlation statistics. Cluster network and R-Square plot Interactive user override of selected variables. Time series mining: Reduce transactional data into a times series using several accumulation methodsand transformations. Analysis methods include seasonal, trend, time domain, seasonal decomposition. Mine the reduced time series using clustering and predictive modeling techniques. Manage time metrics with descriptive data.
SAS Code node Write SAS code for easy-to-complex datapreparation and transformation tasks. Incorporate procedures from other SASproducts. Develop custom models. Create SAS Enterprise Miner extensionnodes. Augment score code logic. Easy-to-use program developmentinterface: Macro variables to reference datasources, variables, etc. Interactive code editor and submit. Separately manage training, scoringand reporting code. SAS Output and SAS LOG. Create graphics.Consistent modeling features Select models based on either thetraining, validation (default) or test datausing several criterion such as profitor loss, AlC, SBC, average square error,misclassification rate, ROC, Gini,KS (Kolmogorov-Smirnov). Incorporate prior probabilities into themodel development process. Supports binary, nominal, ordinal andinterval inputs and targets. Easy access to score code and allpartitioned data sources. Display multiple results in one windowto help better evaluate model performance. Decisions node for setting target eventand defining priors and profit/loss matrices.Regression Linear and logistic. Stepwise, forward and backward selection. Equation terms builder: polynomials, general interactions, effect hierarchy support. Cross validation. Effect hierarchy rules. Optimization techniques include:Conjugate Gradient, Double Dogleg,Newton-Raphson with Line Search orRidging, Quasi-Newton, Trust Region. Dmine Regression Node: Fast forward stepwise least squaresregression. Optional variable binning to detectnonlinear relationships. Optional class variable reduction. Include interaction terms. PMML score code(Figure 7) Integrate customized SAS code to create variable transformations, incorporateSAS procedures, develop new nodes, augment scoring logic, tailor reports and more.(Figure 8) Develop linear and logistic regression models using stepwise selectionmethods along with several model selection diagnostics.
Decision trees Methodologies: CHAID, classification and regressiontrees, bagging and boosting, gradientboosting. Tree selection based on profit or liftobjectives and prune accordingly. K-fold cross validation. Splitting criterion: Prob Chi-squaretest, Prob F-test, Gini, Entropy, variancereduction. Automatically output leaf IDs as inputsfor subsequent modeling and groupprocessing. Displays English rules. Calculates variable importance forpreliminary variable selection and modelinterpretation. Unique consolidated tree maprepresentation of the tree diagram. Interactive tree desktop application: Interactive growing/pruning of trees;expand/collapse tree nodes. Define customized split pointsincluding binary or multiway splits. Split on any candidate variable. Copy split. More than 13 tables and plots aredynamically linked to better evaluatethe tree performance. Easy to print the tree diagram on asingle page or across multiple pages. Based on the fast underlyingARBORETUM procedure. PMML score code.Neural networks Neural Network node: Flexible network architectures withextensive combination and activationfunctions. 10 training techniques. Preliminary optimization. Automatic standardization of inputs. Supports direction connections. Autoneural Neural node: Automated multilayer perceptron building searches for optimal configuration. Type and activation function selectedfrom four different types of architectures. PMML score code. DM Neural node: Model building with dimensionreduction and function selection. Fast training; linear and nonlinearestimation.(Figure 9) Develop decision trees interactively or in batch. Numerous assessment plotsto help gauge overall tree stability are included.(Figure 10) Fit highly complex nonlinear relationships using the SAS Enterprise MinerNeural Network node. Architectures include general linear models, multilayerperceptrons, radial basis functions, along with a wide range of combination,activation and error functions.
Partial Least Squares node Especially useful for extracting factorsfrom a large number of potentialcorrelated variables. Also performs principal componentsregression and reduced rank regression. User or automatic selection of thenumber of the factors. Choose from five cross validation strategies. Supports variable selection.Support vector machines (experimental) Maximal margin classifier is usefulfor problems with large numbers ofvariables. Implements Lagrangian SVM byMangasarian and Musicant.Rule induction Recursive predictive modeling technique. Especially useful for modeling rareevents.Two-stage modeling Sequential and concurrent modeling forboth the class and interval target. Choose a decision tree, regression orneural network model for each stage. Control how the class predictionis applied to the interval prediction. Accurately estimate customer value.(Figure 11) Extract a candidate set of uncorrelated latent factors or components usingthe Partial Least Squares node. Standard SAS Enterprise Miner model fit statistics areproduced for comparison with other challenger modeling methods.Memory-based reasoning k-nearest neighbor technique tocategorize or predict observations. Patented Reduced DimensionalityTree and Scan.Model ensembles Combine model predictions to form apotentially stronger solution. Methods include: Averaging, Voting andMaximum.Group processing with theStart and End Groups nodes Repeat processing over a segment ofthe process flow diagram. Use cases: stratified modeling, baggingand boosting, multiple targets, crossvalidation.Model evaluation Model Comparison node to comparemultiple models in a single frameworkfor all holdout data sources. Automatically selects the best modelbased on the user-defined model criterion. Supports user override.(Figure 12) Create bagging and boosting models using the Start and End Groups nodesalong with the Decision Tree node. In this example, separate random samples ofthe training data are used to develop decision trees, which are combined to form apotentially more stable and stronger classifier. The Decision Tree ensemble is thencompared against Neural Network and Gradient Boosting challenger models usingthe Model Comparison node. Extensive fit and diagnostics statistics.Lift charts; ROC curves.Profit and loss charts with decision selection; Confusion (classification) matrix.Class probability score distribution plot; Score ranking matrix plots.Interval target score rankings and distributions.Cutoff node to determine probability cutoff point(s) for binary targets:User override for default selection.Max KS Statistic.Min Misclassification Cost.Maximum Cumulative Profile.Max True Positive Rate.Max Event Precision from Training Prior.Event Precision Eqaul Recall.
Reporter node Uses SAS Output Delivery System tocreate a PDF or RTF document of aprocess flow. Helps document the analysis processand facilitate results sharing. Document can be saved and is includedin the SAS Enterprise Miner ResultsPackages. Includes image of the process flowdiagram. User-defined notes entry.Scoring Score node for interactive scoring in theSAS Enterprise Miner GUI. Automated score code generation inSAS, C, Java and PMML. SAS, C and Java scoring code capturemodeling, clustering, transformationsand missing value imputation code. Deploy models in multiple environments.Model registration and viewing Register SAS Enterprise Miner modelsto a SAS Metadata Server. Provides integration with SAS ModelManager enabling: Version control of the scoring code. Lifecycle management of the modelsfrom development to production. Model monitoring. View registered models with the SASEnterprise Miner Model Viewer: Query by model name, algorithm,target and date ranges. View Fit Statistics and score code. Provides integration with SAS EnterpriseGuide and SAS Data Integration Studio: Score models using the SAS Enterprise Guide Model Scoring Task. Score models using the SAS DataIntegration Studio Mining ResultsTransformation.(Figure 13) Evaluate multiple models together in one easy-to-interpret framework usingthe Model Comparison node.(Figure 14) Score SAS Enterprise Miner models using the SAS Enterprise Guide ModelScoring Task. Data miners can register SAS Enterprise Miner models that can bedeployed by business analysts using SAS Enterprise Guide.
SAS Enterprise Miner Technical RequirementsSAS Model Registration(optional Web tier configuration)Client environmentSAS includes a referenceimplementation of Apache Tomcat.Sites can optionally choose to licenseanother Web server or WebDAVcomponent directly from the vendor: AIX: Release 5.1, 5.2, 5.3 on POWER HP-UX Itanium: Release 11iVersion 1, 2 and 3 Solaris on SPARC: Version 8, 9, 10 Linux for x86 (x86-32): Red
What does SAS Enterprise Miner do? SAS Enterprise Miner streamlines the data mining process to create highly ac-curate predictive and descriptive models based on analysis of vast amounts of data from across an enterprise. Forward-thinking organizations today are using SAS data mining software to detect fraud, anticipate resource demands,